FEDS Notes
June 23, 2023
"The International Role of the U.S. Dollar" Post-COVID Edition
Carol Bertaut, Bastian von Beschwitz, and Stephanie Curcuru1
An updated version of this note is available here.
For most of the last century, the preeminent role of the U.S. dollar in the global economy has been supported by the size and strength of the U.S. economy, its stability and openness to trade and capital flows, and strong property rights and the rule of law. As a result, the depth and liquidity of U.S. financial markets is unmatched, and there is a large supply of extremely safe dollar-denominated assets.
The role of the dollar has received renewed attention in the post-COVID world, in part due to the increased U.S. sanctions on Russia following its invasion of Ukraine.2 We review the use of the dollar in international reserves, as a currency anchor, and in transactions.3 We find that the dollar remains the dominant currency and plays an outsized international role as measured by usage in international reserves and other dimensions relative to the U.S. share of global GDP (see Figure 1). According to our index combining various factors, the dollar's international usage is basically unchanged over the past 5 years. In fact, it even plays an outsized role in areas of financial innovation such as by being the dominant anchor for stablecoins. That said, several possible sources of challenges to dollar dominance are discussed at the end of the note.
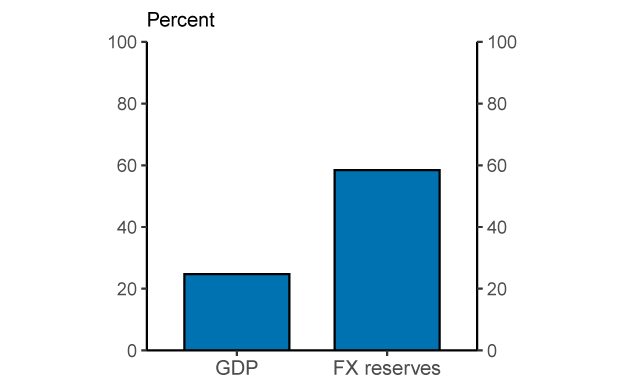
Note: U.S. share of 2022 nominal world GDP compared to the dollar's share of globally disclosed foreign exchange reserves in 2022-Q4. At current exchange rates.
Source: IMF COFER; IMF World Economic Outlook database.
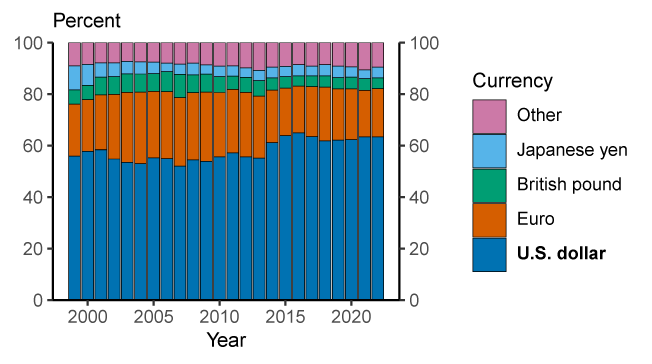
There is widespread confidence in the U.S. dollar as a store of value
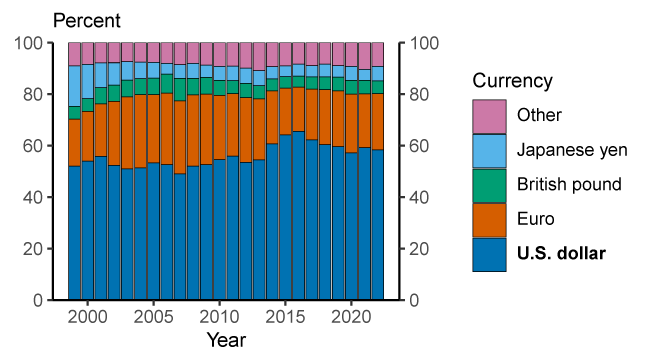
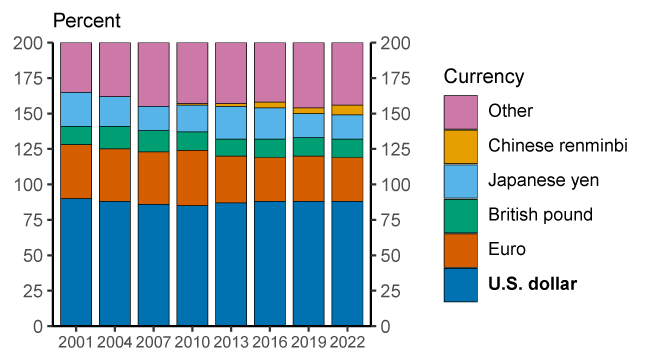
A key function of a currency is as a store of value which can be saved and retrieved in the future without a significant loss of purchasing power. One measure of confidence in a currency as a store of value is its usage in official foreign exchange reserves. As shown in Figure 2, the dollar comprised 58 percent of disclosed global official foreign reserves in 2022 and far surpassed all other currencies including the euro (21 percent), Japanese yen (6 percent), British pound (5 percent), and the Chinese renminbi (3 percent). It was little changed in 2022, suggesting that U.S. sanctions of Russia following the invasion of Ukraine have so far not led to a major reallocation of reserves. That said, the dollar share has declined from 71 percent of reserves in 2000, as foreign reserve managers have added to their portfolios a wide range of smaller currencies including the Australian and Canadian dollars (IMF COFER). Even with this decline, the dollar remains by far the dominant reserve currency.
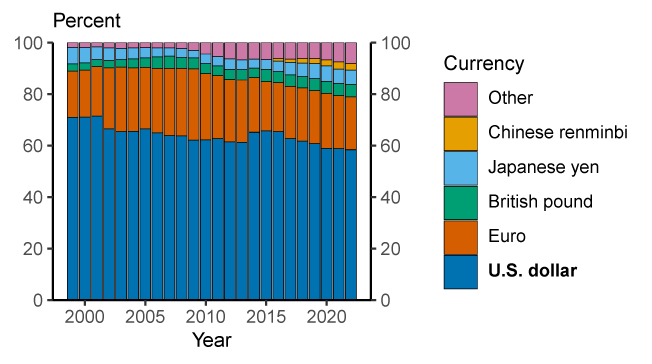
Note: Share of globally disclosed foreign exchange reserves. At current exchange rates. Data are annual and extend from 1999 through 2022. Legend entries appear in graph order from top to bottom. Chinese renminbi is 0 until 2015-Q2.
Source: IMF COFER.
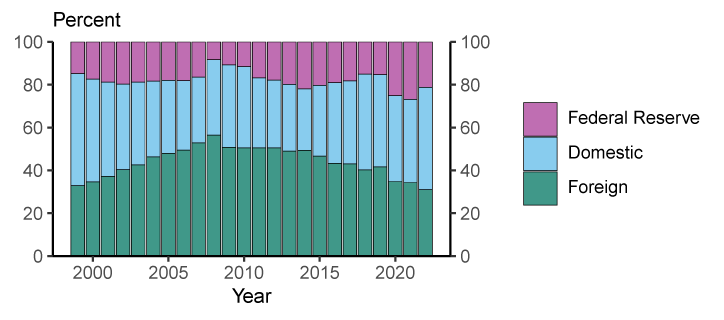
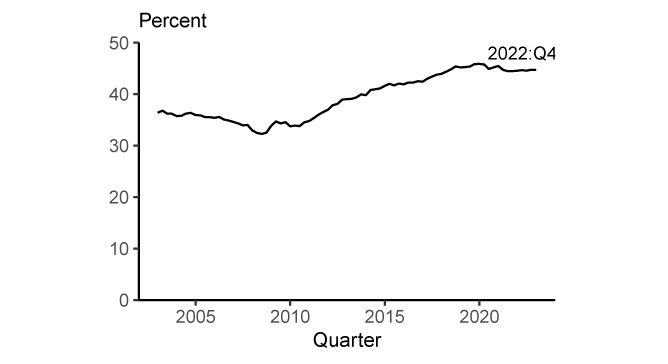
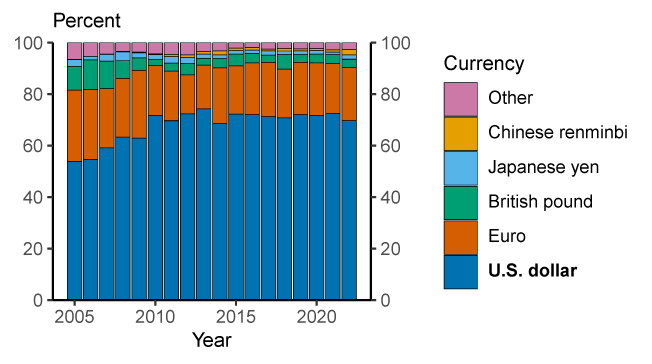
The bulk of these official dollar reserves are held in the form of U.S. Treasury securities, which are in high demand by both official and private foreign investors. As of the end of 2022, $7.4 trillion or 31 percent of marketable Treasury securities outstanding were held by foreign investors, both official and private (see Figure 3a), while 48 percent were held by private domestic investors, and 21 percent by the Federal Reserve System. Although the share of Treasuries held by foreign investors has declined from almost 50 percent in 2014, the current foreign share of Treasury holdings is broadly comparable to the foreign-held shares in the euro area, Japan, and the United Kingdom (shown in Figure 3b).
3a. Holdings of marketable U.S. Treasuries
3b. Share of general government debt securities held by foreign
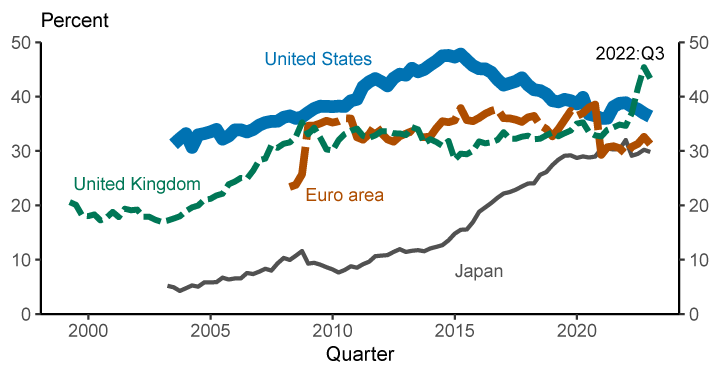
Note: Figure 3a legend entries appear in graph order from top to bottom. Figure 3b excludes domestic central bank holdings. Intra-euro area holdings of euro area debt securities are considered domestic holdings. General government debt securities includes local, state, and national debt securities. Figure 3a. data are annual and extend from 1999 through 2022. 2022 is 2022-Q3. Figure 3b. Data are quarterly and extend from 1999-Q1 through 2022-Q3.
Source: Financial Accounts of the United States, Table L.210. BIS debt securities statistics; World Bank/IMF Quarterly External Debt Statistics (QEDS), accessed through Haver Analytics; Bank of England; Bank of Japan; European Central Bank; Federal Reserve Board; Board staff calculations.
Foreign investors also hold substantial amounts of paper banknotes. As shown in Figure 4, the value of U.S. dollar banknotes held abroad has increased over the past two decades, both on an absolute basis and as a fraction of banknotes outstanding. Federal Reserve Board staff estimate that over $1 trillion in U.S. dollar banknotes were held by foreigners at the end of 2022, roughly half of total U.S. dollar banknotes outstanding.
4a. Share of U.S. dollar banknotes
4b. Amount of U.S. dollar banknotes
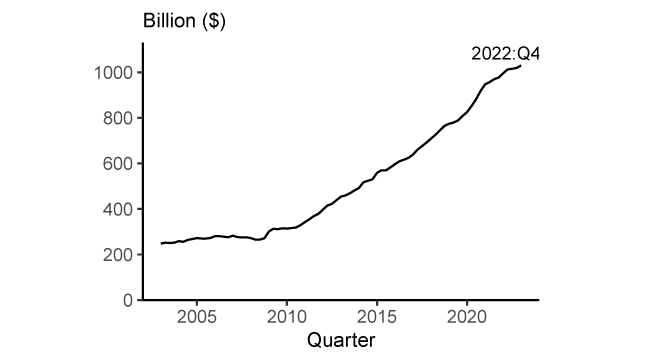
Note: The exact amount of U.S. dollar banknotes held by foreigners is not known and this is most likely a conservative estimate; see Judson (2017). Data are quarterly and extend from 2002-Q4 through 2022-Q4.
Source: Financial Accounts of the United States, Table L.204; Factors Affecting Reserve Balances (H.4.1), Table 1; Board staff calculations.
Additionally, many foreign countries leverage the effectiveness of the U.S. dollar as a store of value by limiting the movements of their currencies with respect to the U.S. dollar – in other words, using it as an anchor currency. As Ilzetzki, Reinhart, and Rogoff (2020) highlight, the dollar's usage as an anchor currency has increased over the past two decades. They estimate that 50 percent of world GDP in 2015 was produced in countries whose currency is anchored to the U.S. dollar (not counting the United States itself).4 In contrast, the share of world GDP anchored to the euro was only 5 percent (not counting the euro area itself). Moreover, since the end of the Ilzetzki et al. sample in 2015, this anchoring has changed little. One exception might be the re-anchoring of the Chinese renminbi from the U.S. dollar to a basket of currencies. However, the U.S. dollar and currencies anchored to the U.S. dollar comprise over 50 percent of this basket so the variation of the Chinese renminbi against the dollar has remained limited.
The U.S. dollar is dominant in international transactions and financial markets
The international role of a currency can also be measured by its usage as a medium of exchange. The dominance of the dollar internationally has been highlighted in several recent studies of the currency composition of global trade and international financial transactions. The U.S. dollar is overwhelmingly the world's most frequently used currency in global trade.5 An estimate of the U.S. dollar share of global trade invoices is shown in Figure 5. Over the period 1999-2019, the dollar accounted for 96 percent of trade invoicing in the Americas, 74 percent in the Asia-Pacific region, and 79 percent in the rest of the world. The only exception is Europe, where the euro is dominant with 66 percent.6
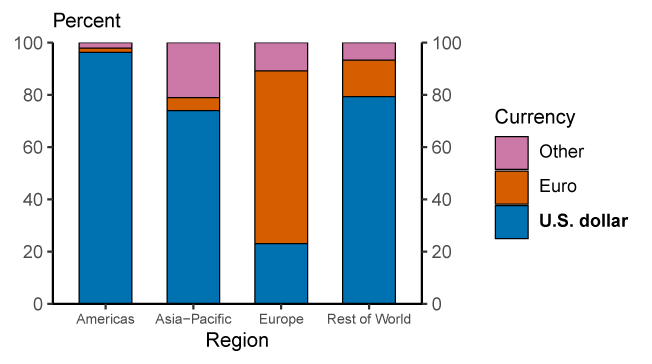
Note: Average annual currency composition of export invoicing, where data are available. Data extend from 1999 through 2019. Regions are those defined by the IMF. Legend entries appear in graph order from top to bottom. The value for Europe includes within-euro area trade.
Source: IMF Direction of Trade; Central Bank of the Republic of China; Boz et al. (2020); Board staff calculations.
In part because of its dominant role as a medium of exchange, the U.S. dollar is also the dominant currency in international banking. As shown in Figure 6, about 60 percent of international and foreign currency claims (primarily loans) and liabilities (primarily deposits) are denominated in U.S. dollars. This share has remained relatively stable since 2000 and is well above that for the euro (about 20 percent).
6a. Claims
6b. Liabilities
Note: Share of banking claims and liabilities across national borders or denominated in a foreign currency. Banking claims and liabilities are defined as loans and deposits only, including repurchase agreements. Excludes claims on and liabilities to related banking offices and central banks. Also excludes intra-euro area cross-border claims and liabilities. At current exchange rates. Data are annual and extend from 1999 through 2022. Legend entries appear in graph order from top to bottom.
Source: BIS locational banking statistics; Board staff calculations.
With dollar financing in particularly high demand during times of crisis, foreign financial institutions may face difficulties in obtaining dollar funding. In response, the Federal Reserve has introduced two programs to ease crisis-induced strains in international dollar funding markets, thus mitigating the effects of strains on the supply of credit to domestic and foreign firms and households. To ensure that dollar financing remained available during the 2008-2009 financial crisis, the Federal Reserve introduced temporary swap lines with several foreign central banks, a subset of which were made permanent in 2013.7 During the COVID-19 crisis in March 2020, the Federal Reserve increased the frequency of operations for the standing swap lines and introduced temporary swap lines with additional counterparties.8 The Federal Reserve also introduced a repo facility available to Foreign and International Monetary Authorities (FIMA) with accounts at the Federal Reserve Bank of New York, which was made permanent in 2021.9 The frequency of swap line operations was temporarily increased again in March and April 2023 to relieve market stresses associated with the intervention in the operations of Credit Suisse by Swiss authorities.10
Both the swap lines and the FIMA repo facility have enhanced the standing of the dollar as the dominant global currency, as approved users know that in a crisis they have access to a stable source of dollar funding. The swap lines were extensively used during the 2008-2009 financial crisis and the 2020 COVID-19 crisis, reaching outstanding totals of $585 billion and $450 billion, respectively (see Figure 7a). Although other central banks have also established swap lines, non-dollar-denominated swap lines offered by the European Central Bank and other central banks saw little usage (see Figure 7b). This fact highlights how crucial dollar funding is in the operations of many internationally active banks.
7a. Federal Reserve swap line provisions by counterparty central bank
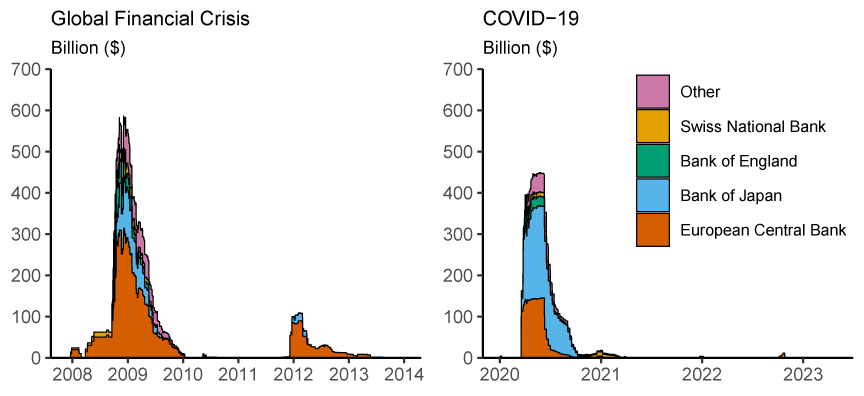
7b. Federal Reserve and European Central Bank swap line provisions
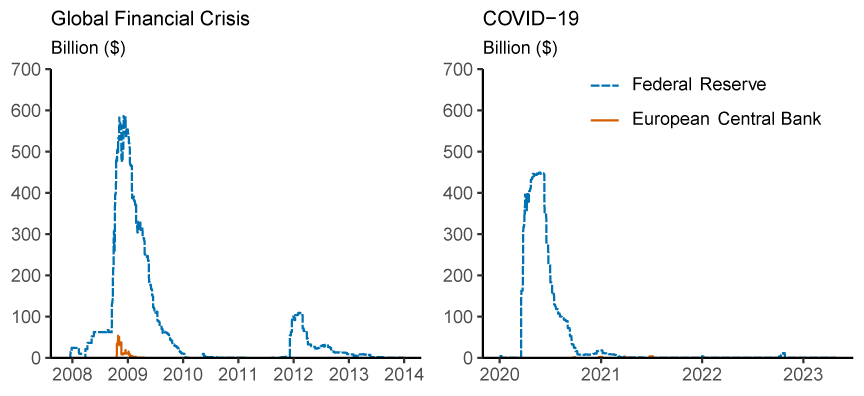
Note: In Figure 7a legend entries appear in graph order from top to bottom. Federal reserve swap line provisions to the Bank of England, Bank of Japan, and other central are at or near 0 prior to September 2008. Provisions to the Swiss National Bank are at or near 0 prior to March 2008. Provisions for the Swiss National Bank and Bank of England are at or near zero after June 2009. Figure 7b includes both swap line and repo provisions by the European Central Bank for the COVID-19 period. At current exchange rates. Data are daily and extend from December 1, 2007 through December 31, 2013 for the Global Financial Crisis, and January 1, 2020 through April 30, 2023 for the COVID-19 period. Swap line provisions for the European Central Bank are 0 (or near 0 when shown in billions) before October 2008 and after February 2009.
Source: Federal Reserve Bank of New York; European Central Bank.
Issuance of foreign currency debt—debt issued by firms in a currency other than that of their home country — is also dominated by the U.S. dollar. The percentage of foreign currency debt denominated in U.S. dollars has remained around 70 percent since 2010, as seen in Figure 8. This puts the dollar well ahead of the euro, whose share is 21 percent.
Note: Foreign currency debt is denominated in a foreign currency relative to the country of the issuing firm (not the location of issuance). At current exchange rates. Data are annual and extend from 2005 through 2022. Legend entries appear in graph order from top to bottom. Chinese renminbi is 0 in 2005.
Source: Refinitiv; Board staff calculations.
The many sources of demand for U.S. dollars are also reflected in the high U.S. dollar share of foreign exchange (FX) transactions. The 2022 Triennial Central Bank Survey from the Bank for International Settlements indicated that the U.S. dollar was bought or sold in about 88 percent of global FX transactions in April 2022. This share has remained stable over the past 20 years (Figure 9). In contrast, the euro was bought or sold in 31 percent of FX transactions, a decline from its peak of 39 percent in 2010.11
Note: On a net-net basis at current exchange rates. Percentages sum to 200 percent because every FX transaction includes two currencies. Legend entries appear in graph order from top to bottom. Chinese renminbi is 0 until 2007.
Source: BIS Triennial Central Bank Survey of FX and OTC Derivatives Markets.
Overall, U.S. dollar dominance has remained stable over the past 20 years
A review of the use of the dollar globally over the last two decades suggests a dominant and relatively stable role. To illustrate this stability, we construct an aggregate index of international currency usage. This index is computed as the weighted average of five measures of currency usage for which time series data are available: Official currency reserves, FX transaction volume, foreign currency debt instruments outstanding, cross-border deposits, and cross-border loans. We display this index of international currency usage in Figure 10. The dollar index level has remained stable at a value of about 70 since 2010, well ahead of all other currencies. The euro has the next-highest value at about 23, and its value has remained fairly stable as well. While international usage of the Chinese renminbi has increased over the past 20 years, it has only reached an index level of about 3, remaining even behind the Japanese yen and British pound, which are at about 7 and 6, respectively.
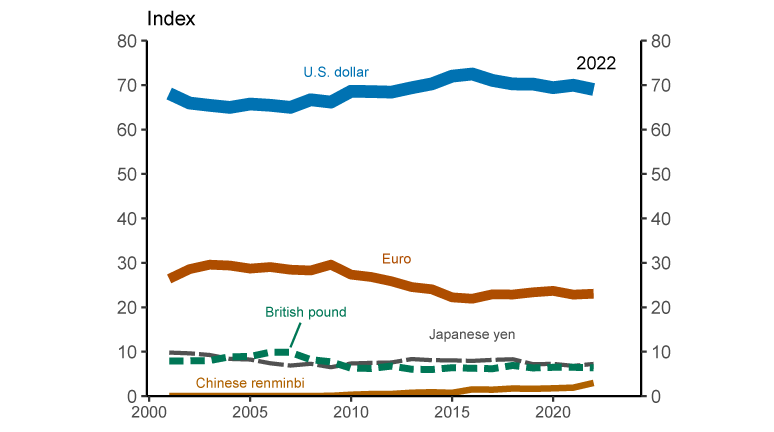
Note: Index is a weighted average of each currency's share of globally disclosed FX reserves (25 percent weight), FX transaction volume (25 percent), foreign currency debt issuance (25 percent), foreign currency and international banking claims (12.5 percent), and foreign currency and international banking liabilities (12.5 percent). Because our data on foreign currency debt issuance only becomes available in 2005, we fill back the 2005 value to previous years.
Source: IMF COFER; BIS Triennial Central Bank Survey of FX and OTC Derivatives Market; Refinitiv; BIS locational banking statistics; Board staff calculations.
Diminution of the U.S. dollar's status seems unlikely in the near term
Near-term challenges to the U.S. dollar's dominance appear limited. In modern history there has been only one instance of a predominant currency switching—the replacement of the British pound by the dollar. The dollar rose to prominence after the financial crisis associated with World War I, then solidified its international role after the Bretton Woods Agreement in 1944 (Tooze 2021, Eichengreen and Flandreau 2008, Carter 2020).12
However, over a longer horizon there is more risk of a challenge to the dollar's international status, and some recent developments have the potential to boost the international usage of other currencies.
Several commentators argued that sanctions imposed by the United States and its allies on Russia following the invasion of Ukraine may make the dollar less attractive as a reserve currency as geopolitical adversaries fear exposure to U.S. sanctions when relying on the U.S. dollar as a reserve currency. However, Weiss (2022) documents that about three-quarters of foreign government holdings of safe U.S. assets are already held by countries with some military tie to the United States. Furthermore, other prominent reserve currencies such as the euro, Japanese yen, and British pound, are all issued by close U.S. allies, who also participated in sanctions on Russia. Thus, geopolitical adversaries do not have many attractive alternatives to the U.S. dollar.13
Increased European integration is another possible source of challenge, as the European Union (EU) is a large economy with fairly deep financial markets, generally free trade, and robust and stable institutions. During the COVID-19 crisis, the EU started to issue an unprecedented amount of jointly backed debt, which reached about EUR 400 billion by May 2023. While this is a large amount for the EU, it is small compared to the over $20 trillion of U.S. treasuries outstanding. But if fiscal integration progresses and a large, liquid market for EU bonds develops, the euro could become more attractive as a reserve currency in the future. This integration could potentially be accelerated by enhancements to the EU's sovereign debt market infrastructure and introducing a digital euro. Additionally, the euro's prominent role in corporate and sovereign green finance could bolster its international status if these continue to grow. However, even with more fiscal integration, remaining political separation will continue to cause policy uncertainty.
Another source of challenges to the U.S. dollar's dominance could be the continued rapid growth of China, which is by far the world's largest exporter, though it lags the United States by value of imports (IMF Direction of Trade Statistics, 2021-Q2). Chinese GDP already exceeds U.S. GDP on a purchasing power parity basis (IMF World Economic Outlook, July 2021) and may exceed U.S. GDP in nominal terms in the 2030s.14 However, as China's population is declining, forecasters generally do not expect the Chinese economy to outgrow the U.S. economy by more than 30 percent.15 A size difference of this magnitude may not be enough to overcome the significant roadblocks to more widespread use of the Chinese renminbi. Importantly, the renminbi is not freely exchangeable, the Chinese capital account is not open, and investor confidence in Chinese institutions is relatively low (Wincuinas 2019). These factors all make the Chinese renminbi relatively unattractive for international investors. To overcome these shortcomings, China has recently increased efforts to promote renminbi invoicing. For example, it reached an agreement with Brazil to allow Chinese and Brazilian companies to settle trade in their domestic currencies rather than the U.S. dollar.16 It is also in discussion with Saudi Arabia to potentially price oil trade in renminbi. Outside analysts generally view these agreements as symbolic and at most laying the groundwork for potential future usage of the Chinese renminbi.17
A shifting payments landscape could also result in a challenge to the U.S. dollar's dominance. For example, the rapid growth of digital currencies, both private sector and official, could reduce reliance on the U.S. dollar. Changing consumer and investor preferences, combined with the possibility of new products, could shift the balance of perceived costs and benefits enough to overcome some of the inertia that helps to maintain the dollar's leading role. That said, it is also possible that technological progress may solidify the dominant role of the dollar. For example, about 99 percent of stable coin market capitalization is linked to the U.S. dollar, implying that crypto assets are de facto traded in U.S. dollars.18
In sum, absent any large-scale political or economic changes which damage the value of the U.S. dollar as a store of value or medium of exchange and simultaneously bolster the attractiveness of dollar alternatives, the dollar will likely remain the world's dominant international currency for the foreseeable future.
References
Bank for International Settlements. BIS Data Bank, https://dbsonline.bis.org/.
Boz, E., C. Casas, G. Georgiadis, G. Gopinath, H. Le Mezo, A. Mehl, and T. Nguyen (2020). "Patterns in Invoicing Currency in Global Trade." IMF Working Paper No. 20-126.
Carter, Z. (2020). The Price of Peace: Money, Democracy, and the Life of John Maynard Keynes. Random House.
Committee on the Global Financial System (CGFS), (2020). "U.S. dollar funding: an international perspective." BIS CGFS Papers No 65.
Dealogic, DCM Manager, http://www.dealogic.com/en/fixedincome.htm.
The Economist (2020). "Dollar dominance is as secure as American leadership." https://www.economist.com/finance-and-economics/2020/08/06/dollar-dominance-is-as-secure-as-american-global-leadership. Accessed August 18, 2021.
Eurostat, Extra-EU trade by invoicing currency, https://ec.europa.eu/eurostat/statistics-explained/index.php?title=Extra-EU_trade_by_invoicing_currency
Eichengreen, B. and M. Flandreau (2008). "The Rise and Fall of the Dollar, or When Did the Dollar Replace Sterling as the Leading International Currency?" NBER Working Papers No. 14154.
Judson, R. (2017). "The Death of Cash? Not So Fast: Demand for U.S. Currency at Home and Abroad, 1990-2016." International Cash Conference 2017.
Refinitiv, Thomson ONE Investment Banking with Deals module and SDC Platinum, http://www.thomsonone.com/.
Tooze, A. (2021). "The Rise and Fall and Rise (and Fall) of the U.S. Financial Empire." Foreign Policy https://foreignpolicy.com/2021/01/15/rise-fall-united-states-financial-empire-dollar-global-currency Accessed August 13, 2021.
Weiss, Colin (2022), "Geopolitics and the U.S. Dollar's Future as a Reserve Currency", International Financial Discussion Paper.
Wincuinas, J. (2019). "The China position: Gauging institutional investor confidence." Economist Intelligence Unit. https://eiuperspectives.economist.com/financial-services/china-position-gauging-institutional-investor-confidence Accessed August 18, 2021.
1. We thank John Caramichael and Kevin Bao for excellent research assistance. Return to text
2. For example, IMF First Deputy Managing Director Gita Gopinath warned that sanctions on Russia could dilute dollar dominance (https://www.reuters.com/business/imf-warns-russia-sanctions-threaten-chip-away-dollar-dominance-ft-2022-03-31/) Return to text
3. For a detailed discussion of the dollar's use in international financial markets see Committee on the Global Financial System (2020). Return to text
4. Their definition of anchored currencies includes currencies explicitly pegged to the dollar as well as currencies that move less than 2 percent against the dollar in over 80 percent of months. Return to text
5. The U.S. dollar is also the most commonly used currency for cross-border payments via SWIFT, accounting for over 40% of payments (see Chart 2 in The International Role of the Euro June 2022 published by the European Central Bank https://www.ecb.europa.eu/pub/pdf/ire/ecb.ire202206~6f3ddeab26.en.pdf ). This figure would be even higher if inter-euro area payments were excluded. Return to text
6. This percentage includes trade within the euro area. Only 48 percent of extra-EU exports were invoiced in euro in 2020 (Eurostat). Return to text
7. Since 2013, the following six central banks have had permanent bilateral swap arrangements with each other: the Bank of Canada, the Bank of England, the Bank of Japan, the European Central Bank, the Federal Reserve, and the Swiss National Bank. Return to text
8. Additional information about the Federal Reserve's central bank swap lines can be found at https://www.federalreserve.gov/monetarypolicy/central-bank-liquidity-swaps.htm. Return to text
9. The FIMA repo facility allows approved foreign central banks and other foreign monetary authorities to temporarily raise dollars by selling U.S. Treasuries to the Federal Reserve's System Open Market Account and agreeing to buy them back at the maturity of the repurchase agreement. Thus, it provides an alternative temporary source of U.S. dollars for FIMA account holders of Treasury securities other than sales of the securities in the open market. Additional information about the facility can be found at https://www.federalreserve.gov/monetarypolicy/fima-repo-facility.htm. Return to text
10. To improve the swap lines' effectiveness in providing U.S. dollar funding, the frequency of swap line operations was increased from weekly to daily between March 20 and April 30, 2023. https://www.federalreserve.gov/newsevents/pressreleases/monetary20230319a.htm Return to text
11. Because one currency is purchased and another currency is sold in FX transactions, each trade is counted twice, so the sum of the FX transactions measure is 200 percent. Return to text
12. U.S. GDP may have eclipsed British GDP as early as the late 1800s, but the dollar did not completely solidify its dominance until after the Bretton Woods Agreement in 1944 (Eichengreen and Flandreau (2008)). Return to text
13. This is especially true for China, which holds a lot of U.S. dollar reserves and cannot use the Chinese renminbi as a reserve currency. Return to text
14. Bloomberg's base case forecast predicts that Chinese GDP will exceed U.S. GDP in nominal terms in 2033 (https://www.bloomberg.com/news/features/2021-07-05/when-will-china-s-economy-beat-the-u-s-to-become-no-1-why-it-may-never-happen?srnd=premium&sref=c1gYoH2n). Return to text
15. https://www.economist.com/briefing/2023/05/11/how-soon-and-at-what-height-will-chinas-economy-peak Return to text
16. https://www.bloomberg.com/news/articles/2023-03-30/brazil-takes-steps-to-transact-in-yuan-as-ties-with-china-grow Return to text
17. https://www.bloomberg.com/opinion/articles/2023-02-27/pricing-petroleum-in-china-s-yuan-sounds-inevitable-not-for-saudi-arabia Return to text
18. See Box 5 Euro-based stablecoins in The International Role of the Euro June 2022 published by the European Central Bank (https://www.ecb.europa.eu/pub/pdf/ire/ecb.ire202206~6f3ddeab26.en.pdf ). Return to text
Bertaut, Carol, Bastian von Beschwitz, Stephanie Curcuru (2023). "The International Role of the U.S. Dollar" Post-COVID Edition," FEDS Notes. Washington: Board of Governors of the Federal Reserve System, June 23, 2023, https://doi.org/10.17016/2380-7172.3334.
Disclaimer: FEDS Notes are articles in which Board staff offer their own views and present analysis on a range of topics in economics and finance. These articles are shorter and less technically oriented than FEDS Working Papers and IFDP papers.