FEDS Notes
March 05, 2026
The Slow Climb: How Tariffs Gradually Raised Retail Prices in 2025
Sinem Hacıoğlu-Hoke, Sarojini Malladi, and Leo Feler1
The speed and extent to which tariffs built pressure on consumer prices in 2025 remains an ongoing and important debate. This note examines tariff-related retail price changes using a detailed item-level retail spending dataset combined with information on the countries where products are produced. We find that (1) price pressures developed gradually in 2025 rather than showing up as a one-time price spike, (2) tariff effects have been greatest for goods imported from China with 8.5% year-over-year price increase by December 2025, (3) tariff pass-through to consumers between April 2025 and December 2025 has been at least 30% for goods imported from China.
Our approach to looking at prices based on country of origin is in the spirit of the recent analysis by Cavallo et al. (2025), though our methodology offers a key advantage.2 Specifically, based on data from a representative panel of up to 200,000 US households, we use prices observed from retail transactions weighted by quantities purchased to construct a headline price index. This quantity-weighted approach allows us to establish the reliability of our aggregate index by comparing it with the US Bureau of Economic Analysis' Personal Consumption Expenditure (PCE) Price Index. Our headline index closely matches the official PCE deflator for food and correlates strongly with other inflation measures, providing validation for our methodological approach. We then disaggregate our price index to measure inflation for a set of products based on their country of origin.
The data for prices, quantities, and country of origin
There are various ways to calculate price indices, and doing so requires information on product prices and ideally on purchased quantities. To get retail prices and quantities purchased, we use item-level retail purchase data from up to 200,000 representative US households for the period of January 2018 to December 2025 provided by Numerator, a consumer research company.3 The data include information on households' purchases collected via a mobile app.4
Table 1 provides an overview of expenditure and product shares across various sectors tracked in the data. Groceries dominate, accounting for 44% of expenditures and 45% of products purchased. Health & Beauty ranks second at around 9% for both expenditure and product share. Some sectors show higher expenditure shares relative to their product shares, such as Home & Garden and Electronics, reflecting higher-value items like furniture and appliances. Conversely, Apparel represents around 5% of products but around 3% of expenditures. Between January to December 2025, the average panelist shared transaction data totaling $17,000 in spend and the average self-reported annual household income was approximately $100,000, suggesting the spend captured in the data represents approximately 17% of household income. This figure is comparable to data from the US Bureau of Labor Statistics' Consumer Expenditure Survey.5, 6
Table 1: Expenditure and Product Shares by Sector between January 2025 and December 2025
| Sector | Expenditure Share | Product Share |
|---|---|---|
| Grocery | 44.1 | 45.2 |
| Health & Beauty | 8.7 | 9.4 |
| Home & Garden | 8.3 | 7.4 |
| LSR (Limited Service Restaurant) | 5.0 | 4.2 |
| Household | 4.7 | 3.3 |
| Pet | 3.9 | 3.1 |
| Tools & Home Improvement | 3.7 | 3.4 |
| Electronics | 3.3 | 2.0 |
| Apparel, Footwear, and Accessories | 3.0 | 4.8 |
| FSR (Full Service Restaurants) | 3.0 | 2.2 |
| Apparel | 2.8 | 4.6 |
| Party & Occasions | 2.3 | 1.9 |
| Toys | 1.9 | 2.9 |
| Automotive | 1.3 | 1.1 |
| Baby | 1.1 | 0.9 |
| Sports | 0.9 | 1.0 |
| Tobacco Products and Accessories | 0.8 | 0.6 |
| Office | 0.7 | 1.2 |
| Books | 0.4 | 0.7 |
| Entertainment | 0.1 | 0.2 |
Note: Values in percent. For the sectors in the table, average household expenditure during the period between January 2025 to December 2025 is $17,019 and the total number of products captured in the data is nearly 30 million for the sectors shown in the table. Sectors are those provided by Numerator as the most aggregated classification.
Source: Numerator Panel Data, authors' calculations.
Although the data provide detailed insight into US consumers' daily shopping behavior, it covers only about 20% of the consumption basket captured in the PCE and CPI. Major spending categories like housing, travel, motor vehicles, entertainment, and healthcare - which constitute significant portions of household spending - are not tracked. Recent analyses show that weights consumers assign to price changes depend on the frequency of purchase rather than expenditure share, and households rely heavily on grocery bundle prices when forming aggregate inflation expectations (see D'Acunto et al. (2021), Weber et al. (2022)). Given this, as this note demonstrates, the Numerator data provide a reliable signal for retail price changes experienced by US consumers.
Numerator data contain product descriptions but do not contain information on product origins. To identify source countries, we use Label Insight, a dataset of consumer packaged goods sold in the US that includes detailed product information such as country of origin linked to Universal Product Codes (UPCs). By combining Numerator and Label Insight through matching UPCs, we create a dataset of approximately 27,000 products, primarily covering health and beauty products and groceries, with some limited coverage of furniture, electronics, and various household items.7 In Figure 1, we show the share of various sectors by country of origin captured in matched Numerator and Label Insight data for sectors with 1% share in at least one country. Throughout our analysis, we focus on products made in the US, in the US's main trading partners Canada, Mexico, and China, and we bundle all other source countries under 'Others'.8
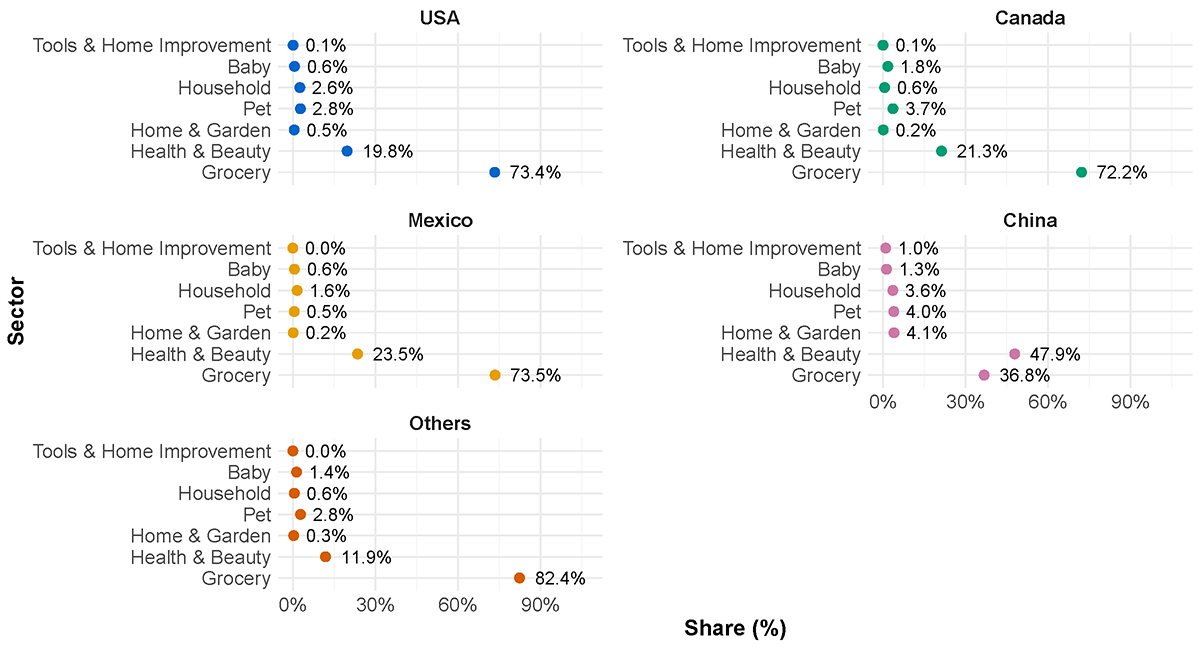
Note: Share of sectors by country of origin for sectors with >1% share in at least one country. Total number of products in the dataset: 26,913. Number of products by country: US 17,086; Canada 1,879; Mexico 1,843; China 1,428; Others 4,677. Countries captured in Others are: Argentina, Austria, Bangladesh, Brazil, Cambodia, Chile, Colombia, Costa Rica, Dominican Republic, El Salvador, EU, France, Germany, Haiti, Honduras, Hong Kong, India, Indonesia, Italy, South Korea, Netherlands, New Zealand, Norway, Pakistan, Peru, Philippines, Poland, Slovakia, Spain, Sri Lanka, Switzerland, Taiwan, Thailand, Turkey, United States.
Source: Author's calculations.
The Fisher Price Index
With information on both quantities and prices of products purchased by a representative household panel, we construct a monthly Fisher Price Index (FPI) starting in January 2018, the first available month in the dataset. The FPI, although computationally more complex than other counterparts, has the advantage of accounting for both base and current period quantity weights.9 For a given period $$t$$ compared to the base period $$0$$, the FPI, $$F_t$$, is defined as:
$$$$ F_t = \sqrt{L_t \cdot P_t} = \sqrt{\frac{\sum_{k \in \Omega} p_{kt} q_{k0}}{\sum_{k \in \Omega} p_{k0} q_{k0}} \cdot \frac{\sum_{k \in \Omega} p_{kt} q_{kt}}{\sum_{k \in \Omega} p_{k0} q_{kt}}} $$$$
where $$L_t$$ is the Laspeyres index, $$P_t$$ is the Paasche index, $$p_{kt}$$ and $$q_{kt}$$ are the price and quantity of product $$k$$ in period $$t$$, and $$\Omega$$ is the set of all products. The Laspeyres index $$L_t = \frac{\sum_{k \in \Omega} p_{kt} q_{k0}}{\sum_{k \in \Omega} p_{k0} q_{k0}}$$ uses base period quantities as weights, while the Paasche index $$P_t = \frac{\sum_{k \in \Omega} p_{kt} q_{kt}}{\sum_{k \in \Omega} p_{k0} q_{kt}}$$ uses comparison period quantities. The FPI is the geometric mean of the Laspeyres and Paasche indices. The results can be interpreted as a percentage relative to the base period. The Fisher Price Index we calculate using the transaction level data is comparable to the construction of the PCE inflation index, the Federal Reserve's preferred measure of inflation, which is also a Fisher Price Index using expenditure weights. We calculate country-specific Fisher price indices using the formula in Equation 1 but focusing on the prices and quantities of products imported from specific countries.
Figure 2 demonstrates the similarity between the Numerator FPI and the PCE deflator for food from 2018 to 2025. Panel A shows both indices remain relatively stable from 2018 until early 2020, followed by a sharp increase starting in 2021, reflecting inflationary pressures from both demand and supply factors (see Shapiro (2024) and Braun et al. (2024)). The FPI tracks the PCE price index closely throughout with minor divergences. By mid-2025, both indices reach similar levels and begin accelerating in the final months, with the FPI reaching over 130, indicating a cumulative price increase of around 30% since January 2018.
Figure 2. Numerator Fisher Price Index constructed using product quantities and prices versus the PCE for food
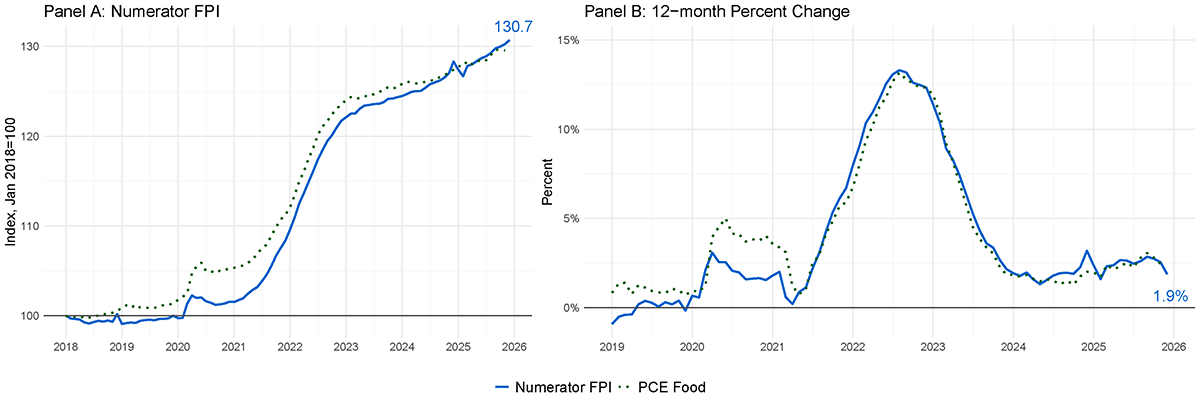
Note: Left panel: Numerator price index for January 2018 through December 2025; BEA PCE price index for food for January 2018 through November 2025. Fisher Price Index constructed using Numerator data in solid blue line, BEA's PCE for food in dotted green line; January 2018=100. The PCE data is seasonally adjusted by the BEA and the Fisher Price Index is seasonally adjusted using X13-ARIMA-SEATS. Right panel: Data for January 2019 through November 2025; the year-over-year percent change in the Fisher Price Index is constructed using Numerator data and shown as the solid blue line, the year-over-year percent change for the PCE Price Index for food is shown as the dotted green line.
Source: Numerator FPI calculated using Numerator Panel Data and based on authors' calculations. PCE Deflator for Food is from the Federal Reserve Bank of St. Louis FRED, series DFXARG3M086SBEA.
Panel B, showing year-over-year percent changes, further emphasizes the close alignment between the two measures. Both indices capture the significant price acceleration in 2021 and 2022, peaking at around 13% year-over-year, before moderating in subsequent years. The Numerator FPI is consistent with the BEA's PCE index for food in showing higher year-over-year inflation in 2025, compared to the inflation experience in 2024. Reassuringly, the correlation coefficients reported in Table 2 indicate that although PCE food inflation is the most correlated with the Numerator FPI, other measures of inflation show high correlation as well.10
Table 2: Correlation between inflation measures and Numerator FPI
| PCE Food & Bev | PCE Goods ex MV | Core PCE | CPI | CPI Food |
|---|---|---|---|---|
| 0.96 | 0.81 | 0.85 | 0.85 | 0.85 |
Note: Correlation of 12-month percent change of Numerator FPI and the 12-month percent changes of reported inflation measures. Underlying monthly data capture January 2019 to November 2025.
Source: Numerator Panel Data and Federal Reserve Bank of St. Louis FRED, authors' calculations. PCE Deflator for Food is from the Federal Reserve Bank of St. Louis FRED: DFXARG3M086SBEA. Core PCE is from FRED: PCEPILFE. CPI is from FRED: CUSR0000SAC. CPI Food is from FRED: CPIUFDSL. The PCE goods deflator that excludes motor vehicles is based on author's calculations.
Tariff effects on consumer prices in 2025
There is preliminary evidence of the price effects of tariffs on imported as well as domestically produced goods, see Baslandze et al. (2025); Cavallo et al. (2025); Dvorkin et al. (2025); Minton and Somale (2025). We contribute to this effort by tracking potential tariff-induced price increases in 2025 in Figure 3.
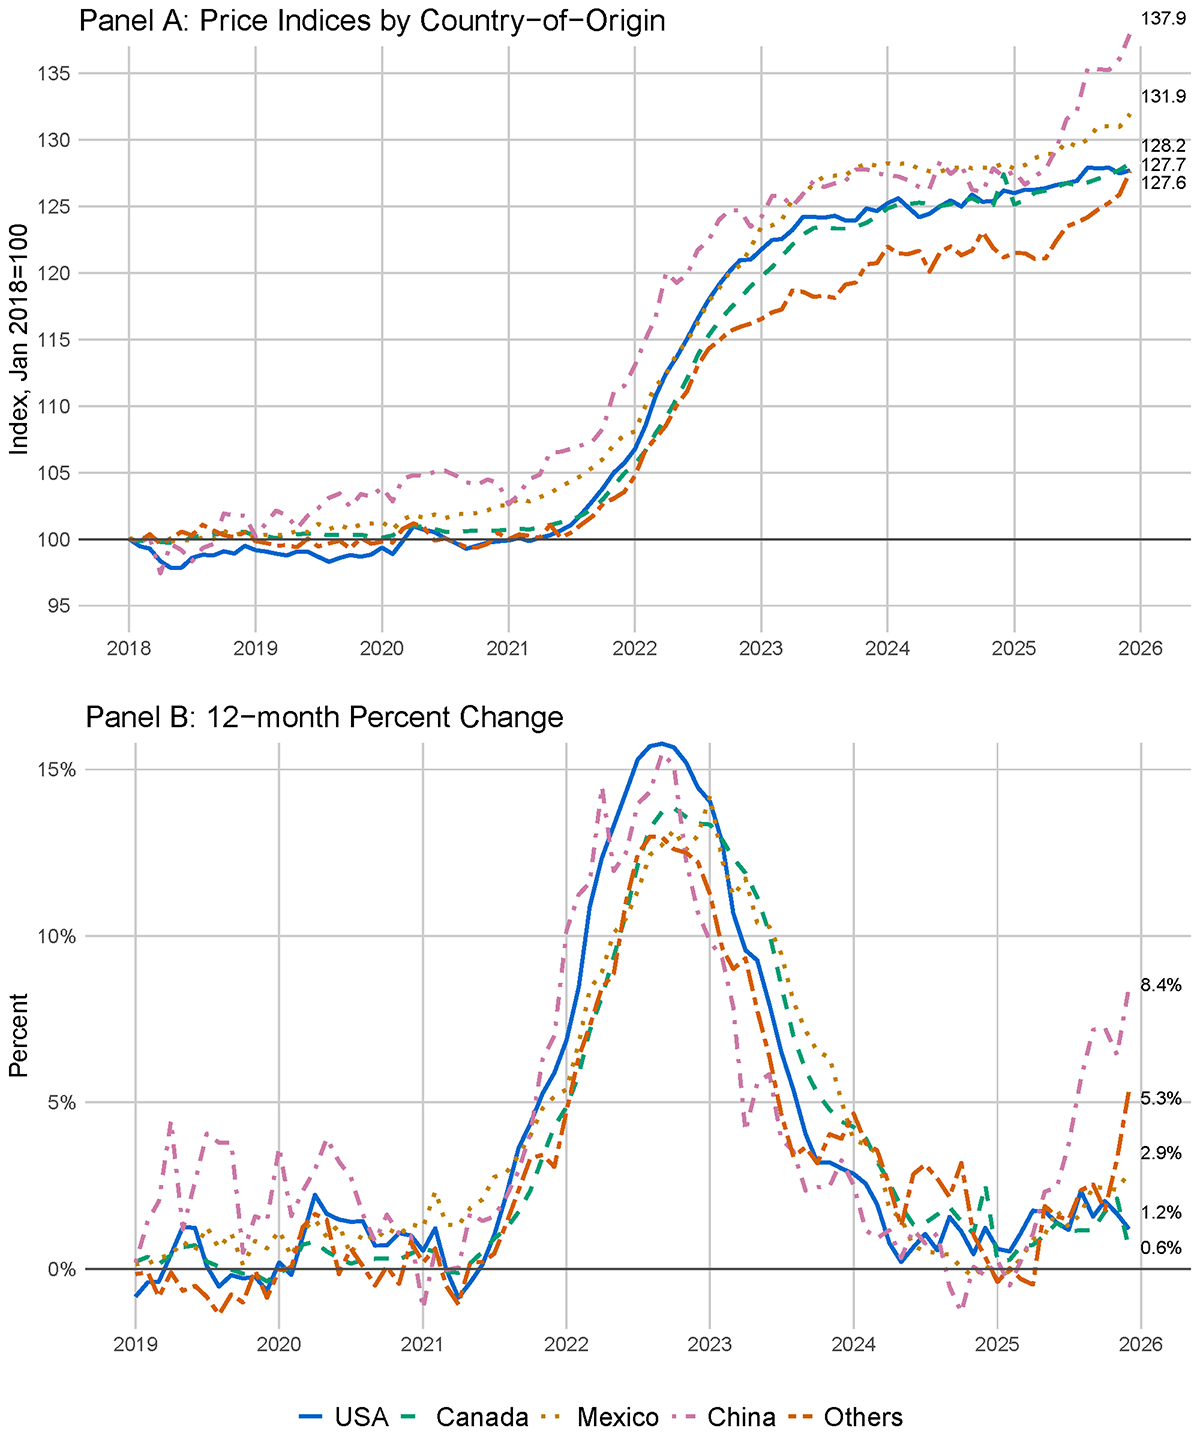
Note: Top panel: Data for January 2018 through December 2025; Fisher Price Indices constructed using matched Numerator Panel Data and Label Insight Data for different source countries. Bottom panel: 12-month percent changes. US in blue solid, Canada in green dashed, Mexico in yellow dotted, China in pink dot-dashed, Others in orange two-dashed lines. Seasonally adjusted using X13-ARIMA SEATS.
Source: Matched Numerator Panel Data and Label Insight Data, authors' calculations.
Panel A of Figure 3 shows that indices for all countries except China remain relatively stable until 2021, when they all start increasing significantly. The US imposed several rounds of tariffs on imports from China beginning in 2018, and we see the series for China diverge earlier.11 Previous research (Amiti et al., 2019; Flaaen et al., 2020; Cavallo et al., 2021) and our evidence confirm these tariffs increased Chinese goods prices. By 2025, products from all origins experienced 28-38% cumulative inflation.
Panel B displays year-over-year price changes. Four key observations emerge. First, Chinese goods show high yearly inflation in 2019, following the tariffs imposed beginning in 2018. Second, all prices increase markedly during the post-pandemic inflation period regardless of origin. Third, goods produced in the US experience higher price increases than imported goods during 2022-2023. Fourth, consumer price inflation for Chinese imported goods has diverged by more in early-2025, coinciding with the tariffs announced in 2025, followed by the prices of goods from 'Other' countries starting to increase towards the end of the year.
Now let's focus more closely on 2025. Figure 4 shows the 12-month percent changes of the source-country price indices for January through December 2025. Until April, the year-over-year inflation on the retail prices for imported goods is approximately zero. Starting in April, retail prices for Chinese imported goods gradually increase and are almost 8.5% higher in December than a year ago. On the other hand, price increases for US products are on average below 2% and price changes for Canadian products are muted in 2025. Prices of goods imported in the 'Others' category rise gradually following the April tariff announcement and reach over 5% year-over-year by December.
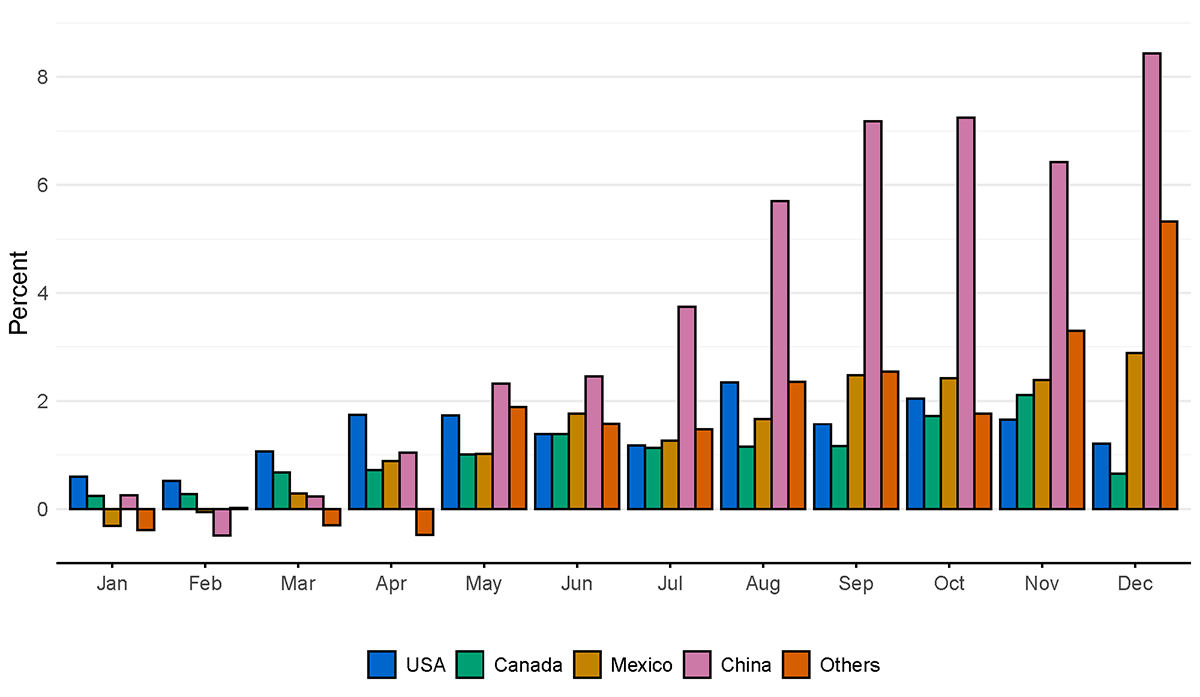
Note: 12-month percent changes in the country-specific Numerator Fisher Price Indices for January through December 2025. The key identifies bars in order from left to right.
Source: Matched Numerator Panel Data and Label Insight Data, authors' calculations.
The higher December prices for Chinese imported goods of over 8% year-over-year would imply a conservative estimate of the tariff pass-through of at least 28-32%. We calculate this conservative pass-through rate by considering that the statutory effective tariff rate (ETR) increase due to 2025 tariffs on China is around 30% and the realized ETR is around 26% as estimated by Cavallo et al. (2025).12 This observation is within the range of the pass-through findings in the recent work by Dvorkin et al. (2025) that find partial tariff pass-through of around 35% to PCE prices and by Cavallo et al. (2025) that estimates a 20% pass-through.13
Figure 5 provides additional evidence on the stronger pass-through of tariffs on the prices of goods imported from China. Panel A shows the event study results that gauge the changes in Chinese imported goods prices after the tariff announcements in April 2025. Retail prices do not significantly react immediately after tariff announcements, roughly until August.14 Goods prices for imports from Canada, Mexico, and all other countries in Panel B start increasing from June onward, albeit to a much smaller extent than the price increases observed for Chinese goods. As of December 2025, the price increases of goods imported from China appear to be around double the price increases of goods imported from all other countries.
Figure 5. Event study results for price changes of goods imported from China and Canada, Mexico and Others
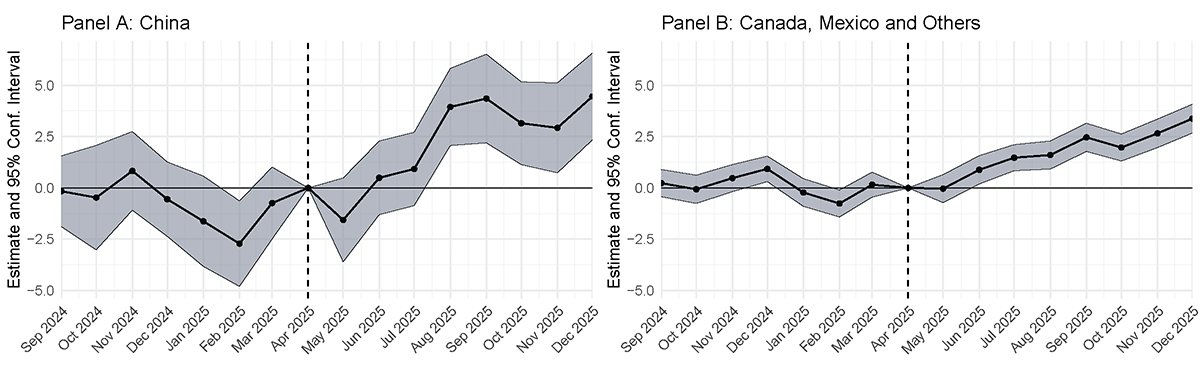
Note: Event study results for price of goods imported from China on the left (Panel A) and Canada, Mexico and Others on the right (Panel B). The line with circles represents the coefficients (in percentage points) from an event study regression of product prices in logarithms on a vector of lead and lagged indicators, which are 1 starting from April, zero otherwise, with April 2025 normalized to 0 indicated by the dashed vertical line. Standard errors are clustered at the product level. Each regression includes product, origin, and sector fixed effects.
Source: Matched Numerator Panel Data and Label Insight Data, authors' calculations.
Conclusion
This note analyzes how consumer prices in the US responded to tariff announcements in 2025. While our product coverage is limited and cannot account for the complete basket of household purchases, the evidence we find is compelling. Prices of everyday household items began increasing a few months after tariffs were implemented. As of December 2025, tariffs do not appear as a one-time price spike, but rather as a pattern of gradual and slow adjustments to retail prices that US consumers see on store shelves.
Why hasn't the impact been larger? Retailers are navigating a tricky environment. Consumers are more price-sensitive and financially stretched than during the pandemic recovery period. Although price increases seem to be reflected in import costs (Hinz et al., 2026), many retailers have so far absorbed costs consistent with the pattern observed during the 2018-2019 tariffs (Cavallo et al., 2021). There has also been significant uncertainty about tariff persistence throughout 2025, which likely delayed pricing decisions that cannot be easily reversed. Moreover, many producers and retailers first worked through excess inventories accumulated before tariffs took effect. Realized tariffs have also been lower than announced rates due to exemptions (Gopinath and Neiman, 2026). With the evidence at hand so far, considerable uncertainty remains about the potential for additional price adjustments and the ultimate degree of tariff pass-through. Our analysis nevertheless indicates that consumers are in fact paying higher retail prices because of tariffs.
References
Amiti, M., S. J. Redding, and D. E. Weinstein (2019). The impact of the 2018 tariffs on prices and welfare. Journal of Economic Perspectives 33(4), 187–210.
Baslandze, S., Fuchs, S., Pringle, K. C., & Sparks, M. D. (2025). Tariffs and consumer prices: Insights from newly matched consumption-trade micro data (Policy Hub No. 2025-1). Federal Reserve Bank of Atlanta.
Braun, R., A. Flaaen, and S. Hacioglu Hoke (2024). Supply vs demand factors influencing prices of manufactured goods. FEDS Notes. Washington: Board of Governors of the Federal Reserve System.
Cavallo, A., G. Gopinath, B. Neiman, and J. Tang (2021). Tariff Pass-Through at the Border and at the Store: Evidence from US Trade Policy. American Economic Review: Insights 3(1), 19–34.
Cavallo, A., P. Llamas, and F. Vazquez (2025). Tracking the Short-Run Price Impact of US Tariffs. Unpublished manuscript.
D'Acunto, F., U. Malmendier, J. Ospina, and M. Weber (2021). Exposure to grocery prices and inflation expectations. Journal of Political Economy 129(5), 1615–1639.
Dvorkin, M. A., F. Leibovici, and A. M. Santacreu (2025). How tariffs are affecting prices in 2025.
Flaaen, A., A. Hortaçsu, and F. Tintelnot (2020). The Production Relocation and Price Effects of US Trade Policy: The Case of Washing Machines. American Economic Review 110(7), 2103–27.
Gopinath, G. and B. Neiman (2026). The incidence of tariffs: Rates and reality. Working Paper 34620, National Bureau of Economic Research.
Sinem Hacıoğlu-Hoke, L. Feter, and J. Chylak (2024). A Better Way of Understanding the US Consumer: Decomposing Retail Sales by Household Income. FEDS Notes. Washington: Board of Governors of the Federal Reserve System.
Hinz, J., A. Lohmann, H. Mahlkow, and A. Yonzan (2026). America's own goal: Who pays the tariffs? Kiel Policy Brief 201, Kiel Institute for the World Economy.
Minton, R. and M. Somale (2025). Detecting tariff effects on consumer prices in real time. FEDS Notes. Washington: Board of Governors of the Federal Reserve System.
Shapiro, A. H. (2024). Decomposing supply- and demand-driven inflation. Journal of Money, Credit and Banking.
Weber, M., F. D'Acunto, Y. Gorodnichenko, and O. Coibion (2022). The subjective inflation expectations of households and firms: Measurement, determinants, and implications. Journal of Economic Perspectives 36(3), 157–184.
1. The analysis and conclusions set forth herein are those of the authors and do not indicate concurrence by other members of the research staff or the Board of Governors of the Federal Reserve System. The use of commercially provided data here is for research purposes only and does not imply endorsement, recommendation, or favoring of any brand, product, service, or company by the Board of Governors or the Federal Reserve System. The views expressed in this paper are the responsibility of the authors and should not be interpreted as reflecting the views of Numerator. All errors remain our own. Return to text
2. Cavallo et al. (2025) construct daily price indices computed as unweighted geometric means of prices. They use online retail prices, collected by PriceStats from five major U.S. retailers, disaggregated by country of origin and tariff exposure, to track the short-run pass-through of the 2025 U.S. tariffs to consumer prices. Return to text
3. The Numerator static panel currently covers 200,000 households, up from 105,000 households in 2018. These households are selected, among over one million households, to be a part of the 'static' panel such that their full transaction records for purchases are tracked for a period of at least 12 months and the households included in the panel are demographically and geographically representative of the US population. Households also self-report various attributes such as income, education, housing information, and employment status. Return to text
4. Numerator panelists receive compensation for uploading pictures of their paper receipts, linking loyalty accounts, and allowing Numerator to scrape their emails for online receipts. Transaction details include the quantity and price of each item purchased, the receipt total, as well as the location and time of the purchase. Return to text
5. See Bureau of Labor Statistics, Consumer Expenditures - 2023, Table A: Average income and expenditures of all consumer units, 2021-23, released September 25, 2024, available at: https://www.bls.gov/news.release/archives/cesan_09252024.pdf. Return to text
6. In prior work (Sinem Hacıoğlu-Hoke et al. (2024)), we also construct an aggregate retail spending measure from the same panel and establish the reliability of Numerator's spending data. Return to text
7. We lose a considerable amount of data when we limit to only matched data between Numerator and Label Insight. In part, the Label Insight data to which we have access is from 2017 and the Numerator data is from 2018 through 2025. We will only be able to match items if their UPCs remain unchanged over time, which is less common for categories like apparel and toys, as new styles and offerings with new UPCs become available more frequently. Moreover, the vintage of Label Insight data we use is not as comprehensive as the Numerator data, which limits our ability to match the Numerator data to source countries. Nevertheless, the data we are able to match is still a large enough sample of products to allow for the estimation of tariff effects by country of origin. Return to text
8. Countries captured in Others are: Argentina, Austria, Bangladesh, Brazil, Cambodia, Chile, Colombia, Costa Rica, Dominican Republic, El Salvador, EU, France, Germany, Haiti, Honduras, Hong Kong, India, Indonesia, Italy, South Korea, Netherlands, New Zealand, Norway, Pakistan, Peru, Philippines, Poland, Slovakia, Spain, Sri Lanka, Switzerland, Taiwan, Thailand, Turkey, United Kingdom, Uruguay, and Vietnam. Return to text
9. Price indices using Laspeyres or Cavallo et al. (2025) style indices rely only on product prices, without purchase quantities as weights, which makes them easier to construct but have the drawback of not capturing changes in consumer behavior as consumers adjust their consumption baskets over time. Return to text
10. These correlations remain robust to excluding the recent high inflation period. Return to text
11. These tariffs targeted China's alleged unfair trade practices, leading to retaliatory tariffs and a trade war that affected global supply chains and economic relations. Return to text
12. Average tariffs on imports from China have been volatile since March 2025 and there is a wide range of estimates, e.g., see https://www.piie.com/research/piie-charts/2019/us-china-trade-war-tariffs-date-chart. We use the statutory effective tariff rate (ETR) calculated by Cavallo et al. (2025). Based on the latest data, pulled in early January 2026, China's statutory ETR is 30% and the applied ETR is 26%. Return to text
13. We have to be cautious when interpreting tariff pass-through to consumers. Suppose, for example, that a product is imported for $10. There are then several domestic costs such as transportation, marketing, and retail markups of an additional $10, and the product is sold to consumers for $20. Now suppose a tariff of 100% is imposed on that product. The product is now imported for $20, after tariffs. There is still another $10 of domestic costs such as transportation, marketing, and retail markups of an additional $10, and the product is now sold for $30. Technically, even though the tariffs are fully passed on to consumers, consumer prices do not increase by %100, from $20 to $40, rather they increase by 50%, from $20 to $30. Our estimate of approximately 30% tariff pass-through, taking the 8.5% year-over-year price changes for Chinese imports relative to the 26-30% increase in effective tariff rates on Chinese imports is a conservative estimate. Return to text
14. The wide confidence bands in Panel A reflect the smaller sample size relative to the data used for Panel B. While the Panel A coefficients are statistically insignificant until August, the preceding analysis suggests that economically meaningful effects of tariffs on Chinese goods prices emerged earlier. Return to text
Sinem Hacıoğlu-Hoke, Sarojini Malladi, and Leo Feler (2026). "The Slow Climb: How Tariffs Gradually Raised Retail Prices in 2025," FEDS Notes. Washington: Board of Governors of the Federal Reserve System, March 05, 2026, https://doi.org/10.17016/2380-7172.4010.
Disclaimer: FEDS Notes are articles in which Board staff offer their own views and present analysis on a range of topics in economics and finance. These articles are shorter and less technically oriented than FEDS Working Papers and IFDP papers.