FEDS Notes
January 31, 2025
Trends in Credit Unions' Share of U.S. Private Depository Household Lending1
Robert Kurtzman and Hannah Landel
Private depository institutions play a crucial role in the provisioning of credit in the United States. The two private depository sectors in the Financial Accounts of the United States (the Financial Accounts) serving as the primary lenders to households are U.S.-chartered depository institutions (banks) and credit unions. Credit unions mostly make loans to households, while banks make large shares of their loans to both households and businesses.2
Attention is naturally often focused on banks, as they are the largest of the private depository sectors in terms of their total lending. While credit unions are significantly smaller in this regard, they have been playing an increasingly important role in the provisioning of mortgage loans and consumer credit to households. This note documents trends in the financial assets and provisioning of loans by banks and credit unions over the past three decades, highlighting credit unions' trends in their provisioning of credit to households in the United States.
Section 1: Trends in Financial Asset Holdings
Before examining trends in lending, it is useful to first examine trends in the financial assets of the institutions more generally.
Figure 1 shows financial assets relative to nominal gross domestic product (GDP) of U.S.-chartered depository institutions (on the left axis)—labeled as "U.S. banks" moving forward—compared with financial assets to GDP of credit unions (on the right axis) from 1976:Q1 to 2024:Q3.3 There is a stark difference in the sizes of the two sectors, reflected in the scales between the two axes. The figure also shows that U.S. bank financial assets to GDP have increased, on net, over the sample period and display far more cyclicality than credit union financial assets. Over the sample period, credit union financial assets have steadily increased as a share of GDP.
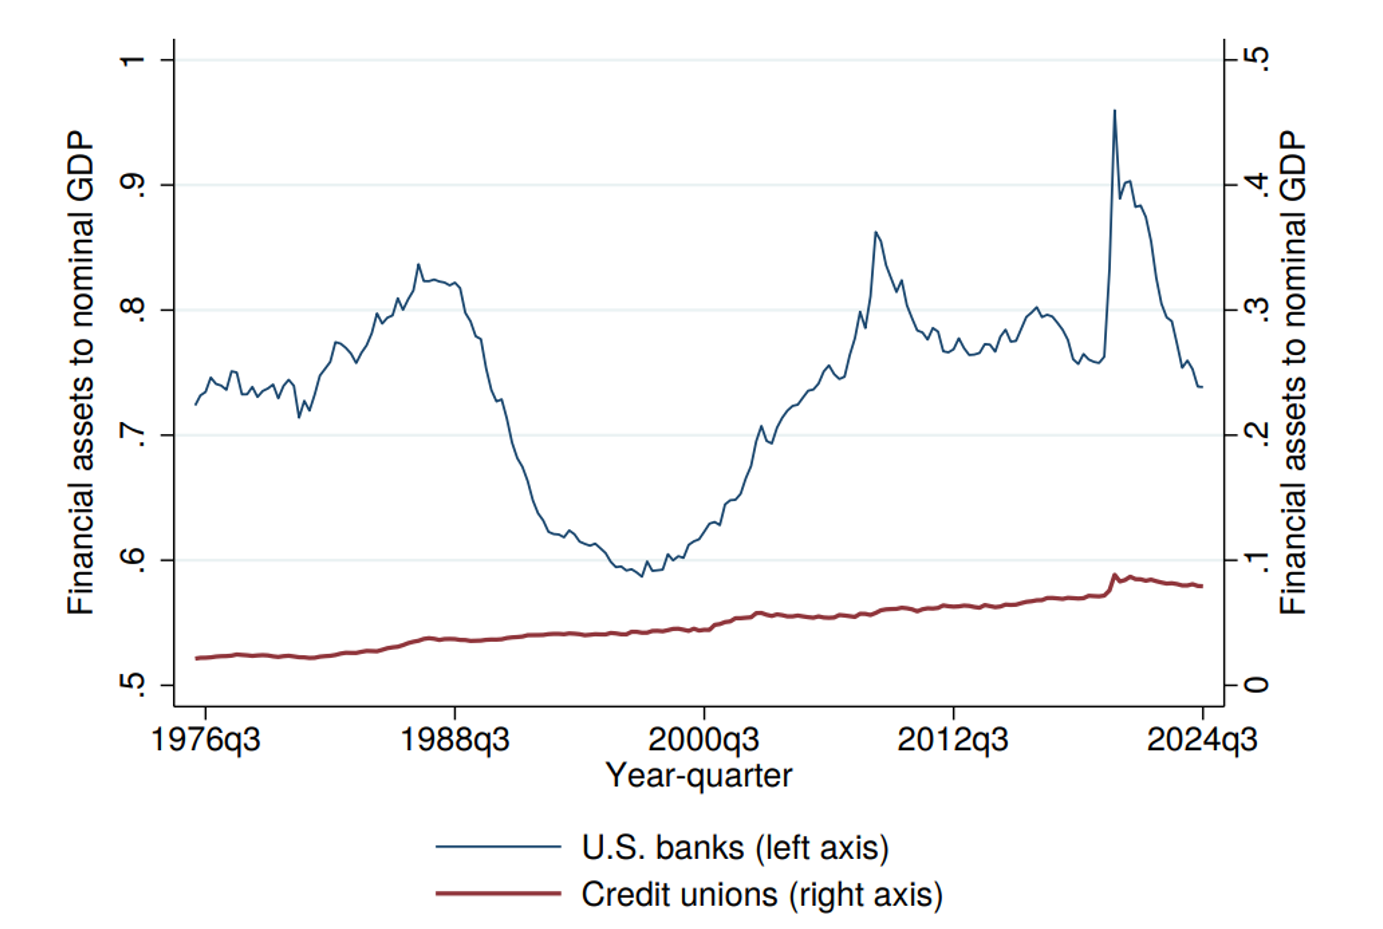
Note: The figure shows the ratio of total financial assets to nominal gross domestic product (GDP) for two subsectors of the private depository institutions sector. U.S.-chartered depository institutions sector data are shown in blue and denoted by "U.S. banks," and credit unions sector data are shown in red.
Financial Accounts series are FA086902005 for nominal GDP, FL764090005 for total financial assets of U.S.-chartered depository institutions, and FL474090005 for credit unions. See the "Financial Accounts Guide" (https://www.federalreserve.gov/apps/fof) for details on series construction.
Source: Author's calculation using Federal Reserve Board, Statistical Release Z.1, "Financial Accounts of the United States."
To better understand what is underlying these trends, in Figure 2, we show decompositions of the financial assets of U.S. banks and credit unions over time. Here, we focus our analysis on data starting in 1990:Q1, given we are interested in recent trends. U.S. banks have been holding significantly higher levels of reserves as a percent of their portfolios (nearly 9 percent as of 2024:Q3 compared with around 1 percent in 1990:Q1), while their debt securities and other financial assets have also increased modestly, in the range of 2 to 2.5 percentage points for each set of instruments. In effect, their share of loan holdings to financial assets has shrunk around 8 percentage points since 1990.
Figure 2. Financial Instrument Shares of Total Financial Assets for U.S. Banks and Credit Unions: 1990:Q1–2024:Q3
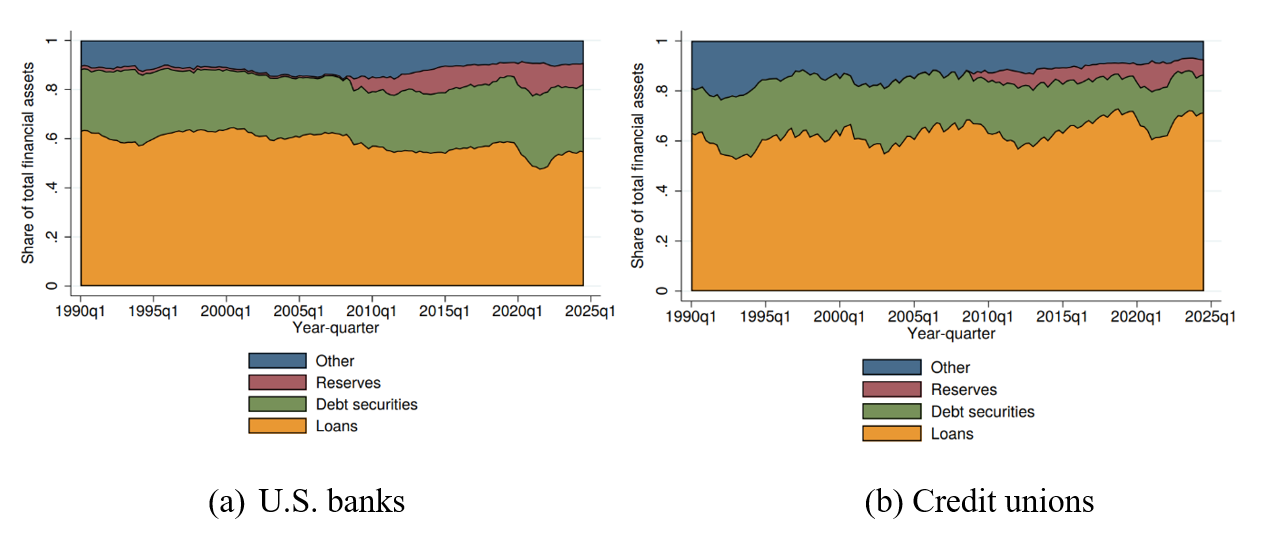
Note: The figure has two panels, which show stacked shaded areas of different financial assets to total financial assets for two subsectors of the private depository sector. The key identifies shaded areas in order from top to bottom. Panel (a) shows data for the U.S.-chartered depository institutions sector, denoted by "U.S. banks." Panel (b) shows data for the credit unions sector. Total loans is in orange. "Debt securities," shown in green, is the sum of total debt securities and federal funds and security repos. "Reserves," shown in red, is the sum of reserves at the Federal Reserve and vault cash (only for U.S. banks, as credit unions do not have an instrument for vault cash in the Financial Accounts of the United States). The remainder of financial assets is labeled as "Other," which can be computed as the difference between total financial assets and the plotted categories.
Financial Accounts series are FL764023005 for loan holdings of U.S.-chartered depository institutions and FL474023000 for credit unions, LM764022005 for total debt securities of U.S.-chartered depository institutions and LM474022005 for credit unions, FL763013005 for Reserves at the Federal Reserve of U.S.-chartered depository institutions and FL473013005 for credit unions, FL762050005 for federal funds and security repos of U.S.-chartered depository institutions and FL472050053 for credit unions, FL764090005 for total financial assets of U.S.-chartered depository institutions and FL474090005 for credit unions, and FL763025000 for vault cash of U.S.-chartered depository institutions. See the "Financial Accounts Guide" (https://www.federalreserve.gov/apps/fof) for details on series construction.
Source: Author's calculation using Federal Reserve Board, Statistical Release Z.1, "Financial Accounts of the United States."
Credit unions have also increased their reserve share over time, with it standing around 6 percent as of 2024:Q3.4 Debt securities and other financial assets shrank modestly as a percent of total financial assets, in the range of 1 to 3 percentage points, while loans grew as a percent of total financial assets, by around 8 percentage points.
Section 2: Trends in Private Depository Institution Loan Holdings
In this section, we first discuss trends in lending across banks and credit unions. We then analyze trends for consumer credit and home mortgage lending for these sectors.5 As in the previous analysis of the decompositions of financial assets, we focus our analysis on data starting in 1990:Q1.
Section 2.1: Trends in Loan Holdings
We begin our analysis by examining lending as a percent of nominal U.S. GDP by sector, which we present in Figure 3 below. As with total financial assets, U.S. banks show significantly more cyclicality in their loan holdings, in particular in the run-up to and aftermath of the Global Financial Crisis (GFC) of 2007‒09.6 However, on balance, the sector ends up a bit lower in 2024:Q3 (as a percent of GDP) relative to where it stood in 1990:Q1—at around 48 percent in 1990:Q1 and 40 percent in 2024:Q3, respectively, for U.S. banks. Differently, credit unions increased their loan holdings as a percent of nominal GDP far more steadily, from around 2 percent in 1990:Q1 to about 6 percent in 2024:Q3.
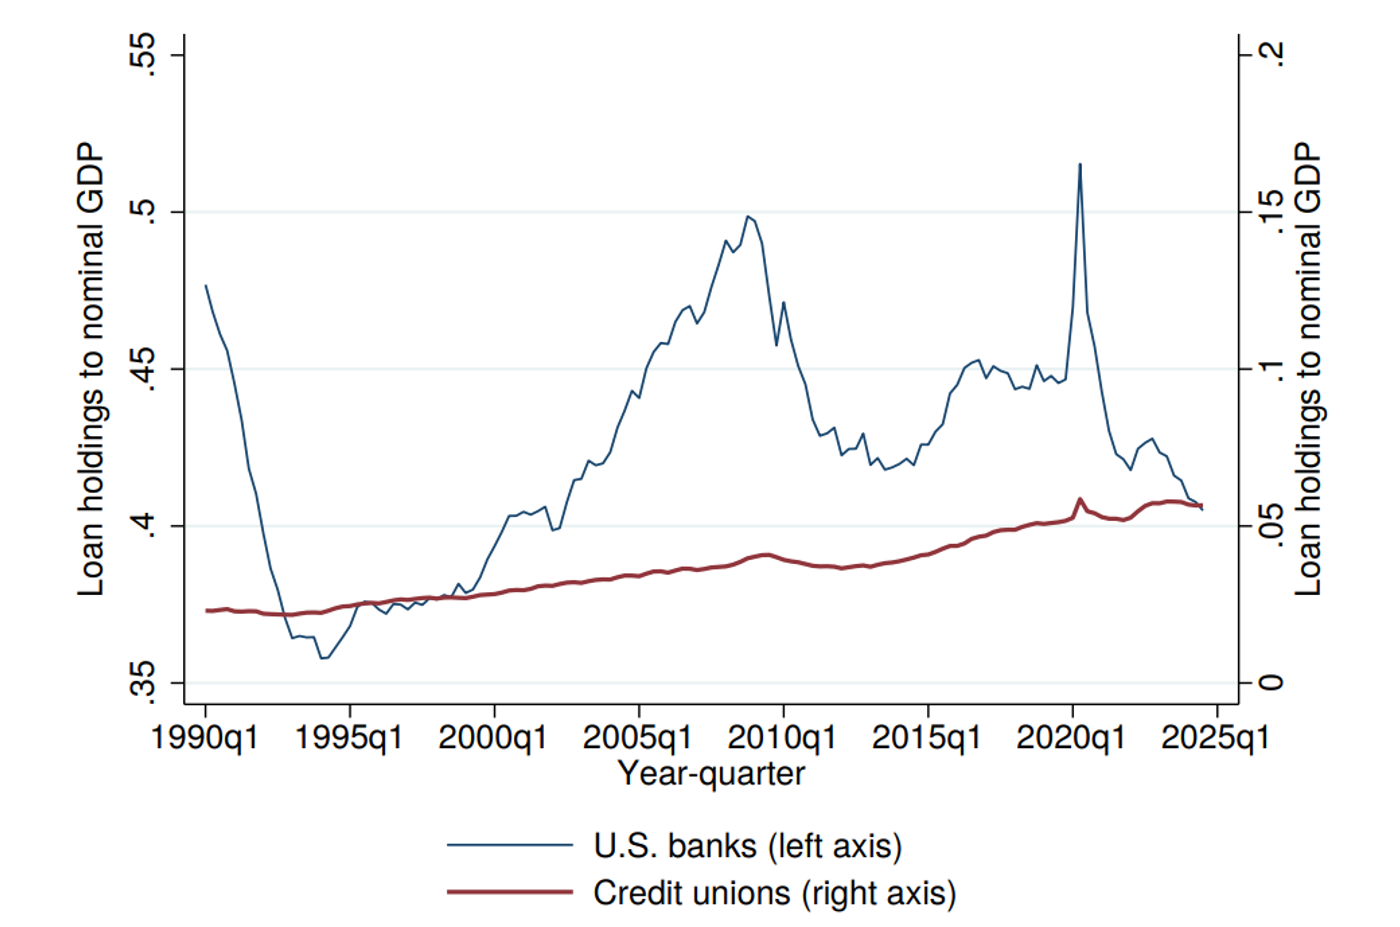
Note: The figure shows loan holdings to nominal gross domestic product (GDP) for two subsectors of the private depository institutions sector. The U.S.-chartered depository institutions sector data are denoted by "U.S. banks" (the blue line), with values on the left axis. Credit unions sector data (the red line) have values on the right axis.
Financial Accounts series are FA086902005 for nominal GDP, FL764023005 for loan holdings of U.S.-chartered depository institutions, and FL474023000 for credit unions. See the "Financial Accounts Guide" (https://www.federalreserve.gov/apps/fof) for details on series construction.
Source: Author's calculation using Federal Reserve Board, Statistical Release Z.1, "Financial Accounts of the United States."
Section 2.2: Trends in Loan Holdings, by Loan Type
We can dig deeper into trends in loan holdings by sector by looking at major loan types separately. While four loan instruments in the Financial Accounts make up total lending (depository loans not elsewhere classified, other loans and advances, consumer credit, and mortgages), we focus our analysis on consumer credit and one-to-four family residential mortgage lending, as these two subcategories make up approximately 84 percent of credit union lending as of 2024:Q3. Though here we are focused on the household categories, in Appendix A, we highlight trends in commercial real estate (CRE) mortgage lending.
Figure 4 shows loan holdings relative to nominal GDP for consumer credit and one-to-four family residential mortgages. Credit union consumer credit loan holdings have increased from about 1.5 percent of nominal GDP in 1990:Q1 to about 2.2 percent of nominal GDP as of 2024:Q3. U.S. banks have about the same level of consumer credit loan holdings in 2024:Q3 as in 1990:Q1, at about 7.1 percent of nominal GDP in 2024:Q3 compared with 7.4 percent of nominal GDP in 1990:Q1.7 This difference in consumer credit loan growth between sectors implies that credit unions have increased their market share of consumer credit loan portfolio holdings relative to banks over this period.8
Figure 4. Consumer Credit and One-to-Four Family Mortgage Loan Holdings to Nominal GDP for U.S. Banks and Credit Unions: 1990:Q1–2024:Q3
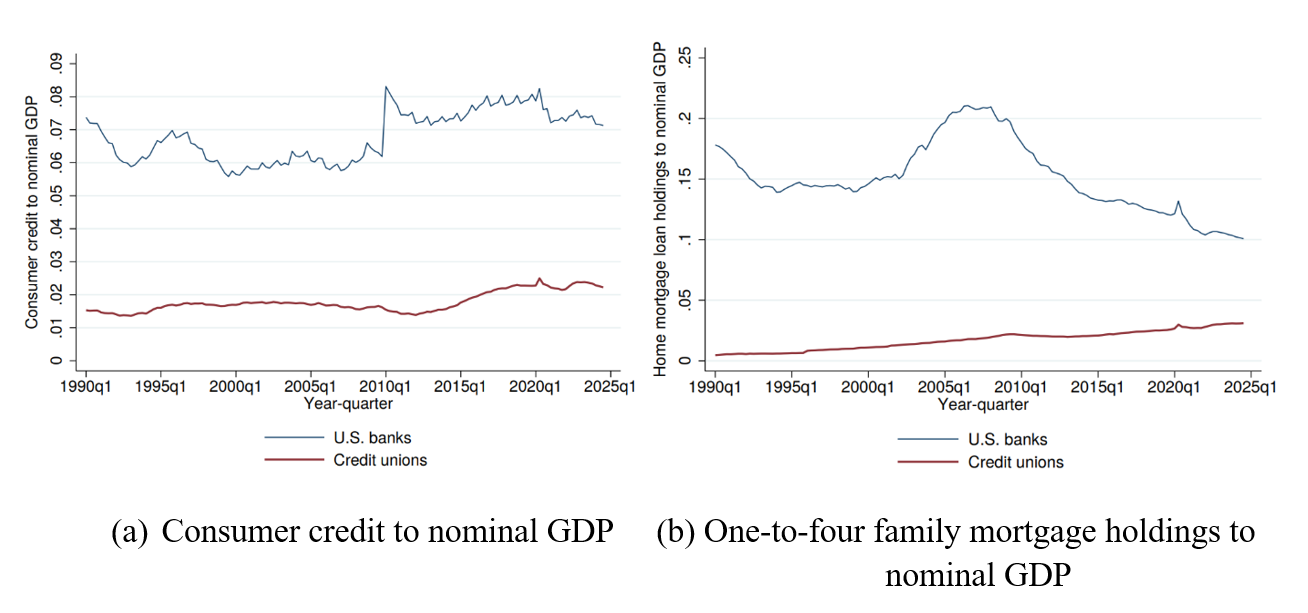
Note: The figure has two panels, which show different loan types to nominal gross domestic product (GDP) for two subsectors of the private depository sector. Panel (a) shows consumer credit loan holdings to nominal GDP. Panel (b) shows mortgage loan holdings to nominal GDP. The U.S.-chartered depository institutions sector data (the blue line) are denoted by "U.S. banks", while credit unions sector data is shown with a red line.
Financial Accounts series are FA086902005 for nominal GDP, FL763066000 for consumer credit loan holdings of U.S.-chartered depository institutions, FL763065105 for one-to-four family mortgage loan holdings of U.S.-chartered depository institutions, FL473066000 for consumer credit loan holdings of credit unions, and FL473065100 for one-to-four family mortgage loan holdings of credit unions. See the "Financial Accounts Guide" (https://www.federalreserve.gov/apps/fof) for details on series construction.
Source: Author's calculation using Federal Reserve Board, Statistical Release Z.1, "Financial Accounts of the United States."
One-to-four family mortgage holdings of U.S. banks rose significantly before the GFC of 2007‒09 and fell significantly in its aftermath. In 1990:Q1, they stood at about 18 percent of nominal GDP. At peak, they reached more than 21 percent of nominal GDP in 2006:Q3. However, as of 2024:Q3, they were around 10 percent of nominal GDP. Credit union holdings were far less cyclical over the period and have grown over time. As of 2024:Q3, they stood at about 2.6 percent of GDP, a similar level to their consumer credit holdings, whereas in 1990:Q1, they were less than 1 percent of nominal GDP. The implication for market shares is thus similar to consumer credit, with credit unions increasing their market share of mortgage loan holdings relative to U.S. banks over the sample period.9
The remaining lending is business lending. The largest category of business lending for credit unions is CRE lending, which we plot in the Appendix. As of 2024:Q3, total credit union CRE holdings in the Financial Accounts amount to $159 billion.10 This pales in comparison to US banks' holdings of CRE in the Financial Accounts, which are over an order of magnitude larger.
Section 3: Conclusion
Credit unions have grown their household portfolio lending at a faster rate than U.S. banks since 1990 on net. This development has occurred even as U.S. bank balance sheets have grown, on balance, over this period.
A variety of different factors may underlie the trends presented in this aggregate analysis. For example, differing portfolio allocation preferences between institutions may help to explain the trends. The results may also reflect relative differences in loan terms and conditions over time between credit unions and banks—that is, credit unions may be providing more desirable terms than banks, expanding their services over time, or offering credit to borrowers to whom banks are not willing to provision credit (Gissler, Ramcharan, and Yu, 2020). Given the key role credit unions play in provisioning credit in the U.S., we hope this note will spur further analysis on this topic.
References
Corbae, Dean, and Pablo D'Erasmo (2021). "Capital Buffers in a Quantitative Model of Banking Industry Dynamics," Econometrica, vol. 89 (November), pp. 2975–3023, https://doi.org/10.3982/ECTA16930.
Gissler, Stefan, Rodney Ramcharan, and Edison Yu (2020). "The Effects of Competition in Consumer Credit Markets," Review of Financial Studies, vol. 33 (November), pp. 5378–415, https://doi.org/10.1093/rfs/hhaa035.
Hanson, Samuel G., Andrei Shleifer, Jeremy C. Stein, and Robert W. Vishny (2015). "Banks as Patient Fixed-Income Investors," Journal of Financial Economics, vol. 117 (September), pp. 449–69, https://doi.org/10.1016/j.jfineco.2015.06.015.
Ramcharan, Rodney, Stephane Verani, and Skander J. Van Den Heuvel (2016). "From Wall Street to Main Street: The Impact of the Financial Crisis on Consumer Credit Supply," Journal of Finance, vol. 71 (June), pp. 1323–56, https://doi.org/10.1111/jofi.12209.
Appendix A: CRE Lending at Credit Unions
Figure A.1 highlights recent trends in commercial real estate (CRE) mortgage lending (which we define here to be the sum of multifamily residential mortgages, farm mortgages, and commercial mortgages) to nominal GDP for both credit unions and U.S. banks. The figure shows that credit unions have increased their market share of CRE mortgage loan holdings relative to U.S. banks over the sample period. As of 2024:Q3, the share of credit union CRE holdings to nominal GDP was 0.5 percent, over six times its value in 1997:Q1.
Figure A1. Commercial Real Estate Mortgage Loan Holdings to Nominal GDP for U.S. Banks and Credit Unions: 1990:Q1–2024:Q3
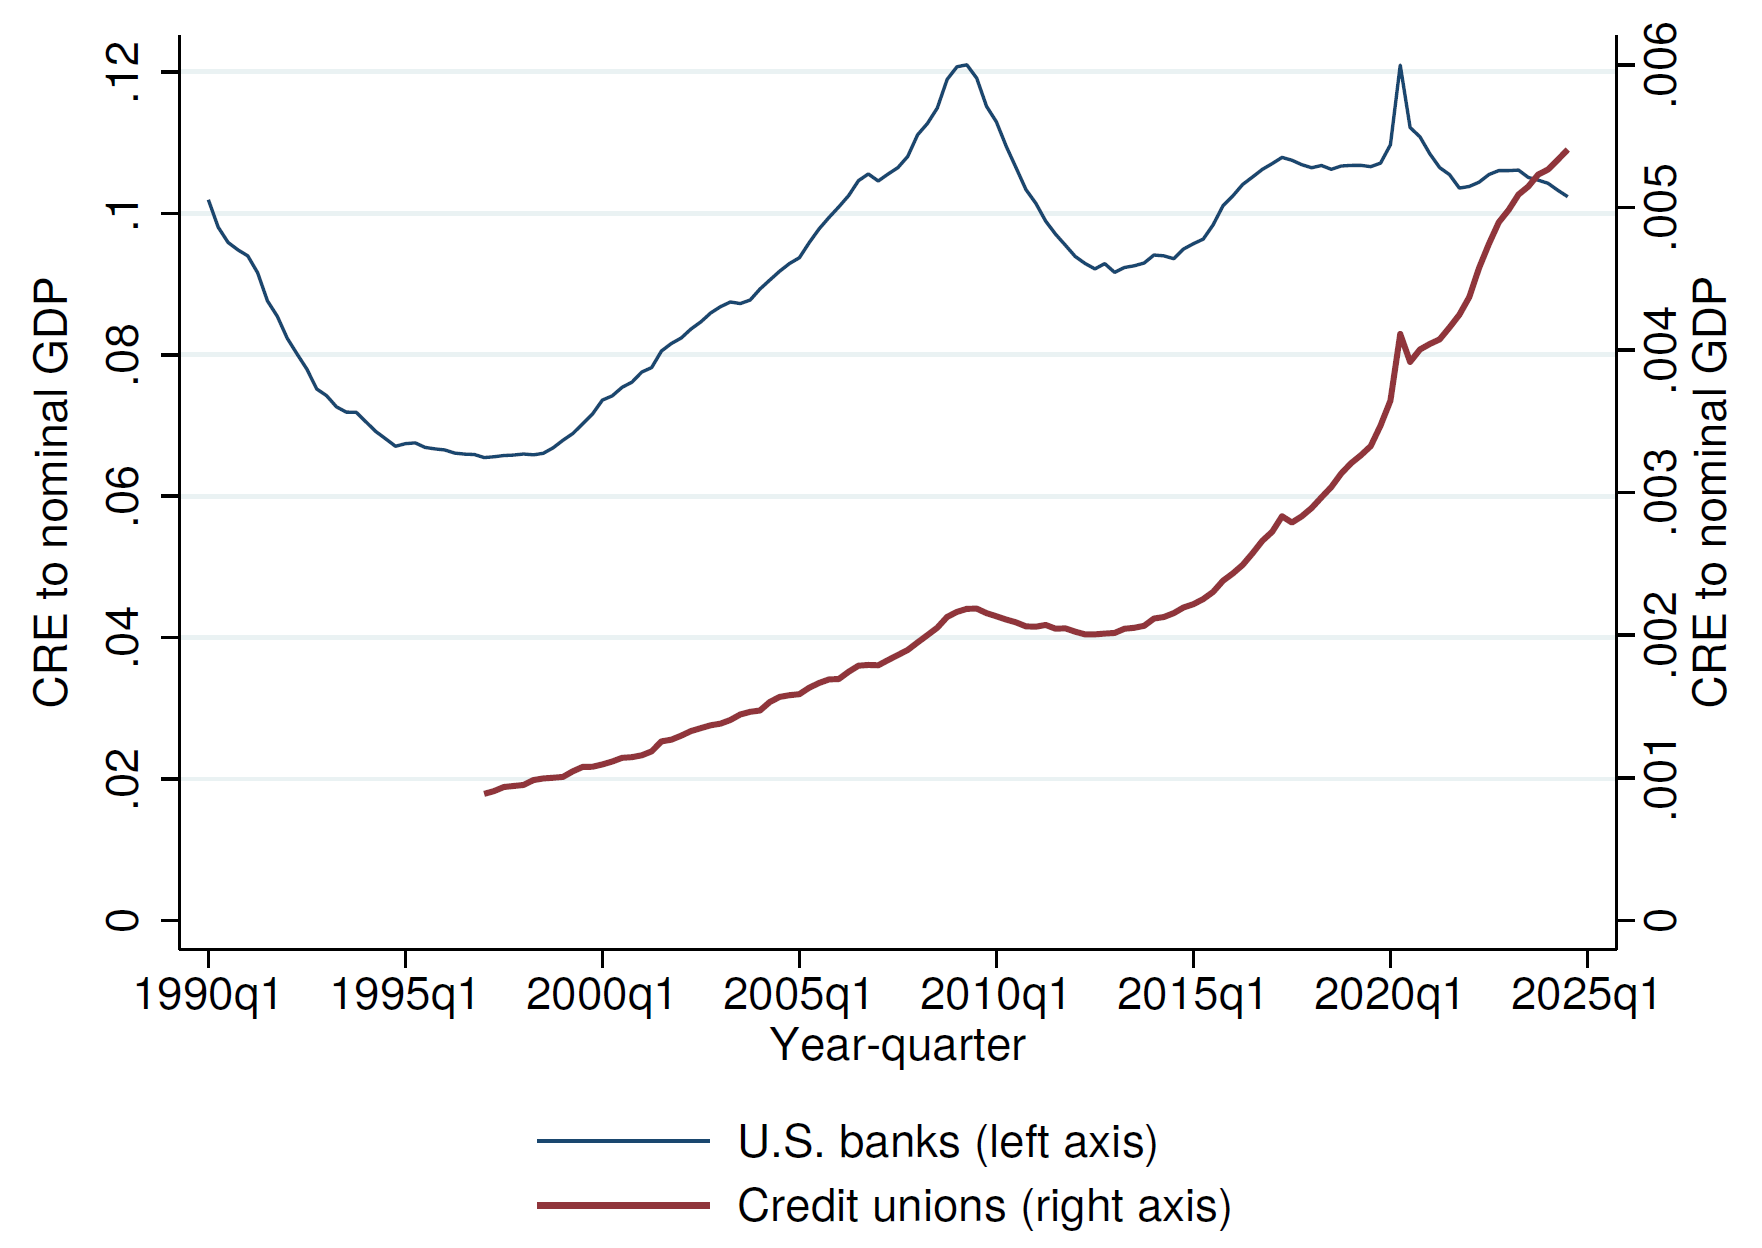
Note: The figure shows the ratio of commercial real estate mortgage loan holdings to nominal gross domestic product (GDP) for two subsectors of the private depository institutions sector. U.S.-chartered depository institutions sector data are shown in blue and denoted by "U.S. banks," and credit unions sector data are shown in red. The Credit Union series starts in 1997:Q1, while the U.S. banks series starts in 1990:Q1.
Commercial real estate mortgage loan holdings are calculated as the sum of multifamily residential mortgages, farm mortgages, and commercial mortgages. Financial Accounts series are thus FL763065405 for multifamily residential mortgages of U.S.-chartered depository institutions and FL473065403 for credit unions; FL763065633 for farm mortgages of U.S.-chartered depository institutions and FL473065603 for credit unions; FL763065505 for commercial mortgages of U.S.-chartered depository institutions and FL473065503 for credit unions; and FA086902005 for nominal GDP. See the "Financial Accounts Guide" (https://www.federalreserve.gov/apps/fof) for details on series construction.
Source: Author's calculation using Federal Reserve Board, Statistical Release Z.1, "Financial Accounts of the United States."
1. The authors are grateful for the comments and suggestions of Marco Cagetti, Stefan Gissler, Matt Hoops, Borghan Narajabad, and Maria Perozek. The views presented in this note are those of the authors and do not necessarily reflect those of the Federal Reserve Board or the Federal Reserve System. Return to text
2. See Financial Accounts Tables L.111 (https://www.federalreserve.gov/apps/fof/guide/l111.pdf) and L.114 (https://www.federalreserve.gov/apps/fof/guide/l114.pdf) for the tables of the U.S.-Chartered Depository Institutions sector and Credit Unions sector, respectively. There are important differences between the two sectors besides their holdings and how they are funded. For example, credit unions are not-for-profit while banks are for-profit institutions. For further reference on these differences, there are a number of papers in the literature that provide detailed institutional reviews on both sectors. For credit unions, see, for example, Ramcharan, Verani, and Van Den Heuvel (2016) or Gissler, Ramcharan, and Yu (2020). For banks, see, for example, Hanson et. al. (2015) or Corbae and D'Erasmo (2021), among the many examples. Return to text
3. Although we show the data starting in 1976, the Financial Accounts data are available for these series going further back in time. Return to text
4. Credit union reserves data were incorporated into the Financial Accounts in 2009:Q4. The first quarter in which reserves are nonzero in the Accounts is 2000:Q1. Return to text
5. Some series have changed through the history in how they are constructed. In this note, we report on the series as they are currently constructed at the time of this note's publication. Return to text
6. Also, as with total financial assets, it is important to note the difference in scale between the institutions, as credit union loan holdings to nominal GDP (on the right axis) never reach 7 percent of nominal GDP, while bank loan holdings to nominal GDP (on the left axis) vary from just above 35 percent of nominal GDP to more than 50 percent of nominal GDP. Return to text
7. The introduction of Financial Accounting Standard 166/167 introduces a jump in this series in 2010:Q1. Return to text
8. There are other major holders of consumer credit, such as finance companies and the federal government (through student loans). See Table L.222 here for the consumer credit instrument table in the Financial Accounts: https://www.federalreserve.gov/apps/fof/DisplayTable.aspx?t=l.222. Return to text
9. Here, we are only talking about one-to-four family mortgages held on portfolio. Such mortgage holdings do not reflect total mortgage exposure, as exposure can also be obtained through holding mortgage-backed securities. Additionally, as with consumer credit, there are other major holders of one-to-four family mortgages. See Table L.218 here for the one-to-four family residential mortgage instrument table in the Financial Accounts: https://www.federalreserve.gov/apps/fof/DisplayTable.aspx?t=l.218. Return to text
10. Credit union commercial real estate mortgage loan holding data were introduced into the Financial Accounts in 2024:Q3. The first quarter in which credit union CRE mortgages are nonzero in the Accounts is 1997:Q1. Return to text
Kurtzman, Robert J., and Hannah Landel (2025). "Trends in Credit Unions' Share of U.S. Private Depository Household Lending," FEDS Notes. Washington: Board of Governors of the Federal Reserve System, January 31, 2025, https://doi.org/10.17016/2380-7172.3697.
Disclaimer: FEDS Notes are articles in which Board staff offer their own views and present analysis on a range of topics in economics and finance. These articles are shorter and less technically oriented than FEDS Working Papers and IFDP papers.