FEDS Notes
November 03, 2017
Having a Lot Isn't Enough: Trends in Upsizing Houses and Shrinking Lots
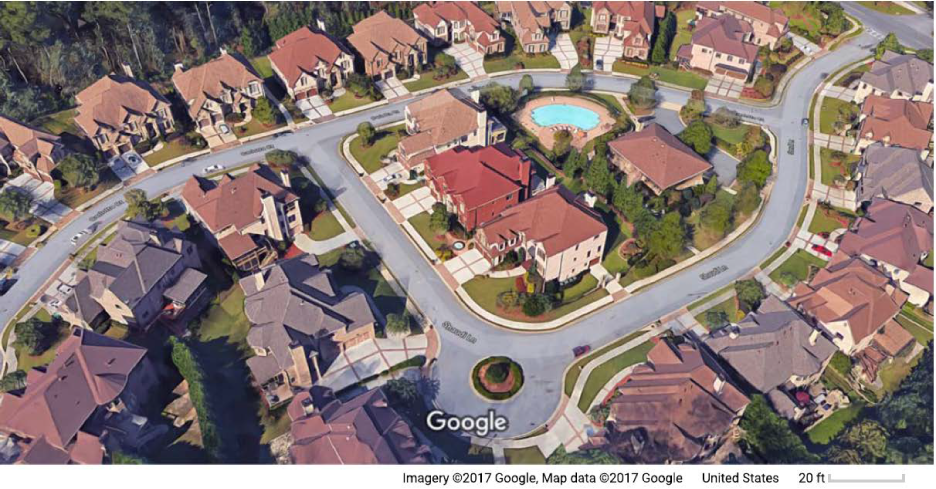
Properties like those in Figure 1 from a suburban community in Atlanta, Georgia, were a rare sight twenty or thirty years ago.2 According to the CoreLogic real estate database, a typical house in this community boasts 6 bedrooms, 5 full baths, and a massive over 8,000 square feet of indoor space. By contrast, the 8,700-square-foot lot on which the house sits is barely large enough to contain it.
Today, this residential community--with its behemoth houses and diminutive lawns-- exemplifies a national trend: larger houses built on smaller lots. The median size of single family residences built from 1980 to 2014 grew by 50 percent, from 1,600 to 2,400 square feet. By contrast, during that same time, the median lot size shrank by over 20 percent; dwindling from 11,300 to 8,800 square feet. As a result, we observe a marked increase in the building-to-lot-size ratio, the median of which ballooned from 0.14 for houses constructed in 1980 to 0.27 for those constructed in 2014.
Several recent articles and real estate blogs have noted this trend. A blog entry by CoreLogic, http://www.corelogic.com/blog/authors/bin-he/2017/04/the-more-the-merrier.aspx#.WZRGW2e3R7b, for instance, argues that expanding houses and shrinking lots reflect a substitution effect from lots to homes, given the relatively faster appreciation of land prices. Other articles have attributed at least part of this trend to increased proximity to public greenways, parks, and bodies of water, which function as a substitute for private lawns (Cho, Clark, Park, and Kim 2009, https://www.jstor.org/stable/27647865?seq=1#page_scan_tab_contents). Smaller lots may also be indicative of increasing population density in economic centers (McGill 2016, https://www.theatlantic.com/business/archive/2016/07/lawns-census-bigger-homes-smaller-lots/489590/), while larger buildings could be the product of changes to zoning regulations (Thompson 2013, http://www.seattletimes.com/seattle-news/tiny-lots-big-houses-neighbors-feeling-squeeze-despite-ban/).
Moreover, this trend has been remarkably universal since the early 1990s. House size has been increasing and lot size decreasing in counties with expensive and inexpensive properties, with high- and low-income residents, with dense and sparse populations, and with different age compositions in essentially all regions of the United States. That said, while the upward trend of the building-to-lot-size ratio has been ubiquitous, both the level of the ratio and its dynamics vary across counties. The differences may depend on a number of factors, such as income and property prices. In this note, we document the trend of the building-to-lot-size ratio in recent decades and study the factors associated with heterogeneity observed both in the level and growth of this ratio.
Our findings indicate that, holding other factors constant, properties in areas with higher house prices and a denser population tend to have greater building-to-lot-size ratios, whereas properties in areas with higher household incomes and a greater share of retirees in the population tend to have lower ratios. Looking at trends from 1980 to 2014, we find that counties with higher population and income growth experience greater gains in the building-to-lot-size ratio.
1. CoreLogic Real Estate Data and County-level Statistics
We obtained data on building and lot sizes from the CoreLogic Real Estate Database, which records numerous characteristics of individual properties, including building square footage, lot size, location, and year of construction as reported by government property tax agencies. We used a 30-percent random sample of single family residences and townhouses constructed between 1980 and 2014, and trimmed off the top and bottom 2 percent of both the lot and building size distribution to minimize the influence of outliers. One limitation of our data source is that we were unable to tell if the building size remained the same since its initial construction or changed due to subsequent additions and renovations. County-level data on property prices, income, population size and density, and the share of the population aged 65 or older (the 'retirement population') were obtained from the 1980 and 2010 Decennial Census, the 2010 American Community Survey, and the CoreLogic House Price Index. Our analysis focused on counties located in metropolitan statistical areas (MSAs).
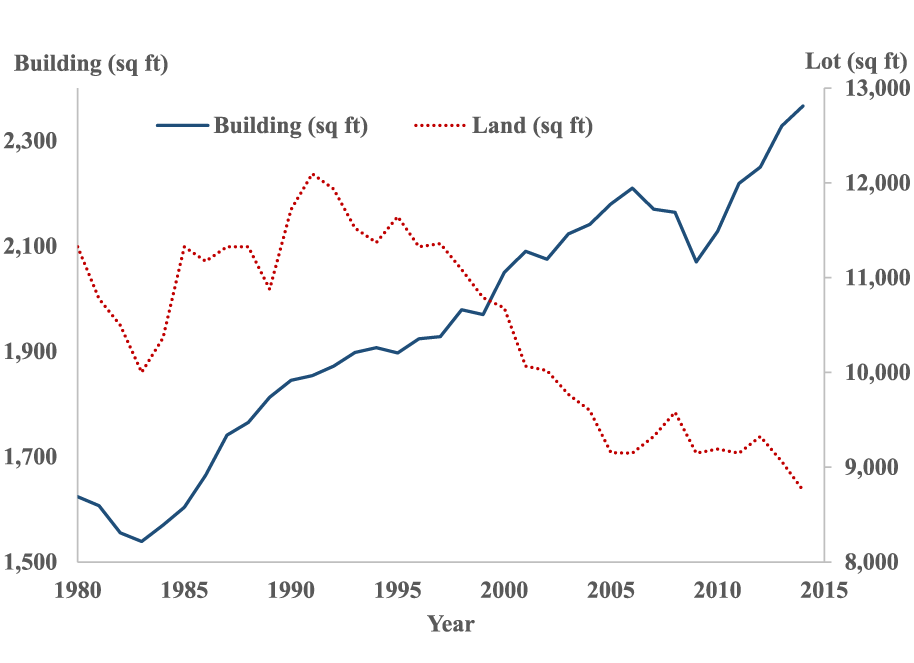
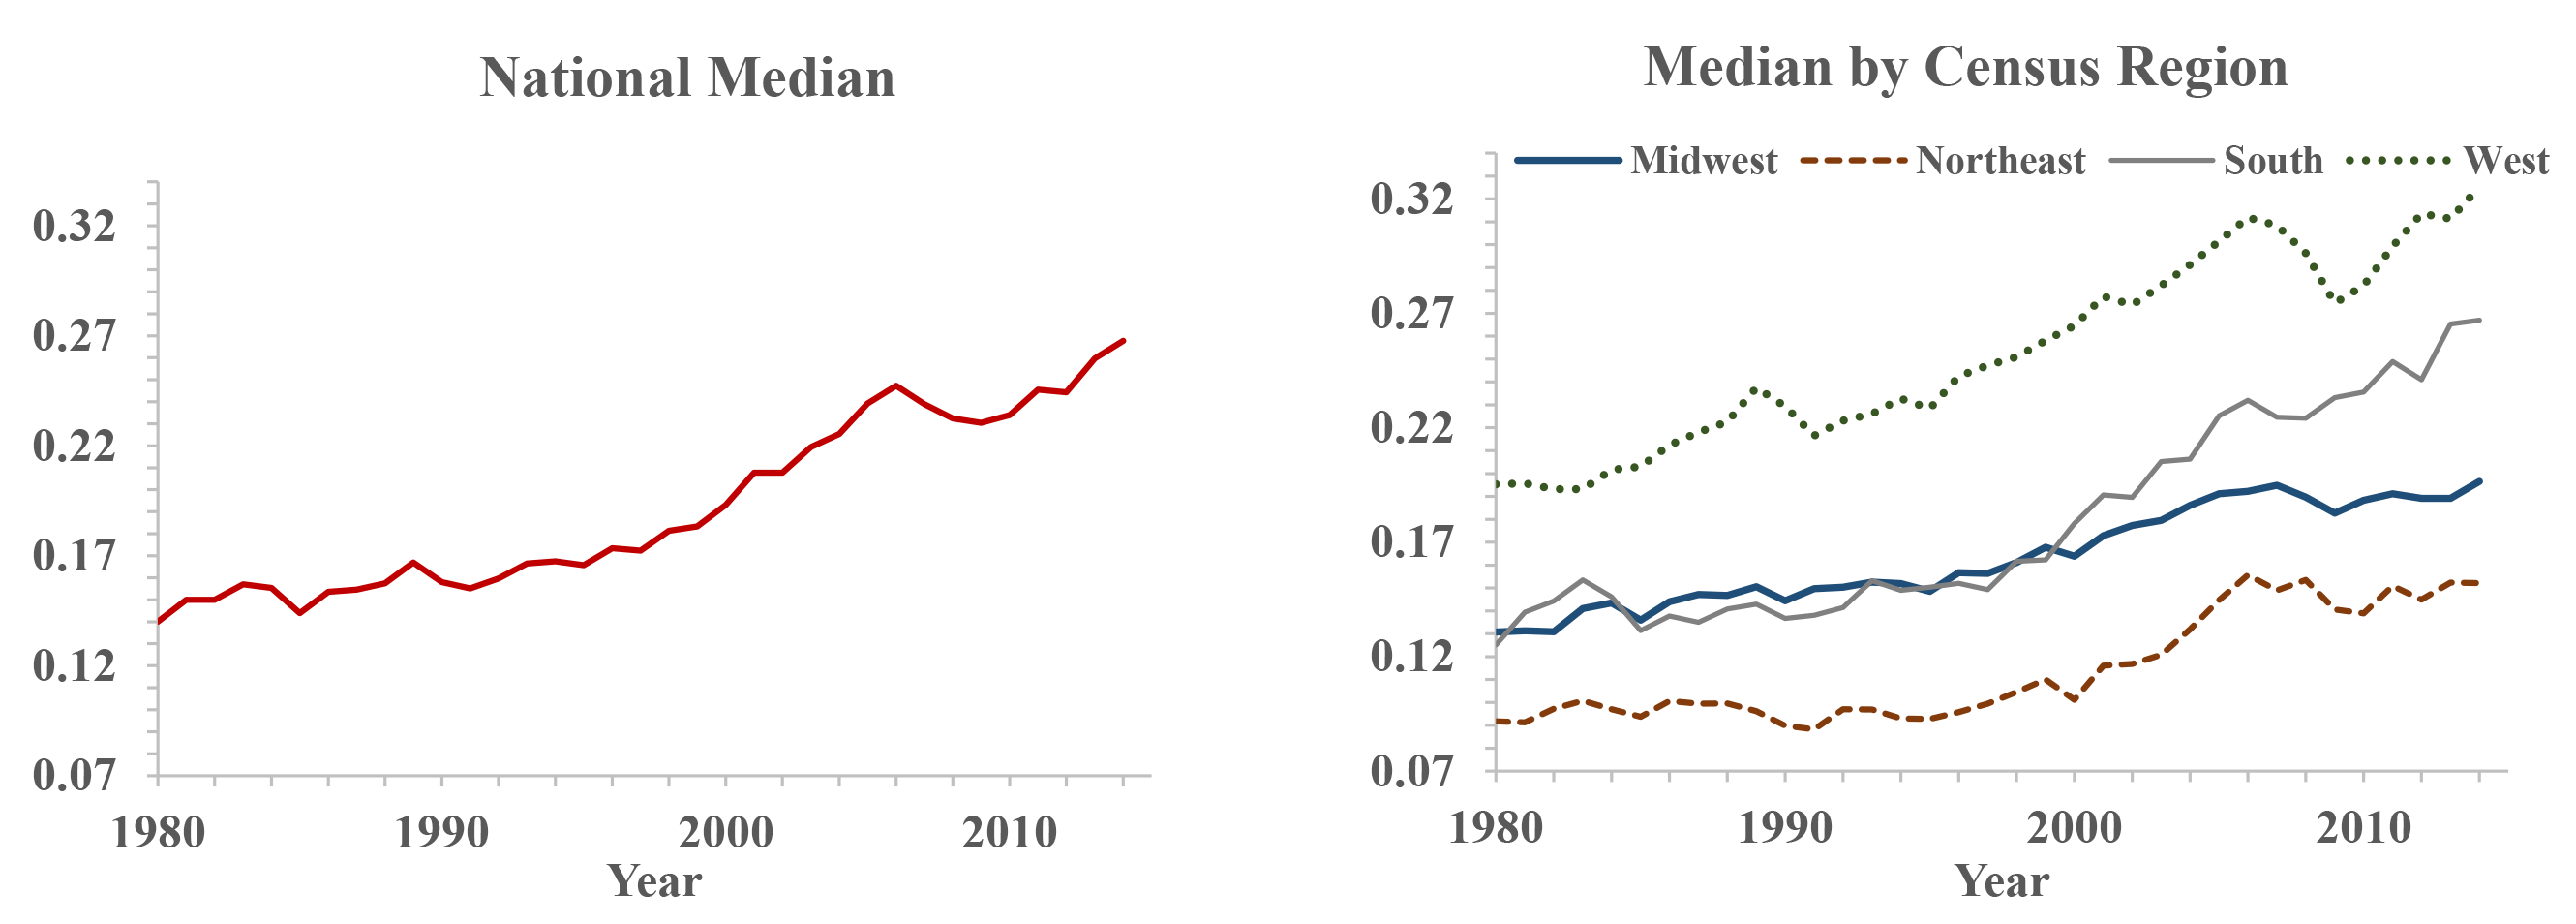
As shown in Figure 2, the median building size increased consistently (with a slight dip during the 2008 financial crisis) from 1,600 to 2,400 square feet, while the median lot size fluctuated during the 1980s before beginning to shrink over the next two decades. On net, the median lot size of homes shrank from 11,300 square feet for homes built in 1980 to 8,800 square feet for homes built in 2014. Both of these trends contributed to the steady increase of the national median building-to-lot-size ratio (Figure 3) beginning in the early 1980s. The right panel of Figure 3 suggests that this trend is observed in all U.S. regions, with increases in the West and South being most pronounced.
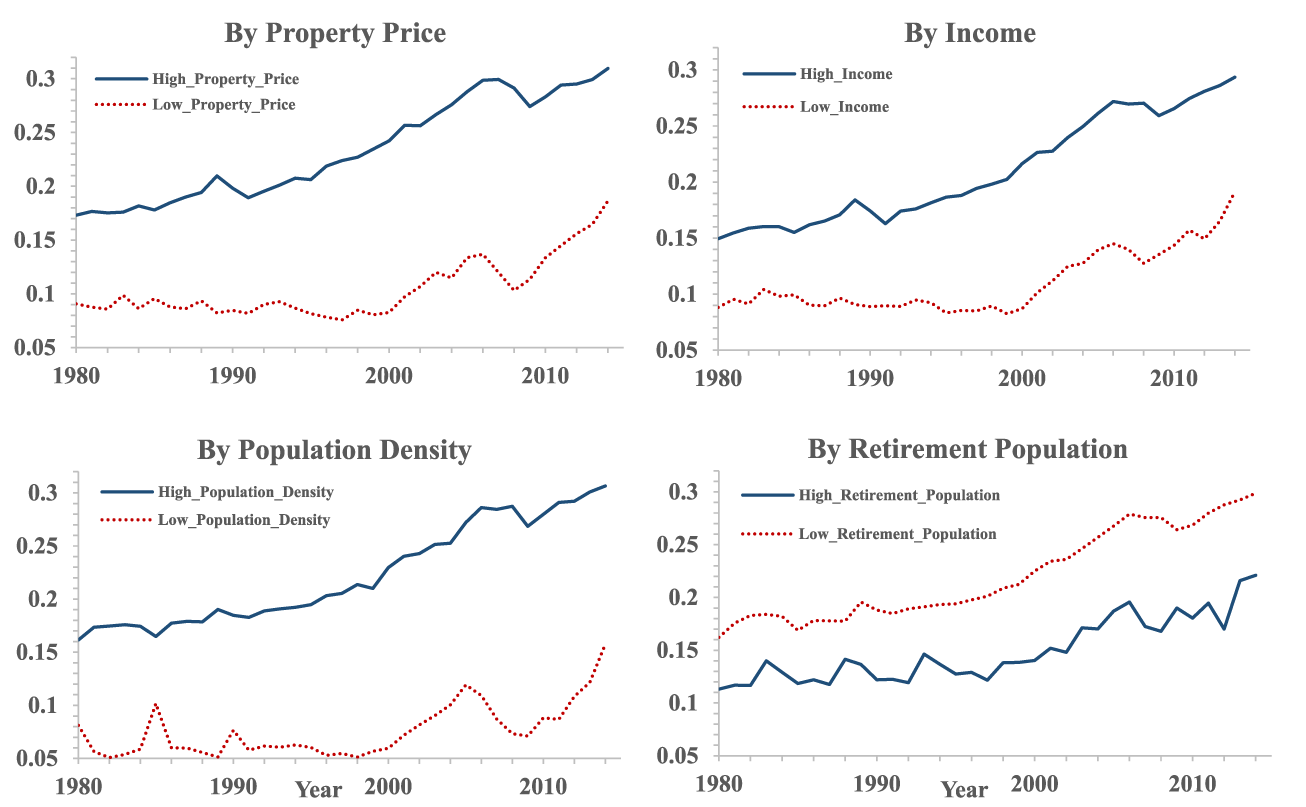
Figure 4 plots the median building-to-lot-size ratio of properties in counties in the top or bottom quartile (measured in 2010) of selected county characteristics. We can see from this figure that the increase in the ratio has been ubiquitous; appearing in counties with expensive and inexpensive properties, with high- and low-income households, with dense and sparse populations, and with varying age compositions.
However, there is also considerable heterogeneity with respect to both the level and growth rate of the ratio along these dimensions. For example, counties with more expensive properties, higher household incomes, denser populations, and relatively fewer retirees appear to have properties with higher building-to-lot-size ratios.
2. Determinants of the Building-to-Lot-Size Ratio
Numerous supply and demand factors may affect characteristics of properties on the market, including the building-to-lot-size ratio, although to our knowledge, they have not been systematically studied. For parsimony, we estimate the following model.
(1) $$ {Ratio}_i^p = \alpha + \beta { price }_i + \gamma { income }_i + \delta { density }_i + \theta { retirement }_i + u_i^p $$
In the equation above, Ratioip is the pth percentile or the mean of the building-to-lot-size ratio in county i in 2014; price and income are the median property price and income of the county, respectively, density is population density, and retirement is the share of the population aged 65 or older (all measured in 2010). Among the factors considered in this model, house price is one of the most important indicators of local housing market conditions. Together with household income, prices determine housing affordability and thereby influence characteristics of properties on the market. Additionally, land is a scarcer resource in more densely populated areas, implying a higher building-to-lot-size ratio. Finally, consumer preferences for indoor and outdoor spaces may change over the course of their lives, suggesting that share of retirement population may be an important variable. Our analysis is descriptive, and does not necessarily reveal any causal relationships.
All right hand side variables are expressed in logs. We estimated our model setting p equal to percentiles ranging from the 5th to 95th percentile, as well as to the mean, in order to examine the effects of our explanatory variables across the entire distribution of the building-to-lot-size ratio. The results are presented in Table 1, and all standard errors are clustered at the state level.
From Table 1, we can see that higher property prices and denser populations are associated with greater building-to-lot-size ratios, while higher incomes and aging populations appear to have the opposite association. We examined these effects more closely by regressing building and lot sizes separately on the same set of independent variables as in equation (1). The results (not shown) indicate that counties with more expensive properties have smaller lots (implying a higher ratio), that high-income counties have moderately larger buildings and significantly larger lots (implying a lower ratio), that densely populated counties have larger buildings and smaller lots (implying a higher ratio), and that counties with relatively more elderly residents have larger lots (implying a lower ratio).
To get a sense for the economic significance of these effects, consider the following scenarios. A 10-percent appreciation in a county's median property price would be associated with a 7.4 percent drop in median lot size of newly constructed homes and an increase in the median building-to-lot-size ratio of 0.016 (6 percent of the national median). If instead the median income rose by 10 percent, median building and lot sizes would be expected to grow by 4.5 percent and 10.5 percent respectively, and the median building-to-lot-size ratio would fall by 0.015. An influx of new residents – enough to increase the population density by 10 percent – would be associated with a 2.2 percent drop in median lot size, a 0.5 percent increase in median building size, and a 0.004 increase in the median building-to-lot-size ratio (2 percent of the national median). Finally, if the share of retirees were to grow by 1 percent, we would expect to see a 0.7 percent increase in median lot size and a drop in the median ratio by 0.001 (only 0.5 percent of the national median). With few exceptions, the effects of our explanatory variables are more pronounced towards the upper end of the ratio distribution. Note that, while Figure 4 indicates that properties in higher-income counties have greater building-to-lot-size ratios (top right panel), our regression results indicate that, after conditioning on property price, the partial effect of income on the building-to-lot-size-ratio is negative.
Table 1: Determinants of the Building-to-Lot-Size Ratio
| Building-to-lot-size ratio 2014 | ||||||
|---|---|---|---|---|---|---|
| Percentile | Mean | |||||
| 5th | 25th | 50th | 75th | 95th | ||
| Median property price | 0.056*** | 0.112*** | 0.156*** | 0.216*** | 0.270*** | 0.160*** |
| (0.012) | (0.023) | (0.03) | (0.033) | (0.056) | (0.024) | |
| Median income | -0.080*** | -0.132*** | -0.149** | -0.161** | -0.08 | -0.128** |
| (0.022) | (0.039) | (0.056) | (0.075) | (0.118) | (0.051) | |
| Population density | 0.017*** | 0.035*** | 0.044*** | 0.064*** | 0.102*** | 0.051*** |
| (0.002) | (0.003) | (0.006) | (0.009) | (0.015) | (0.006) | |
| Retirement population | -0.049** | -0.104*** | -0.128*** | -0.162*** | -0.216*** | -0.130*** |
| (0.021) | (0.034) | (0.035) | (0.038) | (0.065) | (0.033) | |
| Constant | 0.266* | 0.267 | -0.001 | -0.526 | -1.917* | -0.282 |
| (0.157) | (0.301) | (0.422) | (0.682) | (1.116) | (0.459) | |
| Observations | 595 | 595 | 595 | 595 | 595 | 595 |
| R-squared | 0.377 | 0.468 | 0.465 | 0.46 | 0.377 | 0.527 |
3. Conclusion
The national trend of building larger homes on smaller lots has been ubiquitous over the past several decades. In this note, we document this trend and study how several variables are associated with the building-to-lot-size ratio. We find considerable heterogeneity with respect to the level of this ratio between counties of different property prices, income levels, population densities, and age compositions. Counties with more expensive properties and denser populations have greater building-to-lot-size ratios, while counties with higher incomes and relatively larger retirement populations have lower ratios.
Our findings likely reflect changes in both housing supply and demand. For example, the construction and land acquisition costs faced by developers may influence building and lot sizes within a development, as well as impact the per square footage prices of building and land for homebuyers. Moreover, variation in local zoning regulations may impose direct restrictions on the size of buildings and lots. Changing consumer preferences may also play a role in shifting the demand for properties with certain building and lot sizes. While the analysis presented in this note is descriptive in nature and does not attempt to elucidate any structural features of the real estate market, studying the effects of these mechanisms in a structural model presents a promising agenda for future research.
References:
Cho, S. H., Clark, C. D., Park, W. M., & Kim, S. G. (2009). Spatial and temporal variation in the housing market values of lot size and open space. Land Economics, 85(1), 51-73.
He, B. (2017, April 5). The More, the Merrier; Homebuilders are building larger homes on smaller lots [Web log post]. Retrieved August 23, 2017, from http://www.corelogic.com/blog/authors/bin-he/2017/04/the-more-the-merrier.aspx#.WZ2JHme3R7b
McGill, A. (2016, July 6). The Shrinking of the American Lawn [Web log post]. Retrieved August 23, 2017, from https://www.theatlantic.com/business/archive/2016/07/lawns-census-bigger-homes-smaller-lots/489590/
Thompson, L. (2013, September 9). Tiny lots, big houses: Neighbors feeling squeeze despite ban [Web log post]. Retrieved August 23, 2017, from http://www.seattletimes.com/seattle-news/tiny-lots-big-houses-neighbors-feeling-squeeze-despite-ban/
1. This note was written when Bowen worked as a project intern at the Federal Reserve Board. The views presented in the note are the authors and do not necessarily reflect those of the Federal Reserve Board or its staff. Return to text
2. https://www.google.com/maps/@33.841627,-84.29138,116a,35y,270h,45t/data=!3m1!1e3 Return to text
Bowen, Dillon and Geng Li (2017). "Having a Lot Isn't Enough: Trends in Upsizing Houses and Shrinking Lots," FEDS Notes. Washington: Board of Governors of the Federal Reserve System, November 3, 2017, https://doi.org/10.17016/2380-7172.2090.
Disclaimer: FEDS Notes are articles in which Board staff offer their own views and present analysis on a range of topics in economics and finance. These articles are shorter and less technically oriented than FEDS Working Papers and IFDP papers.