


FEDS Notes
November 09, 2026
U.S. Private Credit Vehicles: Institutional Structure and Aggregate Balance Sheets
Katie Brinkman, Christine Dobridge, Tim Dore, Simon Glossner, Elizabeth Holmquist, Nam Nguyen, Maria Perozek, and Irina Stefanescu1
1. Introduction
The expansion of private credit has become one of the most significant developments in financial markets over the past decade. Yet, estimates of the size of the market vary considerably, in part because the term private credit is used to describe different instruments, investment strategies, and financial intermediaries. This note provides an overview of the private credit market, describes the principal vehicles through which private credit is financed and held, and uses newly published U.S. Financial Accounts statistics to estimate the size of these vehicles and the composition of their balance sheets.2
U.S.-domiciled private credit vehicles held approximately $1.9 trillion in assets at the end of 2025, having grown from roughly $240 billion in 2012.3 Private debt funds (PD funds) represented the largest category, accounting for $940 billion in assets, followed by business development companies (BDCs), interval and tender offer funds, and middle-market collateralized loan obligations (MM CLOs). While these private credit vehicles often invest in similar types of loans, they vary significantly in their asset exposures, funding structures, leverage, and investor bases. For instance, while private credit loans account for almost 80 percent of aggregate BDC assets and all of MM CLO assets, PD funds and interval and tender offer funds tend to be more diversified across asset classes, with private credit loans only accounting for 57 percent and 26 percent of their assets, respectively. BDCs tend to be more highly levered with an average debt-to-equity ratio around 1, compared to ratios of around 0.25 for PD funds and around 0.05 for interval and tender offer funds.
This note is organized as follows: Section 2 provides an overview of private credit market structure and key participants; Section 3 analyzes balance sheets of private credit vehicles, including portfolio composition and debt financing patterns; Section 4 discusses the potential drivers of variation across vehicle types; and Section 5 concludes.
2. Structure of the private credit market
2.1 What is private credit?
In this note, we define private credit loans primarily by the channel through which credit is intermediated.4 Specifically, we use the term to refer to debt instruments extended to borrowers through private negotiation and financed primarily through nonbank investment vehicles, rather than traditional bank balance sheets or securities issued in public debt markets.5 This definition encompasses corporate direct lending, asset-based and specialty finance, real estate debt, infrastructure debt, and other privately negotiated loans. It therefore does not depend on the identity of the borrower, the purpose of the loan, or the assets supporting repayment.6
2.2 How does the private credit market work?
Figure 1 illustrates the private credit ecosystem and the relationships among the principal parties. Investors provide funds to private credit vehicles and in return, they receive claims issued by those vehicles. In turn, private credit vehicles use investor funds to finance loans to nonfinancial businesses and other borrowers, who are then required to repay principal and interest according to the contractual terms of the loans. The following subsections discuss each of these market participants in turn.
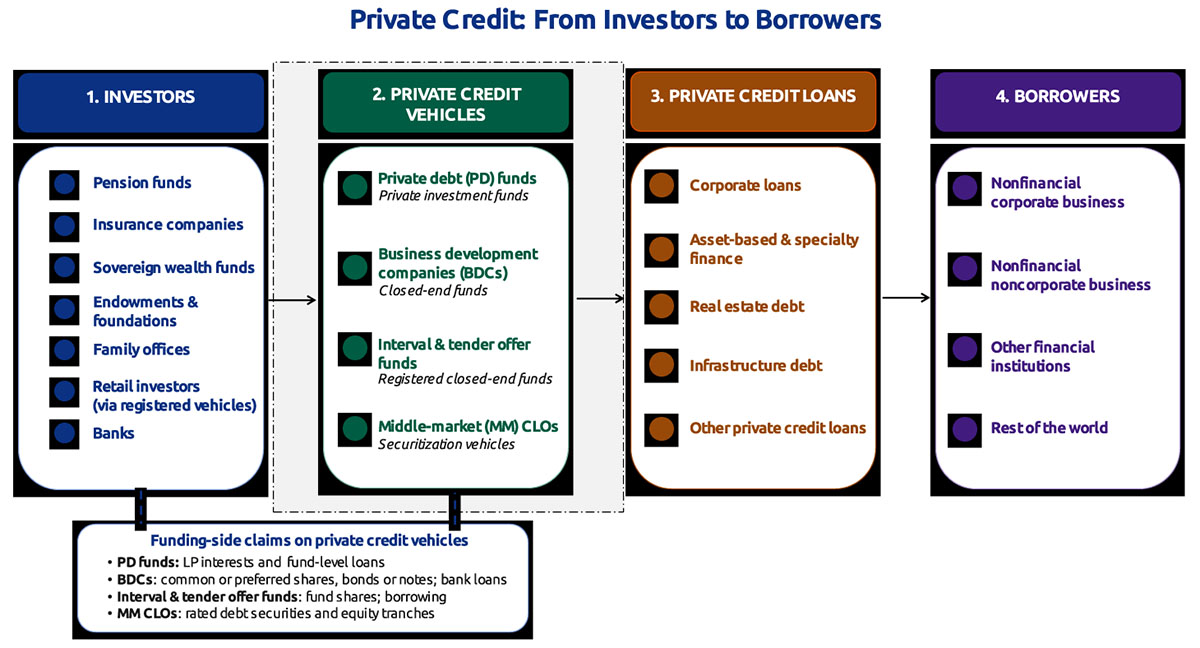
This framework also defines the perimeter of the market measured in the Financial Accounts and detailed in this note. We focus on private credit loans financed and held through nonbank investment vehicles—namely, PD funds, BDCs, interval and tender offer funds, and MM CLOs. Direct holdings of loans or privately placed debt securities by banks, insurance companies, and other institutional investors are outside the vehicle-based definition of private credit presented here.
2.3 Who are the borrowers and what types of loans do they receive?
Private credit loans finance a broad range of borrowers and economic activities. Nonfinancial corporations—particularly middle-market companies—account for the largest share of private credit debt outstanding, using these loans to finance acquisitions, leveraged buyouts, investment, growth, and refinancing.7 These borrowers are not necessarily excluded from bank or public credit markets but may choose private credit because it can provide speed and certainty of execution, confidentiality, customized financing structures, or the ability to negotiate directly with a relatively small group of lenders. Borrowers may also combine private credit term loans with revolving credit facilities, leveraged loans, and other services supplied by banks.8
The expansion of private credit beyond traditional corporate direct lending has broadened both the borrower and the collateral base. Private credit vehicles also finance real estate, infrastructure, equipment, receivables, inventories, consumer and small-business loans, royalties, and other financial assets or contractual cash flows.
Private credit loans also differ in their seniority and the principal basis on which they are underwritten. They range from first-lien senior secured loans to second-lien and subordinated loans, mezzanine debt and other instruments with debt- and equity-like features. In cash-flow lending, loan size and repayment capacity depend primarily on the borrower's expected operating cash flows, with collateral and enterprise value providing additional lender protection. In asset-based lending, loan size is based primarily on the value of specified assets or contractual cash flows such as receivables, inventory, equipment, real estate, and royalties, which also provide a source of recovery in the event of default. This distinction is not always sharp, as many private credit loans rely both on cash-flow generation and asset values.
2.4 What are the private credit vehicles?
We distinguish private credit loans from the private credit vehicles that finance them and hold them as assets. The principal vehicles considered in this note are PD funds, BDCs, interval and tender offer funds, and MM CLOs.9 These vehicles hold private credit loans, often along with other investments, but differ substantially in their legal structure, investor base, liquidity provisions, use of leverage, and regulatory treatment.
(a) PD Funds
PD funds are privately offered, closed-end investment vehicles that are typically organized as limited partnerships and managed by an affiliated investment adviser.10 They are limited to private offerings to sophisticated investors, including pension funds, insurance companies, endowments, foundations, sovereign wealth funds, family offices, and other institutional or qualified investors. These investors participate as limited partners (LPs), while the sponsor or its affiliate serves as the general partner (GP) and investment manager. Capital is raised through investor commitments and drawn over time through capital calls to fund loan originations and acquisitions. Because investors generally do not have redemption rights before the fund's termination, these funds have a stable capital base and are not subject to redemption-driven liquidity pressures. PD funds span a wide range of private credit strategies with different mandates and risk profiles, including direct lending, mezzanine and junior capital, distressed and special situations, asset-based and specialty finance, private real estate debt, and infrastructure debt.
(b) BDCs
BDCs are specialized investment vehicles created by Congress under the Small Business Investment Incentive Act of 1980 to channel capital to small and mid-sized U.S. businesses. Unlike traditional investment companies that primarily invest in publicly traded securities, BDCs focus on financing privately held and thinly traded companies that typically lack access to public capital markets.11 BDCs are allowed substantially higher leverage than traditional registered investment companies: the statutory baseline allows 1:1 debt-to-equity ratios (or 200 percent asset coverage), and the Small Business Credit Availability Act of 2018 allows a BDC to elect a 2:1 leverage (or 150 percent asset coverage).
There are three different types of BDCs. BDCs can be publicly traded, public and non-traded, or private companies:
- BDCs structured as publicly listed companies issue shares that are traded on national securities exchanges. The shares of these BDCs are available to everyone, including retail investors.
- Public, non-traded BDCs choose not to list their shares on an exchange and instead offer their securities directly to investors who meet certain suitability standards, typically through broker-dealers or registered investment advisers. Although these BDCs are not traded on an exchange, they typically provide liquidity through periodic redemptions or repurchases of shares.
- Private BDCs offer ownership rights to either accredited or qualified investors, such as institutional investors and high-net-worth individuals, depending on their structure. Private BDCs provide liquidity to shareholders only through a liquidity event, such as a liquidation or a merger.
(c) Interval and Tender Offer Funds
Interval funds and tender offer funds are closed-end investment vehicles designed to accommodate illiquid asset classes (e.g., private credit) while providing investors with limited, periodic liquidity through scheduled repurchase mechanisms. The fundamental distinction between the two structures lies in the mandatory versus discretionary nature of their repurchase obligations. Interval funds must conduct periodic repurchase offers at net asset value (NAV) at specified intervals, up to a certain percentage of outstanding shares.12 In contrast, tender offer funds conduct discretionary tender offers and fund managers have flexibility over repurchase timing, frequency, pricing, and offer size.13
(d) MM CLOs
Collateralized loan obligations (CLOs) are financial vehicles that issue securities, in tranches with different risk profiles, backed by pools of loans. MM CLOs are CLOs backed by loans to middle-market companies specifically. The loans underlying CLOs are often originated by direct lenders such as PD funds, BDCs, and asset managers affiliated with life insurers. These lenders, or affiliates of the lenders, then commonly also serve as the CLO managers.
2.5 Who are the investors?
Investors obtain exposure to private credit loans by providing capital to the vehicles that finance and hold them. Depending on the vehicle, investors may acquire partnership interests, shares, or debt and equity securities. The investor base varies substantially across vehicle types. Traditional PD funds raise capital primarily from institutional investors, including pension funds, insurance companies, sovereign wealth funds, endowments, and foundations. BDCs, interval funds, and tender offer funds provide varying degrees of access to individual investors, while MM CLOs are held predominantly by institutional investors. These differences in investor base are closely related to the legal structure, liquidity, and regulatory treatment of each vehicle.
3. Private credit vehicles: Balance sheets
3.1 Size and growth
We use a variety of data sources to construct balance sheet estimates for private credit vehicles and to allocate instruments to holders and borrowers for the aggregates published in the Financial Accounts. See the data appendix for a detailed description of the data and methods underlying the private credit aggregates published in the Financial Accounts, as well as the additional distributional detail provided in this note.
As shown in Figure 2, we estimate that the total assets of U.S.-domiciled private credit vehicles reached approximately $1.9 trillion in 2025.14 PD funds are the largest private credit vehicle with $940 billion in assets, followed by BDCs ($570 billion), interval and tender offer funds ($290 billion), and MM CLOs ($50 billion).
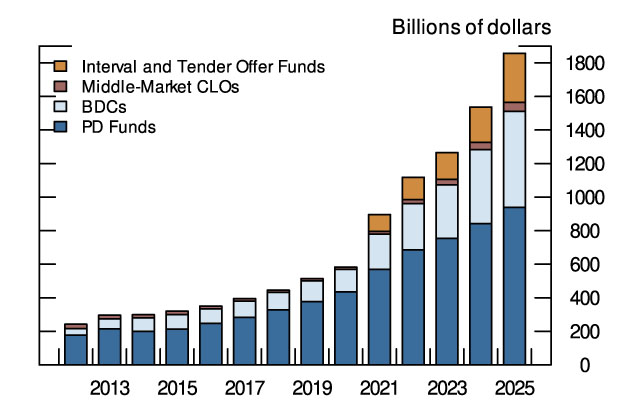
Note: Data as of Q4 each year. The key identifies bars in order from top to bottom.
Source: Financial Accounts of the United States.15
This represents substantial growth from 2012, when total assets across these vehicles stood at approximately $240 billion—an eightfold increase over the thirteen-year period. PD funds and BDCs account for most of the growth. PD fund assets have grown by more than $750 billion, from about $175 billion in 2012, while BDCs grew by about $530 billion from a much lower starting level of about $40 billion. Recent growth has been particularly strong, with total assets increasing by 21 percent between 2024 and 2025, driven by the rapid growth of assets held by BDCs (30 percent) and interval and tender offer funds (39 percent).
3.2 Portfolio composition
The composition of assets varies significantly across the different vehicle types. As shown in Figure 3, private credit loans account for only about 57 percent of PD fund assets as of 2025. These funds have significant holdings of corporate equities and debt securities, representing about 18 percent and 13 percent of assets, respectively. Notably, the share of private credit loans has increased over time, with debt securities declining roughly an equal amount, suggesting PD funds are shifting away from secondary market securities toward direct lending relationships.16
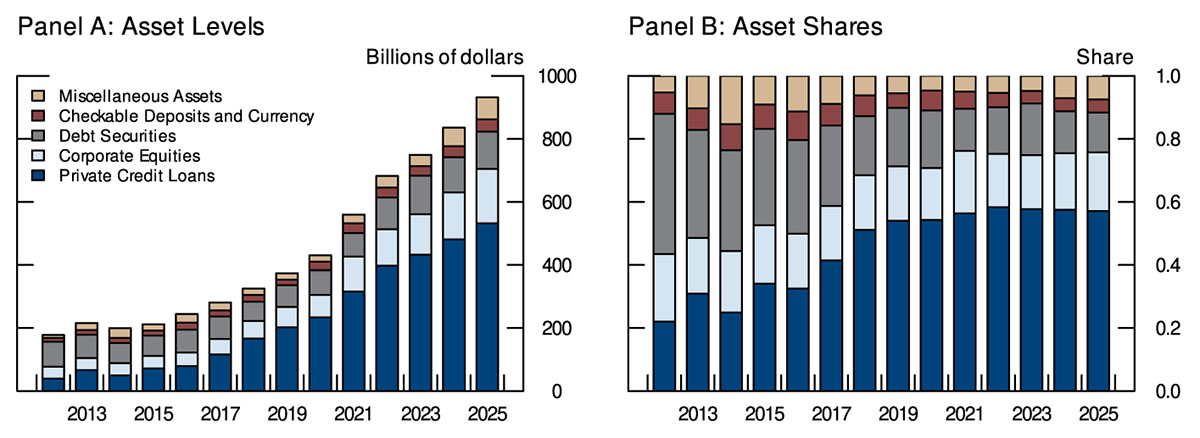
Note: U.S.-domiciled funds only. Data as of Q4 each year. Excludes dry powder. Missing data on holdings are imputed based on holdings of funds of the same private debt strategy. The key identifies bars in order from top to bottom.
Source: Financial Accounts of the United States.
In contrast, about 80 percent of BDC assets are private credit loans, consistent with their statutory requirements, as shown in Figure 4.
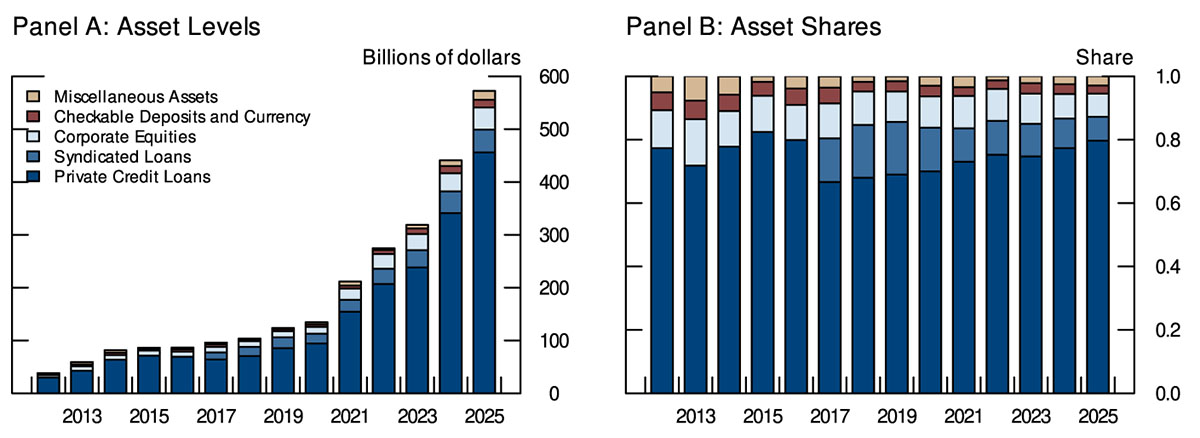
Note: Data as of Q4 each year. Syndicated loan data available starting 2017. The key identifies bars in order from top to bottom.
Source: Financial Accounts of the United States.
As shown in Figure 5, private credit loans held by interval and tender offer funds account for a significantly smaller share of assets (26 percent), while corporate equities account for 44 percent and debt securities account for almost 14 percent. Finally, MM CLOs invest exclusively in private credit loans.17
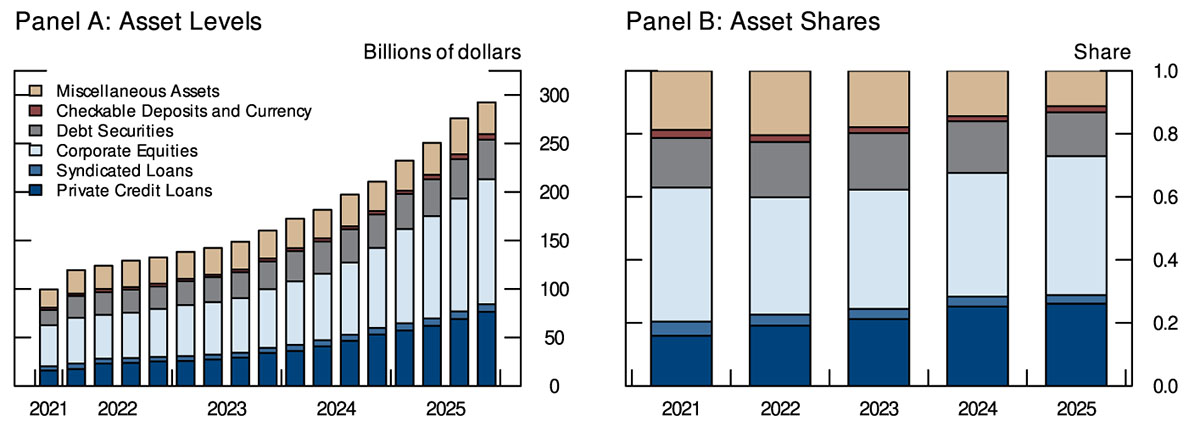
Note: In Panel A, data are quarterly. In Panel B, data are as of Q4 each year. The key identifies bars in order from top to bottom.
Source: Financial Accounts of the United States.
3.3 Debt financing and leverage
As assets have grown, total debt of private credit vehicles has increased significantly since 2012, though leverage ratios have remained relatively stable in recent years. However, leverage varies substantially across vehicle types.
Turning first to PD funds, total debt, defined as loans plus debt securities, grew from about $33 billion in 2012 to $234 billion in 2025 (Figure 6).18 Domestic banks provide almost two-thirds of total debt to PD funds, with other loans and advances accounting for the remainder. Leverage at PD funds, calculated as the ratio of debt-to-equity (or debt-to-NAV), is low on average and relatively stable at around 0.25.19 While average leverage is low, some PD funds have considerably higher leverage. As shown in Panel B of Figure 6, funds at the 90th percentile of the leverage distribution have debt-to-NAV ratios that typically range around 1. Importantly, asset-weighted leverage ratios show similar patterns, indicating that most private credit capital is deployed through funds that have low leverage, while high-leverage outliers tend to be smaller vehicles.20
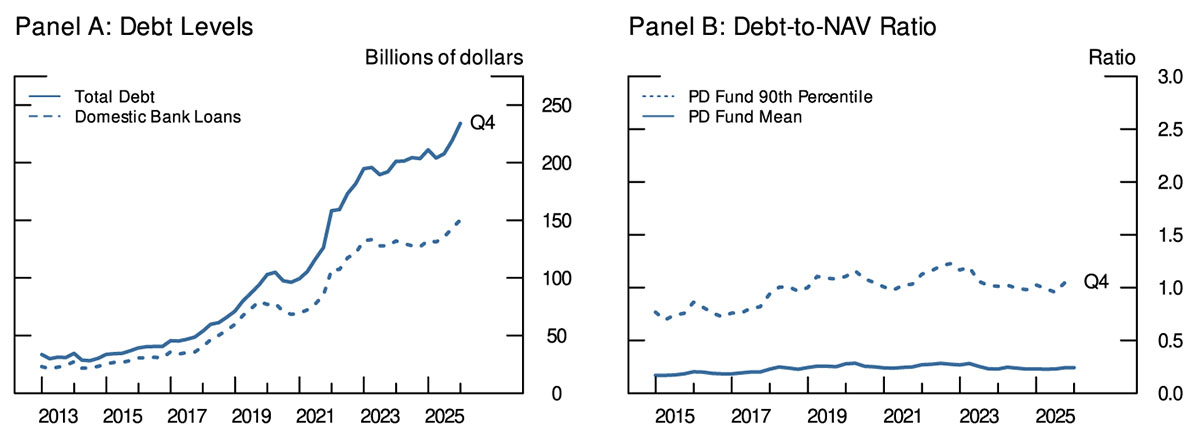
Note: NAV is net asset value. Debt is defined as loans plus debt securities. PD funds do not issue debt securities. The difference between total debt and domestic bank loans is other financial business loans and foreign loans.
Source: Financial Accounts of the United States, SEC Form PF.
BDC debt has also grown rapidly since 2012. As shown in Figure 7, BDC debt grew from about $14 billion in 2012 to $260 billion in 2025. Similar to PD funds, banks provide the majority of BDC financing, though corporate bonds are also an important source of funding. BDCs are, on average, more highly levered than PD funds, with average leverage ratios around 1 and 90th percentile leverage around 1.5 in recent years.
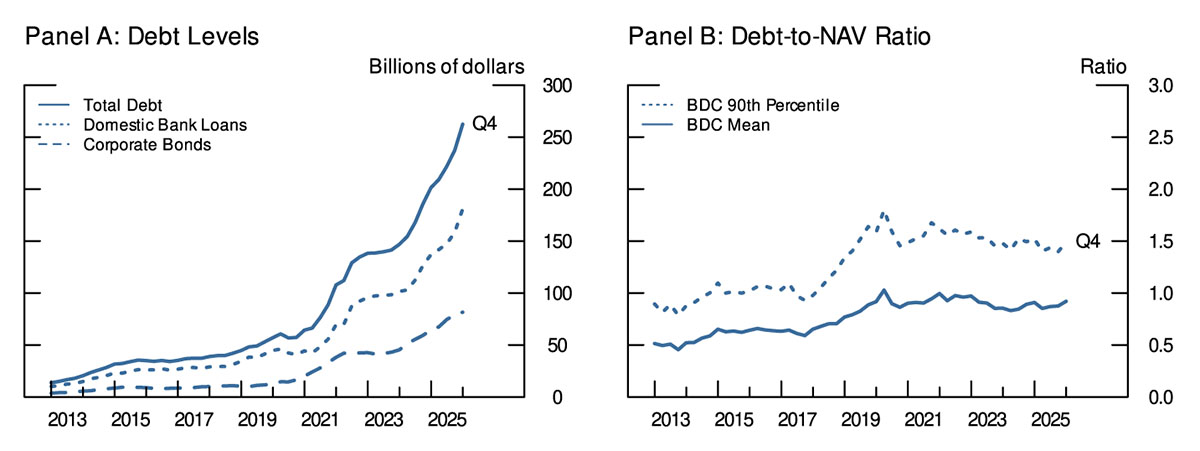
Note: NAV is net asset value. Debt is defined as loans plus debt securities.
Source: Financial Accounts of the United States, BDC Collateral.
Like PD funds and BDCs, debt of interval and tender offer funds has increased sharply in recent years. As shown in Figure 8, debt of interval and tender offer funds reached about $21 billion in 2025, with bank loans accounting for about 90 percent of the total. Leverage of interval and tender offer funds is quite low; the average leverage ratio is about 0.05 and the 90th percentile is only about 0.15 during the last few years.
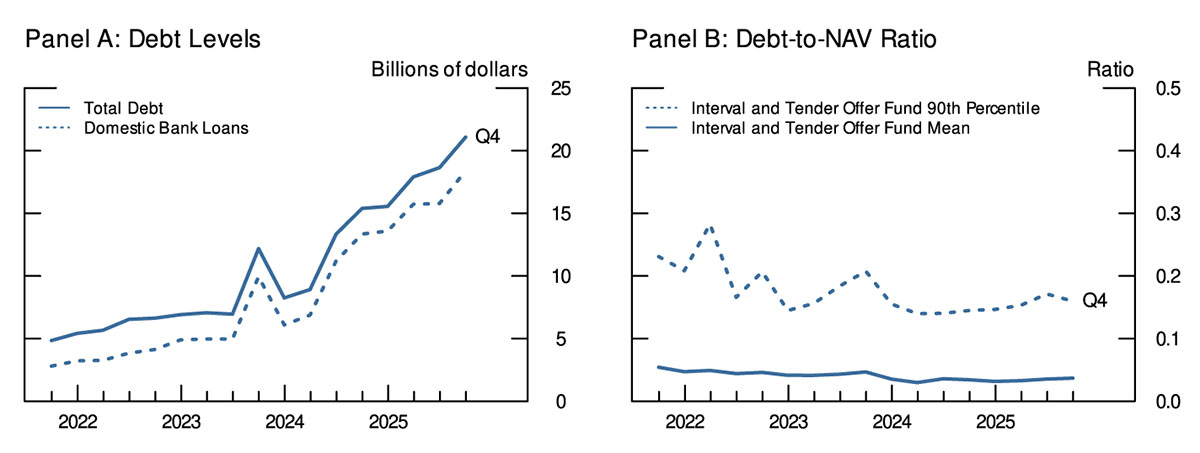
Note: NAV is net asset value. Debt is defined as loans plus debt securities. The difference between total debt and domestic bank loans is federal funds and security repurchase agreements.
Source: Financial Accounts of the United States, SEC Form N-PORT.
4. Interpreting balance sheet differences
The balance sheet differences in portfolio composition, debt financing, and leverage documented above reflect three interconnected factors: regulatory architecture, liquidity obligations, and investor composition.
(1) Regulatory architecture: Different private credit vehicles operate under different regulatory environments, which can constrain and shape the behavior of the funds. For example, BDCs face explicit leverage limits (up to 2:1 debt-to-equity) and asset-composition requirements (70 percent in qualifying assets). Interval and tender offer funds face tighter leverage limits (1:2 debt-to-equity) but fewer asset-composition restrictions, while PD funds have greater flexibility over both leverage and portfolio composition but generally restrict participation to qualified investors. These differences help to explain BDCs' relatively high leverage and concentration in direct middle-market lending relative to interval and tender offer funds, and the greater heterogeneity in leverage across PD funds.
(2) Liquidity obligations: Redemption features vary substantially across private credit vehicles and are related to portfolio liquidity. Private credit vehicles with greater redemption risk are likely to hold a greater share of liquid assets than those that lock up capital for longer periods. PD funds and private BDCs generally provide liquidity only through distributions and liquidation; as a result, they face limited redemption pressures and can maintain greater exposure to illiquid private loans in their portfolios. Perpetual non-traded BDCs typically offer quarterly share repurchases capped at around 5 percent of net asset value, subject to board discretion to limit or suspend repurchases. Recent redemption pressures in these vehicles highlight the liquidity challenges of offering periodic investor withdrawals while holding illiquid private loans. By contrast, interval funds typically offer periodic redemptions of 5 percent of outstanding shares per quarter, requiring greater balance sheet flexibility and more liquid asset holdings.
(3) Investor composition: Investor eligibility requirements help segment private credit across vehicles. PD funds generally restrict participation to investors meeting specified wealth or sophistication criteria, limiting access for retail investors. BDCs and registered interval and tender offer funds can serve a broader investor base, including retail investors. Within these eligibility boundaries, investors' liquidity needs and investment horizons further shape vehicle choice: institutions able to commit capital for longer periods are better positioned to invest in PD funds, while investors seeking greater liquidity may prefer listed BDCs or funds offering periodic repurchases.
Overall, these features help explain the segmentation of private credit across vehicles. Regulatory constraints and investor liquidity needs jointly shape leverage and the capacity to hold illiquid assets, so observed balance sheet differences reflect not only investment strategies but also the institutional structure through which private credit is intermediated.
5. Conclusion
This note provides an overview of the institutional structure of the U.S. private credit market, describing the principal vehicles through which private credit is financed and held, and analyzing the composition of their balance sheets using newly published Financial Accounts data. This analysis complements our previous FEDS Note, “Introducing Private Credit into the Financial Accounts of the United States” (Brinkman et al., 2026).
We document significant differences in asset holdings, leverage, and investor bases across private debt funds, business development companies, interval and tender offer funds, and middle-market CLOs. Understanding this heterogeneity is essential for assessing how regulatory constraints interact with investor preferences to shape private credit vehicles’ balance sheets and investor bases. The data and analysis presented in this note provide a foundation for ongoing monitoring of this evolving market.
Data Appendix
This appendix describes our data sources and methodology.
A.1 Private debt funds
Limited public availability of data on PD fund balance sheets has constrained the ability of policymakers and market participants to assess these funds' asset vulnerabilities and funding resilience. To address this gap, we use confidential fund-level data from SEC Form PF.21 For advisers that meet the reporting requirements, filing is mandatory, meaning that coverage among larger funds is complete, and data on fund assets and liabilities are updated regularly. However, there are two major limitations: (1) Form PF does not explicitly identify PD funds, and (2) detailed balance sheet information is only available for a subset of funds in Form PF data.22
To address the first challenge, we reclassify all Form PF funds into one of nine fund types using signals from fund strategies, fund names, and classifications in other databases.23
- Fund Strategy Data: For a substantial share of funds—all funds filing as hedge funds since 2012 and the private equity funds of large private equity fund advisers since 2024—Form PF collects data on each of the fund's investment strategies and the share of the fund's total net asset value devoted to each strategy. We extract signals from these reported strategies when they clearly map to one of our fund types.
- Fund Name Data: Fund names also often reveal information about investment strategy. For instance, many funds include phrases such as "Direct Lending" or "Private Equity" in their names. We therefore create a list of keywords and phrases that strongly suggest a particular investment strategy and extract signals from fund names containing those terms.
- Classifications in Other Databases: External databases such as Preqin, PitchBook, and Moody's also contain information about fund investment strategies. We match funds in Form PF to these databases using both exact matches on cleaned versions of fund names and fuzzy matches. For each matched fund, we extract a signal from the fund type in the external database, giving higher priority to exact matches than to fuzzy matches in our ultimate classification.
We then use these signals to classify all funds in Form PF with at least one signal into one of the nine fund types.
For PD funds, we refine the classification further to identify the specific private debt strategy of the fund using a similar approach to the one used to classify fund types. We categorize each private debt fund as following one of five strategies: (1) senior direct lending, (2) subordinated direct lending, which includes mezzanine debt funds, distressed debt funds, and similar funds, (3) opportunistic, which includes opportunistic debt funds and special situations funds, (4) asset-based lending funds, which includes real estate debt funds, infrastructure debt funds, and other funds making loans against specific assets, and (5) other debt funds, which includes venture debt funds and other funds that do not belong in the first four categories.
In Figure A1, we present the results of this classification process for U.S.-domiciled funds as of 2025. As discussed above, we estimate that U.S.-domiciled private debt funds held approximately $940 billion in assets as of the end of 2025.24 For comparison, domestic private equity funds are the largest fund category, with almost $5.4 trillion in assets, while hedge funds are the second largest, at about $2.7 trillion in assets. The other remaining funds, which include real estate funds, infrastructure funds, venture capital funds, and liquidity funds, among others, account for about $3.3 trillion in assets.
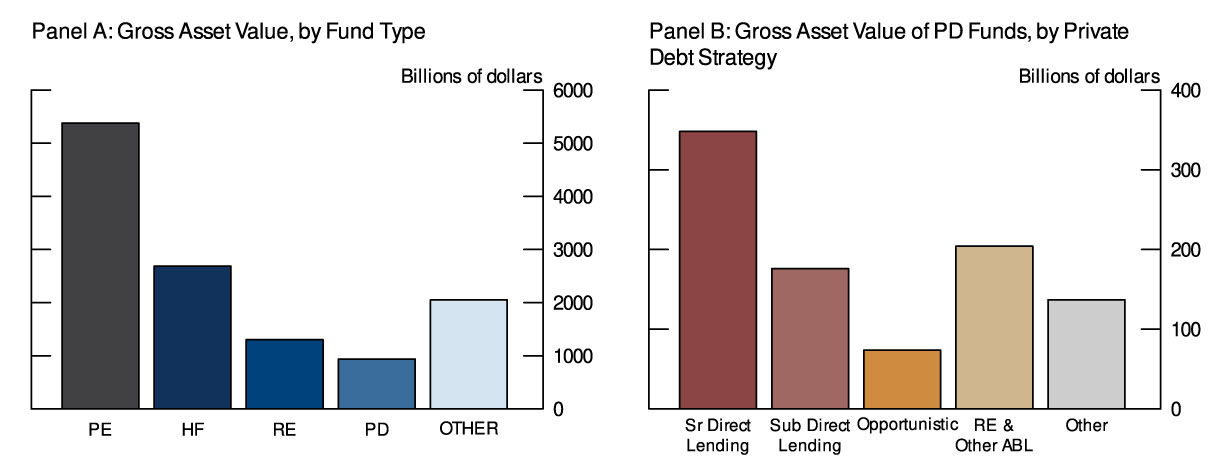
Note: The sample includes only U.S.-domiciled private funds reported on SEC Form PF. All figures exclude dry powder. For funds that report quarterly, we use the last available observation in each calendar year. Panel A shows gross asset value (GAV) by fund type under our new classification: private equity (PE), hedge funds (HF), real estate equity (RE), private debt (PD), and other funds (OTHER). PD includes real estate debt funds and infrastructure debt funds, as well as other private debt funds defined in the text. Real estate equity funds are classified as RE. OTHER includes infrastructure equity funds, venture capital funds, natural resources funds, collateralized loan obligations (CLOs), liquidity funds, and unclassified funds. Panel B breaks down the private debt funds identified in Panel A by strategy: senior direct lending (Sr Direct Lending), subordinated direct lending (Sub Direct Lending), opportunistic investing (Opportunistic), real estate debt funds and other asset-based lending (RE & Other ABL), and all other private debt strategies (Other).
Source: SEC Form PF.
Figure A1 also presents the total assets of domestic PD funds in Form PF for 2025 by debt strategy. Senior direct lending is the largest debt fund strategy, accounting for about $350 billion in assets in 2025. Subordinated direct lending accounted for about $180 billion while opportunistic debt funds controlled approximately $75 billion in assets. Real estate debt funds and other asset-based lending funds, like infrastructure debt funds, held just over $200 billion in assets, with real estate debt funds holding the large majority. Other private debt funds had slightly less than $140 billion in assets.
To address the second data challenge—the fact that detailed balance sheet data are only available for a subset of PD funds—we impute holdings based on funds that do report these data. Importantly, a significant number of PD funds, representing a substantial share of private debt fund assets, report as qualified hedge funds advised by large private fund advisers and are consequently required to report holdings across a wide variety of instruments on a quarterly basis.
Using these funds, we calculate the distribution of assets across different categories (e.g., loans, corporate equities) as a share of total assets for each quarter. We assume that funds with the same private debt strategy (e.g., senior direct lending) that do not report their asset holdings have the same distribution of assets. For these funds, therefore, the imputed asset holdings are calculated as the product of the fund's total assets and the asset ratio for funds with the same private debt strategy in the quarter.
A.2 Business development companies (BDCs)
For BDCs, we use data from BDC Collateral, which parses BDCs' quarterly financial reporting and schedules of investments from their 10-Qs and 10-Ks.
A.3 Interval and tender offer funds
For interval and tender offer funds, we use data from Morningstar and SEC Form N-PORT. Form N-PORT, an SEC filing requirement adopted in 2016 and implemented starting in 2019, requires registered investment companies to report portfolio holdings monthly, with public disclosure occurring quarterly, 60 days after each fiscal quarter-end.
To identify interval and tender offer funds investing in private credit, we begin with Morningstar's list of active and inactive interval and tender offer funds and match it to Form N-PORT filings using CIK and LEI identifiers. Using the detailed holdings data in Form N-PORT, we classify these funds' investments into private credit loans, corporate equity, debt securities, and other instruments.
A.4 Middle-market CLOs
To construct estimates of the outstanding value of private credit loans held by middle-market CLOs, we use data from Moody's Analytics, Inc., Global CLO database, which flags small and middle-market CLOs and includes information on CLO assets, performance of CLO tranches, and attributes of the loans underlying CLOs and the loan obligors.25
References
Avalos, Fernando, Sebastian Doerr, and Gabor Pinter. 2025. "The Global Drivers of Private Credit." BIS Quarterly Review, March 2025, pp. 13–29.
Banegas, Ayelen, Sophia Castelo, Ahmet Degerli, Christine Dobridge, and Will Kennedy. 2026. "Private Credit and Leveraged Loan Markets: Similarities, Differences, and Substitution." FEDS Notes.
Bank for International Settlements (BIS). 2024. "Laying a Robust Macro-Financial Foundation for the Future." BIS Annual Economic Report 2024, Chapter I. Basel: Bank for International Settlements.
Berg, Tobias, and Seung Jung Lee. 2026. "Measuring Counterparty Exposures to Private Credit." OFR Brief No. 26-02. Washington, DC: Office of Financial Research, U.S. Department of the Treasury.
Brinkman, Katie, Christine Dobridge, Tim Dore, Simon Glossner, Elizabeth Holmquist, Nam Nguyen, Maria Perozek, and Irina Stefanescu. 2026. "Introducing Private Credit into the Financial Accounts of the United States." FEDS Notes.
Chernenko, Sergey, Isil Erel, and Robert Prilmeier. 2022. "Why Do Firms Borrow Directly from Nonbanks?" Review of Financial Studies 35(11): 4902–4947.
Erel, Isil, Thomas Flanagan, and Michael S. Weisbach. 2024. "Risk-Adjusting the Returns to Private Debt Funds." Fisher College of Business Working Paper No. 2024-03-006, Charles A. Dice Center Working Paper No. 2024-06.
Haque, Sharjil, Simon Mayer, and Irina Stefanescu. 2026 (forthcoming). "Private Debt versus Bank Debt in Corporate Borrowing." Journal of Financial Economics.
Hinzen, Franz, Giorgio Mondini, Paul Rintamäki, and Sascha Steffen. 2026. "The Cyclicality of Direct Lending." SSRN Working Paper No. 6490423.
International Monetary Fund (IMF). 2024. "The Rise and Risks of Private Credit." Global Financial Stability Report: The Last Mile—Financial Vulnerabilities and Risks, Chapter 2. Washington, DC: International Monetary Fund, April 2024.
Ivashina, Victoria. 2025. "The Role of Private Debt in the Financial Ecosystem." NBER Working Paper No. 34426.
Meisenzahl, Ralf, Jackson Overpeck, and Andy Polacek. 2026. "Life Insurers' Private Credit Investments and Annuity Market Share Capture." Federal Reserve Bank of Chicago Working Paper No. 2025-09.
1. We are grateful to Daniel Barth, Mike Batty, Marco Cagetti, Fang Cai, Sophia Castelo, Ahmet Degerli, Giovanni Favara, Matt Hoops, Patrick McCabe, Phillip Monin, Lubomir Petrasek, and Clara Vega for helpful comments and suggestions. We also thank Keely Adjorlolo, Santoro Giuggio, Harrison Karp, and Patrick Schroeder for expertise and assistance with the private credit data. Return to text
2. This note provides complementary details on the integration of the private credit market into the Financial Accounts of the U.S., and it is centered around the private credit vehicles that provide loans to U.S. businesses. For more information, see our previous FEDS Note: "Introducing Private Credit into the Financial Accounts of the United States" (Brinkman et al., 2026). Return to text
3. Foreign-domiciled private credit vehicles that invest in the U.S. held an additional $763 billion in assets. Return to text
4. Our definition builds on the emphasis in recent BIS (2024) and IMF (2024) work on privately negotiated credit intermediated outside traditional banks and public securities markets, while adopting a broader scope with respect to borrower and collateral type. Similarly, Ivashina (2025) states that the appropriate boundary of private credit is determined by how lending is intermediated rather than by the identity of the borrower. Return to text
5. Private credit loans are related to, but distinct from, private placements. Both provide borrowers with financing outside public debt markets and can involve private negotiation and relatively concentrated investor participation. Private placements, however, generally involve the issuance of debt securities, most commonly notes or bonds, directly to a limited group of institutional investors. In the United States, insurance companies are important investors in traditional private placements and commonly hold these securities directly on their balance sheets (Meisenzahl, Overpeck, and Polacek, 2026). The distinction in this note therefore rests on both the form of the instrument and the intermediation structure. Private credit loans are loan instruments financed through nonbank investment vehicles, whereas traditional private placements are debt securities issued by borrowers directly to investors. We exclude privately placed bonds and notes held directly by institutional investors from our estimates of private credit vehicles. Return to text
6. Put differently, private credit encompasses a range of privately negotiated lending activities differentiated by borrower type, collateral, and contractual structure. They are unified by fund-based origination, private negotiation and monitoring, and limited reliance on public capital markets, all of which jointly determine risk, pricing, and control rights (Chernenko, Erel, and Prilmeier, 2022; Avalos, Doerr, and Pinter, 2025). Return to text
7. Middle-market firms are often defined as those with revenues between $10 million and $1 billion (Banegas et al., 2026). Return to text
8. See, for instance, Haque, Mayer, and Stefanescu (2026), Hinzen et al. (2026), and Banegas et al. (2026). Return to text
9. Large alternative-asset managers may operate several of these vehicles through a common origination platform. Loans sourced and underwritten by the same manager can therefore be allocated across affiliated PD funds, BDCs, interval or tender offer funds, and other vehicles, and may subsequently be financed through CLOs. It is therefore useful to distinguish the asset manager or origination platform from the individual legal vehicles through which the loans are financed and held. Return to text
10. Although the funds themselves are exempt from registration as investment companies, their investment advisers are typically registered with the U.S. Securities and Exchange Commission under the Investment Advisers Act of 1940 and are subject to applicable reporting, compliance, and fiduciary requirements. Return to text
11. BDCs are closed-end investment companies that elect to be BDCs under Section 2(a)(48) of the Investment Company Act of 1940. A BDC is subject to some but not to all of the limitations and prohibitions of the 1940 Act applicable to typical 1940 Act funds. Several key differences from the 1940 Act funds emerge: a BDC must invest its assets according to specific criteria set out in the 1940 Act that effectively require at least 70 percent of a BDC's total assets to be invested generally in securities acquired from "eligible portfolio companies," defined generally as non-investment companies that are domestic unlisted companies or certain small-cap companies. In addition, BDCs can charge incentive fees based on capital gains and income and must offer managerial assistance to portfolio companies. Return to text
12. When repurchase requests exceed the offered percentage, proration occurs, which can limit investor liquidity. Return to text
13. Both registered interval funds and registered tender offer funds share comprehensive regulatory obligations under the 1940 Act. These include enhanced disclosure through Form N-2 registration statements and Form N-PORT reporting of portfolio holdings, adherence to leverage limitations under Section 18 (generally restricting debt to 33 percent of total assets), and independent board oversight. Return to text
14. Including foreign PD funds and MM CLOs raises the total financial assets to $2.6 trillion. For more details, see our previous FEDS Note: "Introducing Private Credit into the Financial Accounts of the United States" (Brinkman et al., 2026). Return to text
15. Data for interval and tender offer funds begin 2021:Q4. Return to text
16. Consistent with these estimates, using PitchBook data on private debt fund holdings, Erel, Flanagan, and Weisbach (2024) also find that approximately 20 percent of invested capital is held in equity or equity-linked securities. Return to text
17. Prior to launching a CLO, banks commonly provide short-term or "warehouse" financing to CLOs to fund the acquisition of loans. In the Financial Accounts, CLO assets are measured after CLO launch and do not include warehouse loans. Return to text
18. Total debt is a subset of total liabilities, which is calculated as the difference between total assets and equity and includes other unidentified miscellaneous liabilities. Return to text
19. The debt-to-NAV ratios for PD funds, BDCs, and interval and tender offer funds are winsorized at 0.05 and 0.95 levels. Return to text
20. Berg and Lee (2026) also find that leverage is more concentrated in the upper tail, although their study also includes non-U.S.-domiciled PD funds. Their analysis shows that the 95th percentile PD fund has gross-assets-to-net-assets leverage of 3.58 (equivalent to an implied debt-to-equity ratio of approximately 2.58) and that most funds in this highly levered group are relatively small, with just a few exceptions. Return to text
21. Adopted in 2011 as part of the Dodd-Frank Wall Street Reform and Consumer Protection Act of 2010, Form PF collects fund-level data from investment advisers registered with the SEC who manage at least $150 million in private fund assets. Smaller advisers do not file Form PF and are not currently included in our estimates. However, we estimate that including private debt funds that file Form ADV but not Form PF does not materially impact our estimates. Return to text
22. The need to reclassify Form PF funds by type is also recognized and discussed in Berg and Lee (2026). Return to text
23. The nine types are: (1) private debt, (2) hedge fund, (3) private equity, (4) venture capital, (5) infrastructure, (6) collateralized loan obligations (CLOs), (7) real estate, (8) liquidity, and (9) natural resources. Note that funds that make equity investments in real estate and infrastructure projects are classified as real estate and infrastructure funds, while funds that invest in loans and other debt investments that finance these projects are classified as private debt funds. Return to text
24. Our measure of assets excludes dry powder, which is capital committed to the fund but not yet drawn down. Dry powder calculated as the difference between gross assets and the value of the fund's assets. In cases where the value of fund assets is not reported, it is estimated as the difference between gross assets and the sum of net assets and total borrowings. Return to text
25. The Moody's Global CLO database is the most comprehensive data source currently available to the Federal Reserve Board for information on middle-market CLOs, however, this dataset may undercount total MM CLO volumes. Return to text
Brinkman, Katie, Christine Dobridge, Tim Dore, Simon Glossner, Elizabeth Holmquist, Nam Nguyen, Maria Perozek, and Irina Stefanescu (2026). "U.S. Private Credit Vehicles: Institutional Structure and Aggregate Balance Sheets," FEDS Notes. Washington: Board of Governors of the Federal Reserve System, November 09, 2026, https://doi.org/10.17016/2380-7172.4225.
Disclaimer: FEDS Notes are articles in which Board staff offer their own views and present analysis on a range of topics in economics and finance. These articles are shorter and less technically oriented than FEDS Working Papers and IFDP papers.