FEDS Notes
June 03, 2022
Understanding Bank Deposit Growth during the COVID-19 Pandemic
Andrew Castro, Michele Cavallo, and Rebecca Zarutskie1
A notable development in the U.S. banking system following the onset of the COVID-19 pandemic has been the rapid and sustained growth in aggregate bank deposits. Total deposits at domestic commercial banks rose by more than 35 percent since the end of 2019 and stood at around $18 trillion as of the fourth quarter of 2021 (Figure 1).2 This rise in aggregate deposits is outsized compared to any period in recent history. As shown in Figure 2, the year-over-year percentage change in deposits since the first quarter of 2020 has exceeded any of those witnessed over the past 30 years. While the growth in deposits was largest in the first half of 2020 and exceeded 20 percent at an annual rate for several quarters, it continued to be above historical norms into the second half of 2021.
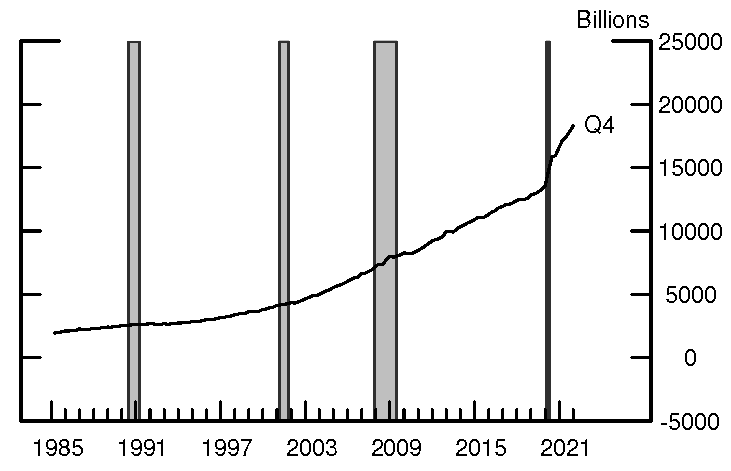
Note: Shaded areas indicate recessions as defined by the NBER.
Source: Federal Reserve Board Staff calculations; Consolidated Reports of Condition and Income, FFIEC 031/041/051.
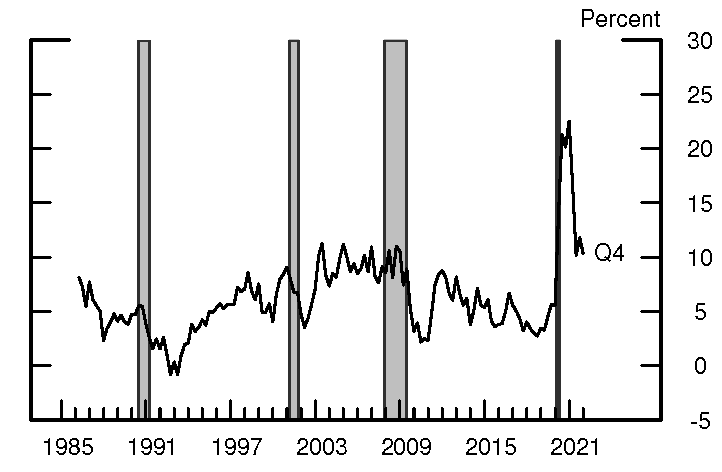
Note: Shaded areas indicate recessions as defined by the NBER.
Source: Federal Reserve Board Staff calculations; Consolidated Reports of Condition and Income, FFIEC 031/041/051.
In this note, we present evidence that four factors can largely explain the growth in bank deposits over the two year period 2019:Q4 to 2021:Q4: 1) the initial spike in commercial and industrial (C&I) credit line drawdowns at the onset of the pandemic; 2) asset purchases by the Federal Reserve; 3) large fiscal transfers to households more likely to hold savings in the form of deposits; and 4) a higher personal savings rate.
What Factors Drove Deposit Growth during the Pandemic?
From the late 1970s to 2000, bank deposits tended to grow at a somewhat slower pace than that of nominal GDP. As shown in Figure 3, the ratio of commercial bank deposits to nominal GDP (the black line) hovered around 40 percent from the mid-1970s to the early-1990s, before declining to around 35 percent by 2000, reflecting a trend for commercial banks to fund their growth in loans and securities holdings through other types of liabilities in addition to deposits during that time. In the years leading up to the Great Financial Crisis (GFC), concurrently with an increase in the ratio of bank credit to GDP (the dashed red line), the ratio of deposits to nominal GDP then steadily increased to around 50 percent.3 In the period following the GFC, the deposits-to-GDP ratio further increased to around 60 percent, reflecting, in part an expansion of banks' balance sheets given the expansion of both reserves and credit in the banking system as well as a desire by banks, in light of the new liquidity regulations, to hold more stable forms of funding, including deposit funding. Following the onset of the COVID-19 pandemic in 2020, the deposits-to-GDP ratio jumped to over 75 percent and has remained near that level during the pandemic period to date.4
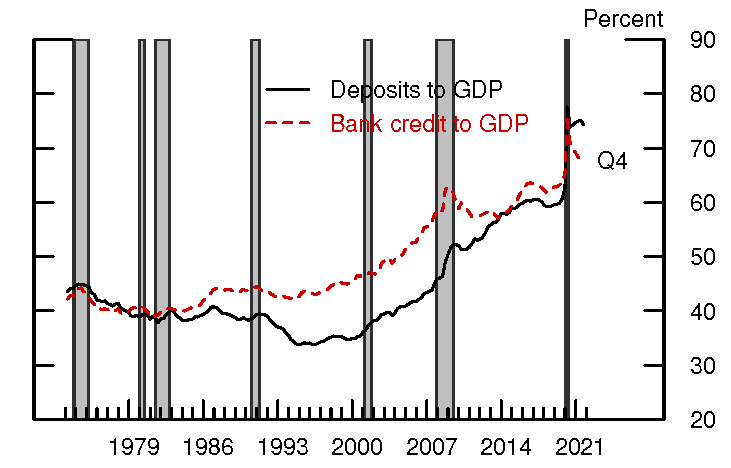
Note: Shaded areas indicate recessions as defined by the NBER. Bank credit includes loans and leases as well as securities holding by commercial banks.
Source: H.8 statistical release, Federal Reserve Board; Bureau of Economic Analysis
The Roles of Credit Line Draws and the Federal Reserve's Asset Purchases
Early in the pandemic period, two key factors—the Federal Reserve's policy response to poor market functioning in key securities markets and a spike in commercial and industrial (C&I) credit line drawdowns at banks—contributed to the initial spike in bank deposits. At the onset of the global pandemic in March 2020, the Federal Reserve began to purchase Treasury securities and MBS to support the functioning of financial markets that were exhibiting stress during that time.5 The asset purchases by the Federal Reserve led to the creation of reserves in the banking system, and, to the extent that the Federal Reserve purchased the assets from nonbank entities, they also led to the creation of deposits. At the same time, nonfinancial firms which had established credit lines with banks began to draw on those lines to build cash buffers on their balance sheets. As a result, in the second quarter of 2020 banks' balance sheets saw an unprecedented increase of nearly 90 percent on an annual basis in commercial and industrial (C&I) loans.6 The counterpart of the drawdown in C&I credit lines was the creation of deposits.7 Later in the pandemic period two additional factors—large fiscal stimulus measures and a higher personal savings rate—combined with the Federal Reserve's continued asset purchases to support market functioning and foster accommodative financial conditions contributed to a sustained growth in deposits.
One question is to what extent deposit growth during the pandemic can be directly accounted for by reserves growth due to the Federal Reserve's asset purchases.8 In Figure 4a, we plot the cumulative change in aggregate reserves at domestic commercial banks vis-à-vis the cumulative change in aggregate bank deposits starting in 2019:Q4 (pre-pandemic) for each subsequent quarter until 2021:Q4. The dashed gray line plots the 45-degree line, or the path along which the cumulative increase in reserves denoted on the x-axis would have equaled the cumulative increase in deposits denoted on the y-axis. A line with a flatter slope than the 45-degree line indicates that cumulative deposit growth has outpaced cumulative growth in reserves. As shown in Figure 4a, deposit growth far outstripped reserves growth stemming from the Federal Reserve's asset purchases during the pandemic. In particular, at the beginning of the pandemic (depicted by the dots corresponding to 2020:Q1 and 2020:Q2) cumulative deposit growth far exceeded the cumulative growth in reserves, with cumulative deposits rising by around $2.5 trillion by 2020:Q2 and cumulative reserves increasing by a smaller $1 trillion. Taking a longer perspective, as of 2021:Q4 cumulative growth in aggregate deposits was over $4.5 trillion, whereas cumulative growth in reserves was just under $2 trillion.9,10
In Figure 4b, we also look at the cumulative growth of loans and securities holdings at banks, which are the two largest categories on the assets side of banks' balance sheets. We add to the plot already shown in Figure 4a the cumulative changes in aggregate loans and leases and aggregate securities holdings at domestic banks with both these changes measured vis-à-vis the cumulative change in aggregate bank deposits (the blue line with diamonds and the red line with triangles). We also plot the cumulative growth in the sum of all three assets categories—reserves, loans and leases, and securities—shown by the solid gray line with squares. As can be seen from Figure 4b, at the start of the pandemic in 2020:Q1, loan growth can account for most of the portion of deposit growth not accounted for by growth in reserves, with cumulative growth in aggregate loans and reserves both at around $500 billion and cumulative growth in deposits just over $1 trillion. This is consistent with the idea that deposit growth very early in the pandemic reflected, in part, the initial dash for cash by firms which drew on their bank lines of credit.11 However, in subsequent quarters, beginning in 2020:Q2, cumulative growth in loans leveled off before slightly declining, reflecting the fact that, as corporate bond markets returned to a more normal functioning, firms began to pay back what they had borrowed earlier through credit lines at commercial banks.12 As the pandemic continued and loan growth retraced, deposit growth continued to outpace the growth in reserves while banks increased their holdings of securities, as shown by the red line with triangles in Figure 4b, adding agency MBS and Treasury securities to their balance sheets. Overall, as shown by the solid gray line, total cumulative growth in reserves, securities, and loans and leases on banks' balance sheets comes close to accounting for the cumulative growth in deposits over the pandemic.13

Fig 4a. Note: Period covered is 2019:Q4 to 2021:Q4. The dashed, gray line is where the change in deposits equals the change in reserves.
Source: Federal Reserve Board Staff calculations; Consolidated Reports of Condition and Income, FFIEC 031/041/051.
Fig 4b. Note: Period covered is 2019:Q4 to 2021:Q4. The dashed, gray line is where the change in deposits equals the change in the selected asset.
Source: Federal Reserve Board Staff calculations; Consolidated Reports of Condition and Income, FFIEC 031/041/051.
The quantitative difference between the extraordinary growth in aggregate deposits during the pandemic and the strong but lower growth in reserves shown in Figure 4a stands in contrast to what was witnessed during the three previous rounds of quantitative easing (QE) in which the Federal Reserve purchased Treasury securities and agency MBS following the GFC. In Figure 5, we plot the cumulative change in domestic bank reserves vis-à-vis the cumulative change in domestic bank deposits during the three rounds of QE between 2008 and 2013. Two facts emerge from this figure: First, in each round of QE, cumulative growth in both deposits and reserves were both much smaller than during the pandemic. Second, deposit growth did not outpace the growth in reserves to the same extent that it has done during the pandemic; in fact, during the earlier rounds of QE1 and QE3 reserves growth exceeded deposits growth. This pattern is consistent with the idea that at that time QE created deposits which then left the banking system more quickly than they have done during the more recent pandemic asset purchase program. This idea contends that investors during the previous three rounds of QE, as they received the deposits associated with the purchase of securities by the Federal Reserve, may have subsequently either moved those deposits out of the banking system to alternative savings vehicles such as money market mutual funds (MMFs) or spent those deposits in a way such that those deposits left the banking system, as we describe in the Appendix. In addition, the more subdued pace of deposit growth during the previous rounds of QE is consistent with the slower extension of loans and the smaller purchases of securities by banks.
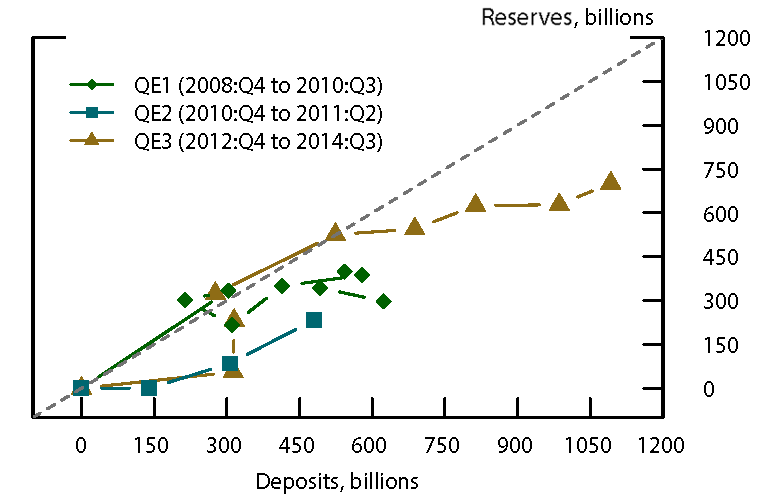
Note: The dashed, gray line is where the change in deposits equals the change in reserves.
Source: Federal Reserve Board Staff calculations; Consolidated Reports of Condition and Income, FFIEC 031/041/051.
The Roles of Fiscal Stimulus and the Household Savings
In the second half of 2020 and in 2021, banks rapidly expanded their holdings of both U.S. Treasury securities and agency and GSE-backed securities, with the latter consisting primarily of mortgage-backed securities (MBS), as reflected by the red line in Figure 4b. During that period, the U.S. government issued a large amount of securities to fund fiscal stimulus measures passed in response to the pandemic. Banks, in addition to the Federal Reserve and other investors, purchased a large share of those securities. Table 1A shows that during 2020 and 2021, banks, together with money market funds and state and local governments, absorbed a significant portion of the increased net issuance of U.S. marketable Treasury securities that was not purchased by the Federal Reserve (shown as Monetary Authority in the Financial Accounts data source).14 The amount of marketable Treasury securities outstanding increased by nearly $6 trillion or 35 percent, with banks collectively increasing their holdings by $776 billion. Banks grew their holdings of agency securities and GSE-backed MBS by an even greater amount than their Treasury securities holdings. As shown in Table 1B banks acquired $1.3 trillion of MBS during 2020 and 2021, about the same amount as the Federal Reserve. The table also shows that banks and the Federal Reserve together absorbed on their balance sheets more than $2.5 trillion of agency and GSE-backed securities, an amount which is more than twice the $1.2 trillion of net issuance of these securities during 2020 and 2021.
Table 1A: Net Purchases of Marketable Treasury securities (2020-2021)
| Billions of Dollars | % Contribution to Total | |
|---|---|---|
| Banks | 775.6 | 13.1 |
| Households | -743 | -11.2 |
| MMF | 692 | 11.7 |
| Monetary Authority | 3497.4 | 59 |
| Pension Funds | 267 | 4.5 |
| Rest of World | 477.7 | 8.1 |
| State/Local Govt. | 652.4 | 11 |
| Others | 309.4 | 3.9 |
| Total (Net Issuance) | 5928.5 | 100 |
Source: Financial Accounts of the U.S. - Z.1
Table 1B: Net Purchases of Agency and GSE-Backed Securities (2020-2021)
| Billions of Dollars | % Contribution to Total | |
|---|---|---|
| Banks | 1304.3 | 105.5 |
| Brokers and Dealers | -121.5 | -9.8 |
| Households | -385 | -31.1 |
| MMF | -418.4 | -33.8 |
| Monetary Authority | 1238.7 | 100.2 |
| Mortgage REITs | -170.5 | -13.8 |
| Rest of World | -81.6 | -6.6 |
| State/Local Govt. | -104.1 | -8.4 |
| Others | -25.3 | -2 |
| Total (Net Issuance) | 1236.6 | 100 |
Source: Financial Accounts of the U.S. - Z.1
A final factor that contributed to the rapid and sustained growth in deposits during the pandemic was the historically high savings rate. In April 2020, the personal savings rate skyrocketed from around 8 percent to nearly 35 percent, as households cut their consumption expenditures.15 Given the greater economic uncertainty, households—especially those with greater labor income uncertainty—as well as businesses were more likely to keep their savings in very liquid bank deposits rather than move their savings to illiquid assets, some of which would have then moved outside the banking system.
In addition to the personal savings rate moving higher, the federal government began making stimulus payments to households in 2020 and 2021 through direct payments, extended unemployment supplementary payments, and augmented the child tax credit through legislation such as the CARES Act and the American Rescue Plan, which raised the incomes of many households. Likewise, through the paycheck protection program (PPP), the federal government made loans directly to small businesses that would be forgiven if those firms spent a certain portion of the funds on wages of employees. Moreover, many households were able to defer payments on mortgages and other debt during the pandemic period, which enabled them to keep more of their wages and stimulus payments as savings.
As the stimulus payments were made, a wide swath of households across the economy received boosts to their deposit accounts. This pattern can be observed in Figure 6 in which retail, or household, deposits, shown by the dashed red line, rose more quickly relative to non-retail deposits beginning in the second half of 2020 and early 2021.16 In further support of the idea that fiscal stimulus payments contributed to deposit growth, Figure 7 shows that the growth in deposits was broad-based, as it was widely spread over all types of banks—especially later in the pandemic period when stimulus payments were made—including the largest GSIBs as well as smaller regional and community banks. In addition, stimulus payments were made to households in many different geographic areas and banking markets, finding their way to the deposit accounts of small and large banks, alike.

Note: Shaded areas indicate recessions as defined by the NBER. Values are indexed to 1 in 2019:Q4.
Source: Federal Reserve Board Staff calculations; Consolidated Reports of Condition and Income, FFIEC 031/041/051.
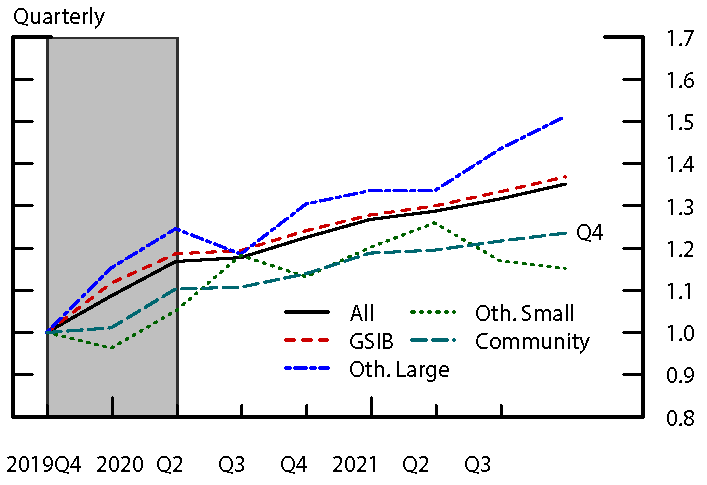
Note: Shaded areas indicate recessions as de fined by the NBER. Values are indexed to 1 in 2019:Q4. GSIB is de fined as the 6 largest BHCs, Other Large are non-GSIBs above $100 billion in total assets, Other Small have $10-$100 billion in total assets, and Community have less than $10 billion.
Source: Federal Reserve Board Staff calculations; Consolidated Reports of Condition and Income, FFIEC 031/041/051.
Data from the U.S. Financial Accounts, shown in Table 2 broadly confirm the evidence provided in Figure 6. Specifically, household deposit balances at banks (the sum of checkable, time, and savings deposits) rose by substantially more than deposits held by nonfinancial businesses between 2019:Q4 and 2021:Q4, accounting for nearly two-thirds of the overall increase in aggregate deposits.
Table 2: Deposit Balances at Banks (2019:Q4 - 2021:Q4)
| Change (Billions of $) | Contr. to % change (percent) | |
|---|---|---|
| Households | 3819.7 | 24.6 |
| Nonfin. Bus. | 1322.4 | 8.5 |
| Rest of World | 149 | 1 |
| Others | 161.5 | 1 |
| Total | 5452.7 | 35.1 |
Source: Financial Accounts of the U.S. - Z.1
Overall, the evidence we present supports the idea that the unprecedented increase in deposits at U.S. commercial banks can be explained in part by fiscal stimulus that channeled deposits to households and businesses who kept the deposits as savings within the banking system or spent those deposits in a manner such that they stayed in the U.S. banking system. During the pandemic period, the U.S. Treasury received funding from investing institutions and households through the issuance of Treasury securities and then subsequently made cash payments to other households and businesses with a comparatively higher propensity to hold those amounts as deposits within the U.S. banking system. The Federal Reserve's asset purchases also led to deposit creation as did the loans and securities purchases made by banks.
Conclusion
As of the time of writing, deposits as a ratio to GDP stand at a historically high level, with deposits having sustained a rapid pace of growth since the onset of the COVID-19 pandemic. This note documents that this unprecedented growth in deposits was driven in large part by four factors: 1) a rapid drawdown in C&I lines of credit by firms seeking precautionary liquidity at the onset of the pandemic; 2) the Federal Reserve's asset purchases; 3) fiscal stimulus that increased the incomes of many households; and 4) a higher personal savings rate, especially among households likely to hold their savings in liquid bank deposits.
Reflecting these developments, banks remain flush with deposit funding. Macroeconomic trends, however, suggest a few reasons to expect that, going forward, deposits will decline as a share of banks' funding and of household savings as the economic expansion continues and as interest rates rise. Households may spend down the large level of accumulated deposits, further fueling economic growth and loan demand. In fact, in recent months the personal savings rate has been declining, which could foreshadow a slowdown in deposit growth at banks. Furthermore, as households spend their accumulated deposit savings, some of those deposits could eventually leave the banking system; for example, corporations may move some of the deposits they receive from higher consumer spending outside of the banking system. As interest rates rise, households and other depositors may move their deposits to higher yielding MMFs. Macroeconomic trends could also see a pickup in loan demand, and banks' may be generally well positioned to fund loans should demand for credit increase given their holdings of liquid securities and high reserve balances. Such a pickup in loan growth would serve to grow banks' deposits. However, higher consumption by households from their accumulated deposits could also affect banks' decisions regarding how to fund such loan growth as retail deposit account balances decline. Banks may have an incentive to raise interest rates paid on certain deposit accounts or seek to raise funding elsewhere to fund loan growth if the owners of deposit accounts begin to spend their balances down rapidly or move them to higher-yielding MMFs. Banks' incentives to raise interest rates on deposit accounts could also be further magnified as interest rates rise due to the removal of monetary policy accommodation. Additionally, a reduction in the Federal Reserve's securities holdings would drain reserves and deposits from the banking system and may also prompt some banks to raise interest rates paid on certain types of deposit accounts or cause banks to seek to attract additional forms of non-deposit funding.
Appendix: Deposit Creation by Federal Reserve Asset Purchases and Commercial Bank Lending
Actions by commercial banks and the Federal Reserve affect the total amount of deposits in the banking system. In this appendix we discuss the mechanisms through which deposits are created and what determines when those deposits leave the banking system.
When the Federal Reserve purchases securities from a nonbank seller, it creates new bank deposits by crediting the reserve account of the depository institution at which the nonbank seller has an account, and then the depository institution credits the deposit account of the nonbank seller. If the Federal Reserve buys the security from a bank, no new bank deposits are created. While reserves are created in this case, the size of the bank's balance sheets does not increase because the value of the security is swapped with an equivalent dollar value of reserves on the assets side of the bank's balance sheet. In contrast, purchases of securities from the nonbank private sector will increase the size of a bank's balance sheet, by creating both reserves on the assets side and deposits on the liabilities side.
When banks make loans to nonbanks or buy assets, such as marketable securities, from nonbanks they create new bank deposits by transferring the loan or payment amount to the borrower or security seller. That amount then shows up as a deposit in the borrower's or security seller's bank account. Banks can also purchase securities domestically from households, nonbank financial entities, and the government. When banks purchase securities from households and nonbanks, aggregate deposits directly increase by the amount corresponding to the value of the securities associated with the transaction. In this situation, once a bank purchases securities either from a household or a nonbank entity, the bank moves a corresponding amount of reserve balances to the reserves account of the bank at which the household or the nonbank holds the deposit account. Thus, the purchasing bank experiences a change in the composition of its portfolio, having more securities and less reserves. With regards to the receiving bank (i.e., the bank at which the seller of the securities holds its deposit account), it receives more reserves, and, at the same time, it credits the deposit account of the seller of the security. Thus, the aggregate level of reserve balances does not change. What changes is the distribution of reserves among banks. Ultimately, the purchasing bank has fewer reserves and more securities. The seller of the securities has more deposits and less securities, and the bank of the seller has more reserves but more deposits as liability.17
When a bank purchases securities directly from the government, the bank pays by drawing down the balance on its reserves account at the central bank by an amount corresponding to the value of the securities. Meanwhile, the same amount is credited to the account that the Treasury holds at the Federal Reserve, that is, the Treasury General Account (TGA). Thus, after this first round of transactions, the size of the bank's balance sheet has remained the same, but its composition of its assets has changed, as the bank holds more securities and less reserves. Once the government makes payments or provides fiscal stimulus using the funds financed by the sales of the securities, the central bank draws down the TGA by the amount of the stimulus and then credits by the same amount the reserves accounts of the banks at which the beneficiaries of the stimulus payments hold their deposit accounts. Thus, once government disburses the funds received from the securities sales, the balance of the TGA goes back to its initial level, and aggregate level of reserve balances in the banking system again rises. But, after the reserve accounts of the banks at which the stimulus recipients hold their deposit accounts have been credited, the banks then credit by corresponding amounts those same deposit accounts. Therefore, all in all, the aggregate level of reserves has remained the same as it was before the banks purchased the securities and only its distribution across banks might have changed. But the size of the aggregate banking sector's balance sheet has become larger. Ultimately, banks hold more securities in their portfolio and the counterpart of this is higher aggregate deposit balances.
Whether deposits stay in the banking system depends on the behavior of the firms and households who received those deposits. Newly created deposits might stay within the banking system if they are used to purchase something else—either a consumption good, an investment good, or a security—which ultimately results in the deposits being sent to the bank accounts of households, businesses, or nonbank financial institutions at the other side of the purchase transaction. On the other hand, the deposits may leave the banking system if the holder of the deposits exchanges them for a different bank liability, such as longer-term bank debt, or if the deposits are used either to buy shares in a money market mutual fund, which then uses those deposits to buy alternative bank liabilities or Treasury securities directly from the U.S. Treasury department, or to invest them in the Federal Reserve's Overnight Reverse Repurchase (ON RRP) facility.18 Deposits may also leave the U.S. banking system if payments are made to foreign entities and deposits move to the non-U.S. banking systems, or if borrowers pay down their bank loans. As such, while certain actions by commercial banks and the Federal Reserve may increase the amount of deposit balances in the banking system initially, over time it is the decisions on how to spend or invest those deposits by households, businesses, and the government that determine whether those deposits stay in the U.S. banking system.
References
Glancy, David, Max Gross, and Felicia Ionescu (2020). "How Did Banks Fund C&I Drawdowns at the Onset of the COVID-19 Crisis?" FEDS Notes. Washington: Board of Governors of the Federal Reserve System, July 31, 2020.
Kapan, Tumer, and Camelia Minoiu (2020), "Liquidity Insurance vs. Credit Provision: Evidence from the Covid-19 Crisis," working paper.
Levine, Ross, Chen Lin, Mingzhu Tai, Wensi Xie, "How Did Depositors Respond to COVID-19?", Review of Financial Studies, Volume 34, Issue 11, November 2021, Pages 5438–5473.
Li, Lei, Philip E. Strahan, and Song Zhang. (2020). "Banks as Lenders of First Resort: Evidence from the COVID-19 crisis." Review of Corporate Finance Studies 9.3, pp. 472-500.
1. Federal Reserve Board, Division of Monetary Affairs. The analysis and conclusions are those of the authors and do not necessarily reflect the views of the Board of Governors of the Federal Reserve System of other members of its staff. We thank Mike Batty, Marco Cagetti, Rochelle Edge, and Min Wei for useful comments and suggestions. Return to text
2. Bank deposits are a specific liability of banks as well as a form of money and are included in the definition of monetary aggregates as reported in the Federal Reserve's H.6 statistical release. In this note, bank deposits include all transaction and non-transaction deposit accounts, generally corresponding to the line item "Total Deposits in domestic offices" in Schedule RC-E in the Call Reports (FFIEC 031/041). This broad definition includes all savings deposit accounts and time deposits, as well as demand deposit accounts. Return to text
3. Bank credit includes loans and leases as well as securities holdings of commercial banks. Securities holdings are primarily comprised of Treasury securities and agency MBS. For more information see the H.8 statistical release. Return to text
4. The ratio of bank credit to nominal GDP also spiked to around 75 percent at the onset of the pandemic as firms drew down their credit lines with banks to build their liquidity buffers, but subsequently retraced as firms repaid those loans as financial market functioning returned to pre-pandemic levels. As a result. the deposits-to-GDP ratio stood 10 percentage points higher than the bank credit-to-GDP ratio, the widest gap recorded in the time series. Return to text
5. In coordination with the Treasury Department, the Federal Reserve also established several emergency lending facilities to support functioning in other markets, such as commercial paper, corporate bond, and municipal bond markets. For a more complete listing and description of these actions, see https://www.federalreserve.gov/funding-credit-liquidity-and-loan-facilities.htm Return to text
6. See https://www.federalreserve.gov/releases/h8/current/default.htm as well as Kapan and Minoiu (2020) and Li, Strahan, and Zhang (2020). Return to text
7. The Appendix reviews in more detail how both Federal Reserve securities purchases and bank lending can add to the level of deposits in the banking system. Return to text
8. Deposits initially created by the Federal Reserve's asset purchases need not stay in the banking system as explained in the Appendix. Moreover, deposits can continue to grow as banks lend or purchase securities. As such, our calculations show to what extent reserves growth was matched by deposits growth. Return to text
9. The cumulative growth in reserves depicted in Figure 4a is a less than aggregate cumulative reserve growth because the underlying sample excludes U.S. branches and agencies of foreign banks as well as thrifts and credit unions. Return to text
10. The aggregate level of reserves can also fluctuate through changes in the Treasury General Account (TGA), take-up in the Overnight Reverse Repurchase Facility (ON RRP), or with changes in other non-reserve liability items on the Federal Reserve's balance sheet. However, since the start of the pandemic, the largest driver of reserves has been the Federal Reserve's purchases of Treasury securities and MBS. See https://www.federalreserve.gov/releases/h41/. Return to text
11. Many firms kept some of these draws as precautionary savings within the banking system and generally these credit line draws were matched by increases in aggregate bank deposits, although, as discussed by Glancy, Gross, and Ionescu (2020), there was heterogeneity in the degree by which C&I loan draws were funded by deposits at individual banks in the first quarter of 2020. Return to text
12. The generally weak level of demand for loans, combined with generally tighter lending standards at banks also contributed to the weak loan growth in later quarters of the pandemic. See, for example, the results of the October 2020, January 2021, April 2021, and July 2021 Senior Loan Officer Opinion Surveys at https://www.federalreserve.gov/data/sloos.htm. Return to text
13. The remaining gap between the gray line and the 45-degree line can be primarily explained by banks reducing other types of liabilities, such as Federal Home Loan Bank advances and other types of short-term debt, on their balance sheets. Increase in other assets, such as trading asset, also have played a role. Return to text
14. In Table 1A, from net purchases (and net issuance) of Treasury securities in the Financial Accounts of the U.S., we have removed the amounts relative to nonmarketable Treasury securities. Moreover, from the line item corresponding to net purchases by households we have excluded net purchases by domestic hedge funds, which are instead included in the "Others" line item. Net purchases of Treasury securities by domestic hedge funds in 2021:Q4 are estimated by projecting off of net purchases in 2021:Q3 the average change in net purchases registered between 2021:Q1 and 2021:Q3. Return to text
15. Levine, Lin, Tai, and Zhe (2020) present evidence that the cross-sectional variation in bank deposit inflows at the onset of the pandemic in 2020 was due in part to differences in precautionary savings by households at different levels of unemployment risk. See the Appendix for a discussion of the how deposits may be created in the banking system and also leave the banking system. Return to text
16. Non-retail deposits growth has also been strong during the pandemic consistent with the creation of deposits from the Federal Reserve's asset purchases as nonoperational deposits as well as the growth in firms' operational and nonoperational deposit accounts during the pandemic through their normal business activities. Return to text
17. If banks make loans to or buy securities from other banks, no new deposits are created. Rather, the lending bank gives reserves to the borrowing or selling bank and receives in return a loan or a security which it books as an asset. The borrowing or selling bank will receive additional cash or reserves. In the case in which a bank borrows from another bank, the borrowing bank will also book a loan due to the lending bank as a liability. Return to text
18. In the latter two instances, the deposits leave the commercial banking system and are placed directly with the Federal Reserve through the Treasury General Account (TGA) or through the ON RRP and, consequently, reserve balances in the banking system fall by a corresponding amount. Deposits may also leave the banking system if the depositor withdraws those deposits as currency or cash which is then used for subsequent payments outside the banking system. Of course, the cash may eventually return to the banking system as deposits if the holder places them back in a bank account. Return to text
Castro, Andrew, Michele Cavallo, and Rebecca Zarutskie (2022). "Understanding Bank Deposit Growth during the COVID-19 Pandemic," FEDS Notes. Washington: Board of Governors of the Federal Reserve System, June 06, 2022, https://doi.org/10.17016/2380-7172.3133.
Disclaimer: FEDS Notes are articles in which Board staff offer their own views and present analysis on a range of topics in economics and finance. These articles are shorter and less technically oriented than FEDS Working Papers and IFDP papers.