FEDS Notes
April 16, 2021
Uptake of the Main Street Lending Program1
Falk Bräuning and Teodora Paligorova
Purpose and Structure
The Main Street Lending Program (Main Street) was one of several new credit facilities launched by the Federal Reserve and the U.S. Department of the Treasury (Treasury) in response to the COVID-19 pandemic. The Federal Reserve published draft terms for Main Street on April 9, 2020, and the program started purchasing loan participations on July 6, 2020, with the goal of supporting lending to a wide range of small and medium-sized businesses that were in sound financial condition before the onset of the COVID-19 pandemic. When the program’s draft terms were first circulated, pandemic-related closures were taking hold throughout the economy, firms were sharply drawing down their existing credit lines, and credit market conditions were extremely tight. Against this backdrop, Main Street was intended to support the flow of credit to small and, especially, medium-sized firms and nonprofit organizations, as such entities were often too large to benefit from the Paycheck Protection Program (PPP) and too small to benefit directly from Federal Reserve facilities supporting the corporate bond and commercial paper markets.
Table 1. Key Main Street For-Profit Facility Loan Terms (Latest Terms)
| Characteristics of Main Street For-Profit Business Loan Types | |||
|---|---|---|---|
| New Loan Facility | Priority Loan Facility | Expanded Loan Facility | |
| Loan Term | 5% | ||
| Principal Payments | Principal deferred for two years. Years 3-5: 15%, 15%,70% | ||
| Interest Payments | Deferred for one year | ||
| Interest Rate | LIBOR + 3% | ||
| Loan Size | $100,000 to $35 million | $100,000 to $50 million | $10 million to $300 million |
| Maximum Combined Debt to Adjusted 2019 EBITDA | 4 times | 6 times | 6 times |
| Lender Participation Rate | 5% | ||
| Fed Participation Rate | 95% | ||
| Prepayment Allowed | Yes, without penalty | ||
| Business Size Limits | 15,000 employees or fewer, or 2019 revenues of $5 billion or less | ||
| Fees | Origination and transaction fees may apply | ||
Table 1 presents key term-sheet parameters of Main Street loans targeted at for-profit businesses.2 Main Street loans were available to borrowers with up to 15,000 employees or $5 billion in revenue. A range of loan types were available, with secured or unsecured “new loans” of as much as $35 million available for borrowers with an adjusted debt-to-EBITDA ratio (leverage ratio) as high as 4 (inclusive of the Main Street loan); “priority loans” or “expanded loans” were available to borrowers with an adjusted debt-to-EBITDA ratio as high as 6, in amounts of as much as $50 million or $300 million, respectively, with more stringent security requirements associated with these loan types.3 All facilities had an interest rate of LIBOR plus 300 basis points (bps) and a maturity of five years, as well as deferral of principal payments until the end of the third year and interest payments for one year, respectively. Moreover, all facilities required the lender, which collected an origination fee and loan servicing fees, to retain 5 percent of the loan balance, with the Main Street special purpose vehicle (SPV) purchasing the remaining 95 percent at par. The rationale for requiring banks to retain a portion of the loan balance on their balance sheets is to establish some “skin in the game” and incentivize prudent underwriting and ongoing monitoring of loans while at the same time sufficiently fostering loan origination during highly uncertain times and minimizing the impact on bank capital and balance sheets more broadly.
Activity in Main Street
The volume of accepted loan submissions rose at a steady pace following Main Street’s operational launch in July 2020, but it accelerated rapidly in December as borrowers and lenders sought loan participations before the estimated December 14 submission deadline for the program’s year-end closure. At the end of the program, the total accepted volume for all facilities combined amounted to $17.5 billion (1,830 loans), with roughly half of that overall volume occurring in December. Most activity was concentrated in priority loans (the loans that allow leverage as high as 6 and refinancing of debt owed to another lender), which amounted to $12.9 billion (1,173 loans), representing 74 percent of total loan volume outstanding. An additional $2.7 billion (616 loans), or 15.4 percent, of loan volume outstanding was new loans that allowed borrower leverage only as high as 4. The remaining $1.8 billion (10.3 percent) of loan volume were expanded loans, accounting for 26 loans, with an average loan value of $69.4 million.4 In addition, both the number and size of loans in the nonprofit facilities were small ($42 million in 15 loans).
Altogether, Main Street saw uptake by 2,453 borrowers and reached a variety of different firms, with some key characteristics standing out.5 All participating firms were well below the maximum size-eligibility threshold of $5 billion in 2019 revenue: 99 percent of the loans (94 percent of volume) were taken out by firms that reported less than $50 million EBITDA, suggesting revenues well below the cap. In terms of leverage, the mean firm had an adjusted debt-to-EBITDA ratio of 1.09 (median of 0.64) prior to obtaining a Main Street loan, and a mean adjusted debt-to-EBITDA ratio of 4.03 (median of 4.00) after accounting for the Main Street loan.6 Indeed, similar calculations undertaken at the facility level show that a large share of participating firms’ loans were constrained by the program’s maximum leverage ratio (4 times or 6 times), rather than by the unconditional maximum loan size limit or the maximum firm size limit, suggestive of unmet credit demand from small firms.
Main Street uptake was widespread but in general concentrated among industries that were most affected by the COVID-19 pandemic, with the top four industries being accommodation and food services ($2.18 billion, 12.5 percent), manufacturing ($1.71 billion, 9.8 percent), real estate and rental and leasing ($1.66 billion, 9.5 percent), and mining, oil and gas extraction ($1.47 billion, 8.4 percent).7 Using a more granular industry classification, the left-hand side of Figure 1 shows that at the close of the program, 71.4 percent of all Main Street lending went to COVID-affected industries.8 The uptake by COVID-affected industries was persistently high during the operation of the program.
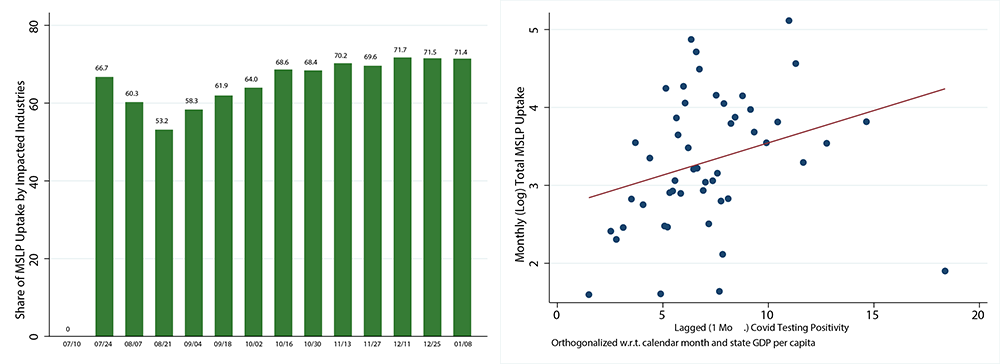
Sources: MSLP SPV data, New York Times COVID-19 data (https://github.com/nytimes/covid-19-data), and authors’ calculations.
The program also had a broad geographic coverage, attracting borrowers from 49 states (all states except Maine), the District of Columbia, and two territories. The top states by volume of accepted participation as a fraction of state-level GDP were (in order) Oklahoma, Arkansas, Missouri, and Florida. Importantly, Main Street loans tended to support disproportionately more businesses in locations that were particularly hard hit by the pandemic. The righthand side of Figure 1 shows that Main Street uptake by state in any month was positively correlated with the state’s COVID-19 testing positivity rate in the preceding month (the positivity rate is the number of positive tests divided by the total number of total reported tests, in percentages).
Program participation by banks was mixed.9 Although approximately 600 banks registered for the program, only about one-half originated loans under the program. Relatively smaller banks, those with less than $1 billion in assets, accounted for a little less than one-quarter of the total Main Street loan volume, and banks with assets of $1 billion to $50 billion originated 57.7 percent of the loans. In general, the largest banks did not participate in Main Street in a substantial way, although the limited number of loans they did make were concentrated in large expanded loans—implying that while the number of loans they originated was modest, the dollar volume was notable.
Comparison between Main Street and FR Y-14Q Corporate Loan Originations
While the total Main Street uptake was larger than any of the other debt-purchase facilities established by the Federal Reserve (Morgan and Clampitt 2021), its total uptake has sometimes been judged modest, especially when compared with its total capacity of close to $600 billion.10 To place the total Main Street uptake in a broader context, we gauge the availability of bank credit to a larger set of borrowers during the period the program was operating. Because Main Street targeted medium-sized borrowers whose major funding source is bank credit, we compare lending through the program with the volume of bank loans that were not sold to Main Street but did meet the main criteria to qualify for the program.
Specifically, we analyze the relevant segments of loan balances originated by banks that participate in the Federal Reserve’s supervisory stress tests and have to complete the FR Y-14Q corporate loan schedule (Y-14Q).11 The detailed loan-level information enables us to identify newly originated loans with characteristics roughly consistent with those of Main Street loans that these banks issued following the start of the Main Street program. These are term loans that are less than $300 million and were taken out by nonfinancial firms with a leverage ratio lower than 6.12 Importantly, we consider only term loans, because revolving credit facilities did not qualify for Main Street.
While Y-14Q corporate loans account for 82 percent of the overall C&I bank credit (see Chodorow-Reich et al. 2020), the sample of loans issued to medium-sized firms is incomplete, because some of these firms likely obtained credit from smaller banks that are not subject to stress testing and hence do not report loan information in the Y-14Q. Nevertheless, the comparison of Main Street and Y-14Q loan volumes is useful for showing the relative importance of the lending program in light of non-MSLP Y-14Q lending to medium-sized borrowers. Moreover, a comparison with Y-14Q banks is meaningful, as loan balances of smaller banks (with as much as $1 billion in total assets) have been declining during the pandemic.
Looking at total loan volume, we find that by the end of December 2020 (the most recent date for which Y-14Q data are available), total Main Street volume, shown as the black bars in Figure 2, had reached roughly 60 percent of the comparable Y-14Q loan volume, shown as the grey bars. In other words, Main Street lending volume over its lifespan was about 60 percent of the volume of comparable loans made outside the program by large banks.
Interestingly, from early December through the end of December, the biweekly growth rate of Main Street loans outpaced the growth rate of comparable loan originations observed in the Y-14Q. This surge in activity may have been driven in part by the program’s impending closure and related submission deadlines for loan applications, in conjunction with rising COVID-19 cases and precautionary borrowing motives.
We now consider the impact of leverage limitations on program lending. Because we found that a large share of participating firms’ loans were constrained by the program’s maximum leverage ratio (4 times or 6 times), it’s useful to compute lending volumes outside the Main Street program that exceeded these leverage ratios. Figure 2 also shows that a sizable portion of the Y-14Q originations were to borrowers with leverage higher than 6 (white bars), which were not eligible under Main Street. As of December 31, 2020, the total loan volume of leverage constrained borrowers was about 60 percent that of unconstrained borrowers (that is, the white and grey bars). Consistent with the leverage ratio being a binding constraint for firm participation in the Main Street program, we also observe that the volume of Y-14Q originations was nearly three times greater than that of Main Street loans with comparable characteristics.
Thus, we find that the volume of loans made under the Main Street program was about 60 percent of the volume of comparable loans made outside the program, suggesting that the program was a notable addition to the supply of credit to targeted borrowers. Moreover, we find that the program’s leverage constraints were particularly binding.
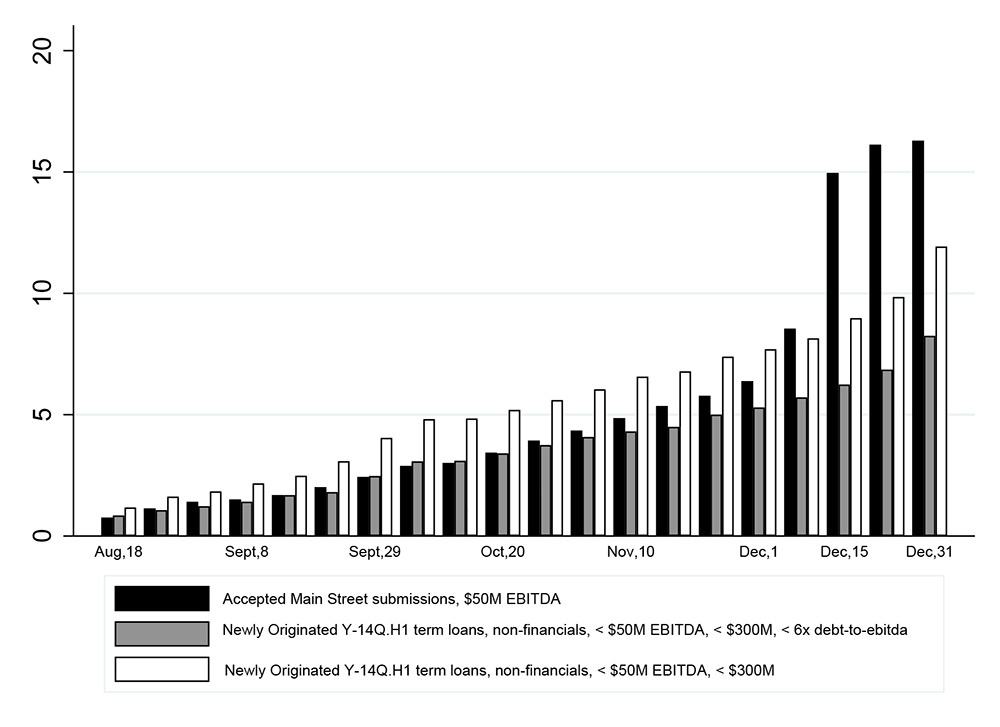
Sources: MSLP SPV data, FR Y-14Q corporate loan schedule, and authors’ calculations.
Although Main Street was designed to provide loans to firms with revenues of as much as $5 billion as of 2019, we note that almost all loans went to much smaller firms with less than $50 million EBITDA, which motivates our comparison of Main Street loans and Y-14Q loans to these firms.
Figure 3 shows biweekly total credit amounts to firms with as much as $50 million EBITDA extended through the Main Street program13 and new originations to similar firms in Y-14Q. Focusing on firms with an adjusted debt-to-EBITDA ratio of less than 6, we find that total new credit through the Main Street (black bars) and Y-14Q banks (grey bars) was roughly similar through November 2020, but the surge in Main Street activity increased overall uptake at the end of December to more than $16.2 billion, which is two times more than the volume originated by Y-14Q banks. Even when compared with newly originated Y-14Q loans to all small firms with less than $50 million in EBITDA, irrespective of their leverage ratio, Main Street volume was about 50 percent larger by the end of December (white bar).
Overall, our comparison highlights that the uptake of the Main Street program was very similar to the uptake from the Y-14Q banks, especially for borrowers with less than $50 million EBITDA. This finding suggests that Main Street added substantially to the supply of credit to the smallest firms.
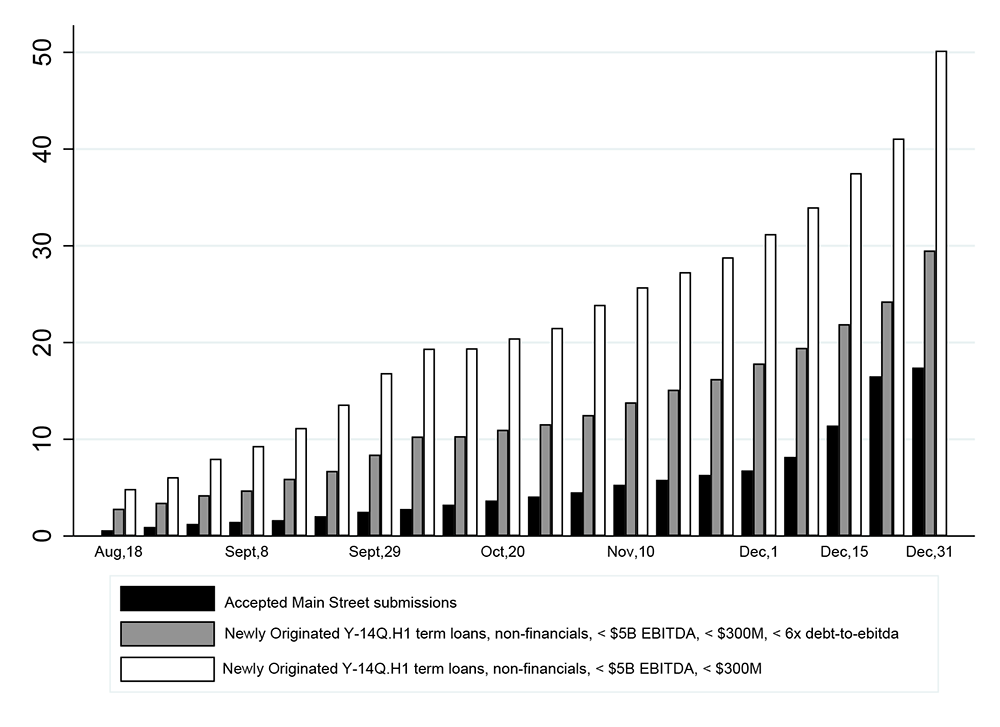
Sources: MSLP SPV data, FR Y-14Q corporate loan schedule, and authors’ calculations.
Conclusion
Our analysis provides new insights into the uptake of the Main Street Lending Program. We find that a range of different borrowers used the program, with disproportionate uptake by firms that faced pandemic-related business disruptions. Loans made under Main Street totaled about 60 percent of comparable loans originated by the largest banks while the program was operational. Nevertheless, the terms of the Main Street program were considered tight along several dimensions. In particular, the requirement of a leverage ratio lower than 6 especially prevented many potential borrowers from using the program. Overall, Main Street seems to have added substantially to the supply of credit to medium-sized borrowers, especially those with less than $50 million EBITDA that likely had limited access to large banks.
References
Chodorow-Reich, Gabriel, Olivier Darmouni, Stephan Luck, and Matthew C. Plosser. 2020. “Bank Liquidity Provision across the Firm Size Distribution.” NBER Working Paper No. 27945.
Morgan, Donald P., and Steph Clampitt. 2021. “Up on Main Street.” Federal Reserve Bank of New York Liberty Street Economics (blog). February 5, 2021. https://libertystreeteconomics.newyorkfed.org/2021/02/up-on-main-street.html
Minoiu, Camelia, Rebecca Zarutskie, and Andrei Zlate. 2021. “Motivating Banks to Lend? Understanding Bank Participation in the Main Street Lending Program.” Available at SSRN: https://ssrn.com/abstract=3773242 or http://dx.doi.org/10.2139/ssrn.3773242
1. Authors: Falk Bräuning (Federal Reserve Bank of Boston) and Teodora Paligorova (Federal Reserve Board). Our analysis has benefitted from the efforts and comments of many staff members at the Federal Reserve Board and the Federal Reserve Bank of Boston. The views expressed in this document are the authors' only and not those of the Board or Governors, the Federal Reserve Bank of Boston or the Federal Reserve System. This article is published in the Current Policy Perspectives series: https://www.bostonfed.org/publications/current-policy-perspectives/2021/uptake-of-the-main-street-lending-program.aspx Return to text
2. In addition to loans targeted at for-profit businesses, Main Street also purchased loans from nonprofit businesses. The Main Street term-sheet parameters shown reflect those terms as of the end of the program for business loans only, as several parameters, including loan size limits, were changed over the life of the program. Return to text
3. “Priority loans’ could be used to refinance existing loans, while “expanded loans” involved rewriting existing credit agreements. Return to text
4. The relatively few expanded loans may have reflected several factors, including the complexity of such transactions, the requirement that lenders dilute collateral associated with their existing loans to borrowers when originating an expanded loan, and the favorable financing conditions facing large middle-market firms in the leveraged loan market. Return to text
5. The total number of borrowers is based on unique Taxpayer Identification Numbers and includes firms borrowing through multi-borrower loans. Return to text
6. If priority loans were used to refinance debt provided by another lender, the leverage ratio submitted to the Main Street portal was based on excluding the debt that was to be refinanced. Return to text
7. Industry classifications are based on the two-digit NAICS code; it is thus possible that this breakdown does not reflect the full extent of industry dispersion of Main Street loans. Return to text
8. Wholesale Credit Risk Center’s classification of COVID-affected industries. Return to text
9. Bank participation in Main Street is discussed in more detail in Minoiu, Zarutskie, and Zlate (2021). Return to text
10. https://www.bloomberg.com/news/articles/2021-02-09/fed-s-main-street-program-ends-with-just-17-5-billion-in-loans. The large volume of the PPP may in part be driven by the forgivable nature of these loans. Return to text
11. Bank holding companies with total consolidated assets of $100 billion or more and intermediate holding companies with total consolidated assets of $100 billion or more are required to submit the Capital Assessment and Stress Testing report to the Federal Reserve. We use the FR Y-14Q corporate loan schedule, which is analogous to a loan-level credit registry. For more information see: https://www.federalreserve.gov/apps/reportforms/reportdetail.aspx?sOoYJ+5BzDZGWnsSjRJKDwRxOb5Kb1hL Return to text
12. We narrow the Y-14Q data to borrowers that would be eligible for Main Street and also focus on term loans of as much as $300 million, consistent with Main Street. However, we do not restrict the Y-14Q loans along any other loan dimension (for example, maturity, interest rate) to draw a comprehensive picture of credit made available to firms eligible for Main Street. Return to text
13. In Main Street, loans smaller than $1 million comprise less than 4 percent of the entire loan volume to firms with EBITDA of less than $50 million. Thus, our comparison is not affected by the $1 million minimum loan size limit in Y-14Q. Return to text
14. The caveat is that as of December 2020, due to data reporting gaps in Y14-Q, $14 billion of the cumulative volume of newly originated term loans (that is, 17 percent of the total volume of newly originated term loans smaller than $300 million) remains with missing information about borrowers’ EBITDA, meaning that we underestimate the actual volume of Y14-Q loan balances to borrowers with less than $50 million in EBITDA. To ameliorate this concern, we make the conservative assumption that all borrowers with missing information have less than $50 million EBITDA, and thus the total Y-14Q balance of newly originated loans to all firms, including those with missing information, would be $22 billion (the cumulative Main Street loan volume for firms with less than $50 million EBITDA at the end of 2020 is roughly $16 billion). Return to text
Bräuning, Falk, and Teodora Paligorova (2021). "Uptake of the Main Street Lending Program," FEDS Notes. Washington: Board of Governors of the Federal Reserve System, April 16, 2021, https://doi.org/10.17016/2380-7172.2897.
Disclaimer: FEDS Notes are articles in which Board staff offer their own views and present analysis on a range of topics in economics and finance. These articles are shorter and less technically oriented than FEDS Working Papers and IFDP papers.