FEDS Notes
July 18, 2025
What can public Fedwire payments data tell us about ample reserves?1
Erin Ferris, Amy Rose, and Manjola Tase
1. Introduction
Following the global financial crisis in 2008, the Federal Reserve increased the size of its balance sheet to provide additional monetary policy accommodation when monetary policy rates were constrained by the zero lower bound (ZLB), an operation known as quantitative easing (QE). QE led to a surge in central bank reserves which fundamentally changed the Fed's monetary policy implementation framework from a scarce to an abundant reserve regime. With the federal funds rate above the ZLB, the Fed indicated a desire to reduce the additional policy accommodation stemming from its balance sheet, indicating a preference to operate with a smaller balance sheet. As a result, the Fed reduced the size of its balance sheet - known as quantitative tightening (QT) - during the period 2017-2019. The Fed ended QT in July 2019, and reserves continued to decline as there was growth of other liabilities. In mid-September 2019, overnight money market rates spiked unexpectedly and exhibited significant volatility.2 The Fed conducted open market operations to increase reserves and mitigate money market pressures.3
The Fed again increased the size of its balance sheet during the Covid-19 pandemic.4 The current round of QT began in June 2022 and is ongoing. Specifically, in its May 2022 Plans for Reducing the Size of the Federal Reserve's Balance Sheet, the FOMC stated: "The Committee intends to reduce the Federal Reserve's securities holdings over time in a predictable manner primarily by adjusting the amounts reinvested of principal payments received from securities held in the System Open Market Account (SOMA)… Over time, the Committee intends to maintain securities holdings in amounts needed to implement monetary policy efficiently and effectively in its ample reserves regime. To ensure a smooth transition, the Committee intends to slow and then stop the decline in the size of the balance sheet when reserve balances are somewhat above the level it judges to be consistent with ample reserves."5 However, there is considerable uncertainty around the minimum level of reserves that is considered ample, and consequently when QT should end. One approach is to follow a number of indicators on reserve ampleness as summarized in Afonso et al. (2024a) and Clouse, Infante, and Senyuz (2025). These indicators, some based on non-public data, are descriptive in nature and do not provide an estimate for the ample level of reserves.6 Another approach is to estimate the ample level of reserves. For example, Afonso et al. (2022) estimated the slope of the reserve demand curve using a time-varying instrumental-variable approach at a daily frequency and found that during the 2017 to 2019 QT episode reserves declined from ample to scarce when reserves fell below 12-13 percent of banks' assets.
In this note, we propose an indicator based only on public data to provide an estimate for the minimum level of ample reserves. First, we construct a novel indicator of reserve ampleness based on data on interbank payments sent over the Fedwire Funds Service (Fedwire). Specifically, we calculate the share of reserves to Fedwire payments to capture the tightness of the payment function of reserves. As reserves decline and become less than ample, the indicator will also decline unless the total amount of payments declines commensurately. We then explore the relationship between this indicator and the price of reserves, which we measure as the spread between the effective federal funds rate (EFFR) and the interest on reserve balances (IORB) rate, and use structural break analysis to establish the minimum level of ample reserves as a share of Fedwire payments and the corresponding EFFR - IORB spread. We find that fed funds trading slightly below the interest on reserves and reserves at about 65 percent of Fedwire payments are consistent with minimum level of ample reserves. However, we should note that this relationship and the corresponding threshold could change over time.
This note is organized as follows: The next section describes the data. Section 3 discusses our new indicator. Section 4 estimates the minimum level of ample reserves, and Section 5 concludes.
2. Data
All data in this analysis is publicly available.7 Monthly statistics on overall Fedwire activity are published with a one month lag. Fedwire is a real-time, gross settlement system. Fedwire participants can use this service to send or receive payments for their own accounts or on behalf of corporate or individual clients, to settle commercial payments, to settle positions with other financial institutions or clearing arrangements, to submit federal tax payments, or to buy and sell federal funds. Reserves data is from the Federal Reserve's weekly H.4.1 release. This release presents a balance sheet for each Federal Reserve Bank, a consolidated balance sheet for all 12 Reserve Banks, an associated statement that lists the factors affecting reserve balances of depository institutions, and several other tables presenting information on the assets, liabilities, and commitments of the Federal Reserve Banks. The effective federal funds rate (EFFR) is released daily by the Federal Reserve Bank of New York. The federal funds market consists of domestic unsecured borrowings in U.S. dollars by depository institutions from other depository institutions and certain other entities, primarily government-sponsored enterprises. These transactions are settled in Fedwire. Interest on reserve balances (IORB) rate is the rate received on reserve balances held at Federal Reserve banks. The IORB rate is published by the Federal Reserve Board.
3. Reserves to Fedwire payments: a new indicator of reserves conditions
Banks hold reserves, in part, to support their typical payments activity and as a source of contingency funding.8 Given the payment function of reserves, the share of reserves to Fedwire payments could provide insights into the amount of reserves needed for timely functioning of the interbank payments system. Figure 1 plots reserves, Fedwire payments and reserves as a share of Fedwire payments (reserves/Fedwire Payments) over the period January 2015 to March 2025. The shaded areas note periods of balance sheet runoff, with the balance sheet runoff that began in 2022 still ongoing. As shown in the figure, reserves and Fedwire payments are closely correlated. During the October 2017 – July 2019 balance sheet runoff, reserves declined at a faster pace than payments, resulting in a decline in reserves as a share of Fedwire payments from 0.73 to 0.56. During the same period, EFFR increased relative to the IORB rate, from 9 basis points below the IORB rate to 5 basis points above the IORB rate. Looking at the ongoing 2022 QT episode, as of March 2025, reserves were little changed relative to the start of balance sheet runoff in June 2022. While the share of reserves to Fedwire payments has decreased from 0.75 at the start of balance sheet runoff in June 2022 to 0.71 in March 2025, EFFR continued to be about 7 basis points below the IORB rate, unchanged from the June 2022 level.9
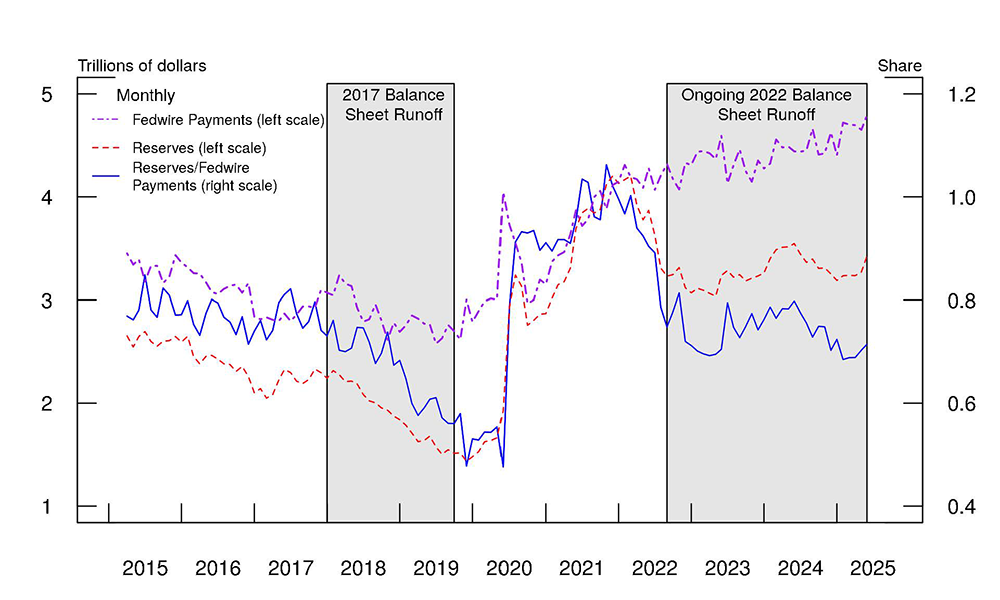
Notes: Reserves is the weighted monthly average of reserves from the weekly H.4.1 release. Fedwire Payments is the average daily value of transfers sent across Fedwire over each month. The shaded regions represent the 2017 and 2022 balance sheet runoff periods. Data covers the period January 2015 to March 2025.
Source: Federal Reserve Board, H.4.1; Fedwire Funds Service.
To understand how the quantity of reserves affects payment activity, it is instructive to understand banks' payment strategies. Banks can use a variety of different payment timing strategies in managing their intraday liquidity and the flow of payments in Fedwire, including (1) using incoming payments to finance outgoing payments (also known as strategic complementarity in payments) and (2) pushing outgoing payments to later in the day. Ferris, Rose, and Tase (2025) show that bank-specific factors drive the combination of strategies that a bank utilizes. Specifically, they find that banks with higher volumes of payments and larger repo books tend to send payments late in the day and have lower strategic complementarities, while banks with higher deposit bases tend to have higher strategic complementarities and send fewer payments late in the day. Regardless of their strategy, as reserves decline relative to Fedwire payments, banks would be willing to pay a higher price for reserves. Figure 2 plots the EFFR - IORB spread and reserves as a share of Fedwire payments. We hypothesize that when reserves are ample, the EFFR - IORB spread would be largely insensitive to changes in reserves as a share of Fedwire payments.10 As reserves decline and become less than the minimum level of ample reserves, the EFFR – IORB spread becomes more sensitive to changes in reserves.11 We explore structural breaks in the relationship between these two variables and identify the corresponding level of reserves as a share of Fedwire payments and the EFFR - IORB spread consistent with the minimum level of ample reserves, as discussed in the next section.
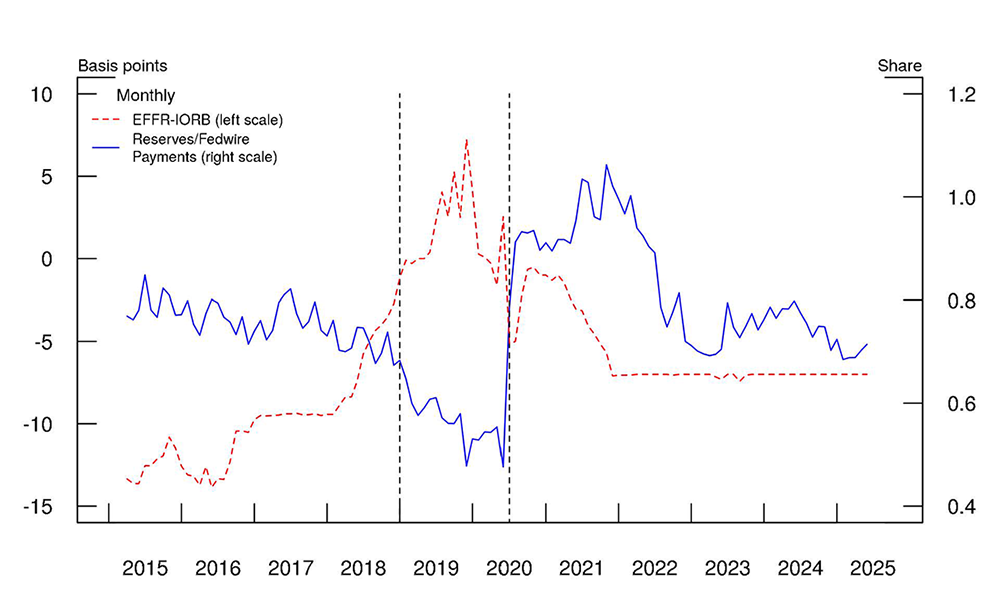
Notes: EFFR-IORB is the monthly average of the daily spread between the effective federal funds rate (EFFR) and interest on reserve balances (IORB). EFFR is released daily by the Federal Reserve Bank of New York and IORB is released daily by the Federal Reserve Board of Governors. Note that prior to July 29th, 2021, IOER (interest on excess reserves) is used for IORB; from July 29th, 2021 onward, IORB (interest on reserve balances) is used. Reserves is the weighted monthly average of reserves from the weekly H.4.1 release. Fedwire Payments is the average daily value of transfers sent across Fedwire over each month. The vertical dashed lines represent structural breaks (2018m10 and 2020m4) in the relationship between the plotted series (see Section 4). Data covers the period January 2015 to March 2025.
Source: Federal Reserve Bank of New York; Federal Reserve Board, Interest Rate on Reserve Balances; Federal Reserve Board, H.4.1; Fedwire Funds Service.
4. Estimating ample reserves
In this section, we explore the relationship between the ratio of reserves to Fedwire payments and the EFFR - IORB spread to infer the minimum level of reserves that is consistent with ample. An ample supply of reserves ensures that control over the level of the federal funds rate and other short-term interest rates is exercised primarily through the setting of the Federal Reserve's administered rates, and an active management of the supply of reserves is not required.12 This framework implies that during periods when reserves are ample, the EFFR - IORB spread would be largely insensitive to changes in reserves. Conversely, when reserves are less than ample, we would expect the relationship between the EFRR - IORB spread and reserves as a share of Fedwire payments to be statistically significant as, in a "less than ample" regime, changes in reserves would affect the fed funds rate. As a result, we would expect the relationship between the EFFR – IORB spread and reserves as a share of Fedwire payments to change when reserves move from ample to less than ample, representing structural breaks in this relationship.
To test this, we estimate the regression below and test for structural breaks as in Bai and Perron (1998) and Ditzen, Karavias, and Westerlund (2021).
$$$$ \Delta(EFFR-IORB)_t= \beta_0+\beta_1 \Delta (\frac{Reserves}{FedwirePayments})_t+\epsilon_t $$$$
$$EFFR−IORB$$ is the average over month $$t$$ of the daily spread between the effective federal funds rate (EFFR) and interest on reserve balances (IORB). $$Reserves$$ is the monthly weighted average of weekly observations of reserves from the H.4.1 release. $$FedwirePayments$$ is the monthly average of the daily value of transfers sent over Fedwire. We use first differences since the variables are not stationary in levels but are stationary in first differences. Data is monthly, for the period 2015m1 – 2025m3. Our coefficient of interest is $$\beta_1$$. We expect $$\beta_1$$ to be is insignificant when reserves are ample and negative and significant when reserves are less than ample. We find evidence of two break points as shown in Table 1. The corresponding months are 2018m10 and 2020m4. Table 2 shows the regression results for each sub period: 1) From ample to less than ample (2018m10): The relationship between the EFFR - IORB spread and reserves as a share of Fedwire payments changed from insignificant for the period before the first break date (2018m10) to negative and strongly significant afterwards (until the second break date). This finding suggests that 2018m10 marks the time when reserves became less than ample. 2) From less than ample to ample (2020m4): The relationship between the EFFR - IORB and reserves as a share of Fedwire payments changed from negative and significant for the period before the second break date (2020m4), to insignificant afterwards. This finding suggests that 2020m4 marks the time when reserves became ample.
Table 1: Testing for Structural Breaks
Bai & Perron Critical Values
| Test Statistic | 1% Critical Value | 5% Critical Value | 10% Critical Value | |
|---|---|---|---|---|
| F(1|0) | 27.65 | 12.29 | 8.58 | 7.04 |
| F(2|1) | 48.64 | 13.89 | 10.13 | 8.51 |
| F(3|2) | 3.27 | 14.8 | 11.14 | 9.41 |
| F(4|3) | 3.25 | 15.28 | 11.83 | 10.04 |
| F(5|4) | 3.23 | 15.76 | 12.25 | 10.58 |
| Detected number of breaks: | 2 | 2 | 2 |
Notes: The table shows sequential test for multiple breaks at unknown breakpoints in the relationship between the EFFR - IORB spread and reserves as a share of Fedwire payments as in Ditzen, Karavias, and Westerlund (2021). The EFFR - IORB spread is the monthly average of the daily spread between the effective federal funds rate (EFFR) and interest on reserve balances (IORB). Reserves is the weighted monthly average of weekly reserves. Fedwire Payments is the average daily value of transfers sent across Fedwire over each month. We use the first difference since the variables are not stationary in levels but they are stationary in first difference.
Table 2: Regression Results for Each Subperiod
| D.(EFFR-IORB) | (1) (ample) 2015m1-2018m9 |
(2) (less than ample) 2018m10-2020m3 |
(3) (ample) 2020m4-2025m3 |
|---|---|---|---|
| D.(reserves/Fedwire Payments) | 0.800 | -45.067*** | 1.540 |
| (2.034) | (8.056) | (0.938) | |
| Constant | 0.243** | -0.330 | -0.030 |
| (0.108) | (0.406) | (0.090) | |
| Observations | 44 | 17 | 59 |
| R-squared | 0.002 | 0.524 | 0.014 |
Newey-West standard errors in parentheses
*** p<0.01, ** p<0.05, * p<0.1
Notes: The table shows the regression results for each sub period as defined by the breakpoints (2018m10 and 2020m4) in the relationship between the EFFR - IORB spread and reserves as a share of Fedwire payments. The EFFR - IORB spread is the monthly average of the daily spread between the effective federal funds rate (EFFR) and interest on reserve balances (IORB). Reserves is the weighted monthly average of weekly reserves. Fedwire Payments is the average daily value of transfers sent across Fedwire over each month. We use the first difference as the variables are not stationary in levels but they are stationary in first difference. Newey-West standard errors include 2 lags based on lag-selection criteria.
Table 3 shows the average EFFR - IORB spread and reserves to Fedwire payments (Res/Fedwire) for the two estimated break dates: 2018m10 and 2020m4 and the corresponding preceding months. The table also shows the EFFR-IORB spread and (Res/Fedwire) for September 2019, a period of unexpected money market stress, pointing to reserve scarcity. This stress happened less than 2 months after the 2017-2019 QT episode ended, suggesting that reserves might had already become less than ample and is supported by our analysis estimating 2018m10 as the break date of reserves moving from ample to less than ample. Note that the EFFR - IORB spread is wider and reserves as a share of Fedwire payments is much higher at the second break date (April 2020), moving from ample to less than ample than at the first break date (moving from less than ample to ample). A likely explanation is that the second break date corresponds to a period of rapid increase in Fed's balance sheet and rapid decline in the target range for the fed funds rate in response to the economic developments resulting from the Covid-19 pandemic.13 As a result, the average EFFR - IORB spread declined from 2.5 basis points to -5 basis points and reserves to Fedwire payments increased from 0.48 to 0.79 from March 2020 (one month before the estimated second break date) to April 2020 (the estimated second break date). Taking the average the March 2020 and April 2020 corresponding values, the second break likely corresponds to the EFFR - IORB spread at about -1 basis points and reserves as a share of Fedwire payments at about 0.63. We then take the average of the EFFR-IORB spread and reserves/Fedwire corresponding to October 2018 and the March/April 2020 break dates to provide our estimate of the minimum level of ample reserves corresponding to reserves to Fedwire payments at about 0.65 and the EFFR-IORB spread at about 1 basis point.
Table 3: Structural Breaks in the Relationship between the EFFR - IORB Spread and Reserves as a Share of Fedwire Payments
| Date | EFFR-IORB (bps) | (Res/Fedwire) | (Res/Assets) | (Res/Dep) | |
|---|---|---|---|---|---|
| ample → less than ample | 2018m9 | -2.74 | 0.67 | 0.11 | 0.15 |
| 2018m10 | -1.18 | 0.68 | 0.11 | 0.15 | |
| avg(2028m9, 2018m10) | -1.96 | 0.68 | 0.11 | 0.15 | |
| Sep 2019 events | 9/17/2019 | 20 | 0.48 | 0.08 | 0.11 |
| less than ample → ample | 2020m3 | 2.55 | 0.48 | 0.10 | 0.14 |
| 2020m4 | -5.14 | 0.79 | 0.15 | 0.20 | |
| avg(2020m3, 2020m4) | -1.3 | 0.63 | 0.13 | 0.17 |
Notes: The table shows the EFFR - IORB spread, reserves to Fedwire payments (Res/Fedwire). The row (ample → less than ample) shows these values for 2018m10 (the first break date). The row (less than ample → ample) shows the value for 2020m4 (the second break date) and 2020m3 (the month before) as well as the corresponding average to illustrate the rapid changes at that time as discussed in Section 3. We also show reserves to bank assets (Res/Assets) and reserves to bank deposits (Res/Dep) as a reference. We also show these variables on September 2019, a period of money market stress pointing to reserves scarcity. The data for September 2019 is as follows: the EFFR - IORB spread is as of 9/17/2019, (Res/Fedwire) is the average for the month, (Res/Dep) and (Res/Asset) are as an average of the corresponding weekly data around 9/17/2019:"Federal Reserve Balance Sheet: Factors Affecting Reserve Balances - H.4.1" data are from September 11 and 18, 2019; and "Assets and Liabilities of Commercial Banks in the United States - H.8" are from September 11 and 18, 2019.
While our analysis is on the relationship between EFFR-IORB spread and the ratio of reserves to Fedwire payment, we also show reserves to bank assets (Res/Assets) and reserves to bank deposits (Res/Dep) to compare our results with other estimates of ample reserves in the literature.14 For example, the corresponding value of reserves as a share of bank assets on the first break date in October 2018 is just under 11 percent, a bit below the estimate of ample reserves in Afonso et al. (2022), whose estimates suggest a break point about six months earlier between March and June of 2018. At the second break point, the share rises from about 9.5 percent at the beginning of March to about 15 percent at the end of April, encompassing the estimate of ample reserves in Afonso et al. (2022).
EFFR trading slightly below IORB is consistent with minimum ample reserves. When reserves are ample, most individual fed funds trades are at a rate below the IORB rate and most of the activity in the fed funds market is characterized as IORB arbitrage: banks borrow in the fed funds market at a rate below the IORB rate to increase their reserve balances at the Fed, receiving the IORB rate on those balances. Even in such an environment, there might be banks that borrow for liquidity management purposes. These banks have a higher reservation price and would be willing to pay a rate higher than the IORB rate. However, when the fed funds rate is below the IORB rate (that is IORB arbitrage is profitable) the true trading motive of the borrower is not revealed. Tase (2022) shows that when EFFR trades above IORB, there is an increase in the probability that the fed funds rate continues to increase, resulting in an acceleration in the pace of the increase in the fed funds rate. When a borrower is willing to trade above IORB, it reveals that its true trading motivation is liquidity demand rather than arbitrage. As a result, this revealed preference enhances the cumulative effect of balance sheet runoff on the federal funds rate.
5. Conclusion
We estimate the threshold of when the ratio between payments and reserves correspond to the level of reserves ampleness. We find that fed funds trading slightly below the interest on reserves and reserves at about 65 percent of Fedwire payments are consistent with minimum ample reserves. However, these estimates are based on historical data and changes in banking regulation, or the payments system could affect demand for reserves and the external validity of these results.
References
Afonso, Gara, Marco Cipriani, Adam Copeland, Anna Kovner, Gabriele La Spada, and Antoine Martin (2021). "The Market Events of Mid-September 2019," Federal Reserve Bank of New York, Economic Policy Review, vol. 27 no. 2 (August).
Afonso, Gara, Kevin Clark, Brian Gowen, Gabriele La Spada, JC Martinez, Jason Miu, and Will Riordan. (2024a), "A New Set of Indicators for Reserve Ampleness," Federal Reserve Bank of New York Liberty Street Economics, August 14, 2024.
Afonso, Gara, Domenico Gioannone, Gabriele La Spada, and John C. Williams (2022). "Scarce, Abundant, or Ample? A Time-Varying Model of the Reserve Demand Curve (PDF)," Federal Reserve Bank of New York Staff Reports, no. 1019, revised May 2025.
Afonso, Gara, Domenico Gioannone, Gabriele La Spada, and John C. Williams (2024b). "When Are Central Bank Reserves Ample?" Federal Reserve Bank of New York Liberty Street Economics, August 13, 2024.
Anbil, Sriya, Alyssa Anderson, and Zeynep Senyuz (2020). "What happened in Money Markets in September 2019?" FEDS Notes. Washington: Board of Governors of the Federal Reserve System, February 27, 2020.
Anderson, Alyssa, and Dave Na. (2024). "The Recent Evolution of the Federal Funds Market and its Dynamics during Reductions of the Federal Reserve's Balance Sheet," FEDS Notes. Washington: Board of Governors of the Federal Reserve System, July 11, 2024.
Bai, Jushan, and Pierre Perron (1998). "Estimating and Testing Linear Models with Multiple Structural Changes," Econometrica, vol. 66 no. 1 (January), pp. 47–78.
Clouse, James A., Sebastian Infante, and Zeynep Senyuz (2025). "Market-Based Indicators on the Road to Ample Reserves," FEDS Notes. Washington: Board of Governors of the Federal Reserve System, January 31, 2025.
Ditzen, Jan, Yiannis Karavias, and Joakim Westerlund (2021). "Testing and Estimating Structural Breaks in Time Series and Panel Data in Stata," Working paper.
Ferris, Erin, Amy Rose, and Manjola Tase (2025). "Payment Timing," Working paper.
Ihrig, Jane, Zeynep Senyuz, and Gretchen C. Weinbach (2020). "Implementing Monetary Policy in an "Ample Reserves" Regime: The Basics (Note 1 of 3)," FEDS Notes. Washington: Board of Governors of the Federal Reserve System, July 1, 2020.
Tase, Manjola (2022). "Demand Segmentation in the Federal Funds Market," Finance and Economic Discussion Series 2022-071. Washington: Board of Governors of the Federal Reserve System, November.
1. The analysis and conclusions set forth are our own and do not necessarily reflect the views of the Board of Governors or the staff of the Federal Reserve System. We thank David Bowman and Sebastian Infante for their helpful comments. All remaining errors are our own. Return to text
2. See Afonso et.al (2021) and Anbil, Anderson and Senyuz (2020) for a description of September 2019 events in money markets. Return to text
3. See the October 11, 2019 FOMC Statement. Return to text
4. See the March 15, 2020 FOMC Statement. Return to text
5. See the May 2022 Plans for Reducing the Size of the Federal Reserve's Balance Sheet. Return to text
6. The indicators in Afonso et al. (2024a) are based on non-public data and include: elasticity of the volume-weighted average federal funds rate to changes in reserve balances; domestic banks' share of federal funds volumes; share of interdealer repo trading at rates above the IORB rate; share late-day payments in Fedwire; volume of intraday overdrafts. The indicators in Clouse, Infante and Senyuz (2025) are based on public data and include: the spread of the effective federal funds rate (EFFR) relative to the interest on reserve balances (IORB) rate; a simple measure of the "slope" of the reserve demand curve; the spread of rates on Treasury repurchase agreements (repo) relative to IORB; and volatility in money market rates. Return to text
7. Fedwire Payments is from the Fedwire Funds Service. Reserves is from weekly H.4.1 release. EFFR is released daily by the Federal Reserve Bank of New York. IORB is released daily by the Federal Reserve Board of Governors. Prior to July 29th, 2021, IOER (interest on excess reserves) is used for IORB. From July 29th, 2021 onward, IORB (interest on reserve balances) is used. Return to text
8. Until March 2020, banks were also subject to a reserve requirement. In addition, banks keep reserves for liquidity management purposes and to satisfy the Liquidity Cover Ratio requirements. See Federal Register, Vol. 79, No. 197, Friday, October 10, 2014, Rules and Regulations. Return to text
9. Over this period there were changes in the composition of balance sheet liabilities. Specifically, reserves increased earlier in the period and the decline in the size of the balance sheet was mostly offset by non-reserve liabilities, namely the Federal Reserve's overnight reverse repurchase agreement (ON RRP) facility and increased later in 2024. Return to text
10. There a wide literature describing the federal funds market. See Anderson and Na (2024) for a summary of the evolution of the fed funds market and its dynamics during reductions of the Fed's balance sheet. Return to text
11. See Afonso, Gioannone, Spada, and Williams (2024b) and Ihrig, Senyuz, and Weinbach (2020) for further discussion. Return to text
12. See the January 2019 Statement Regarding Monetary Policy Implementation and Balance Sheet Normalization. Return to text
13. See the March 15, 2020 FOMC statement. Return to text
14. Bank assets and bank deposits are publicly available from the weekly H.8 release. Series used are total assets and total deposits for all commercial banks in the United States (not seasonally adjusted). Return to text
Ferris, Erin, Amy Rose, and Manjola Tase (2025). "What can public Fedwire payments data tell us about ample reserves?," FEDS Notes. Washington: Board of Governors of the Federal Reserve System, July 18, 2025, https://doi.org/10.17016/2380-7172.3807.
Disclaimer: FEDS Notes are articles in which Board staff offer their own views and present analysis on a range of topics in economics and finance. These articles are shorter and less technically oriented than FEDS Working Papers and IFDP papers.