FEDS Notes
July 02, 2021
Why Have Initial Unemployment Claims Stayed So High for So Long?
Introduction
As the labor market recovers from the COVID-19 pandemic, claims for unemployment insurance (UI) have been surprisingly slow to return to conventional levels. As recently as 2021Q1, initial claims for regular UI benefits averaged nearly 800,000 per week (see Figure 1)—more than twice as many as were observed at a comparable point during the recovery from the Great Recession.1 Although initial claims fell substantially this spring, the latest readings are still almost double those observed in the lead-up to the pandemic.2 Throughout the recovery, the UI numbers have been consistently hard to square with the degree of improvement evident in other labor market indicators, such as the unemployment rate, job postings, and layoffs.
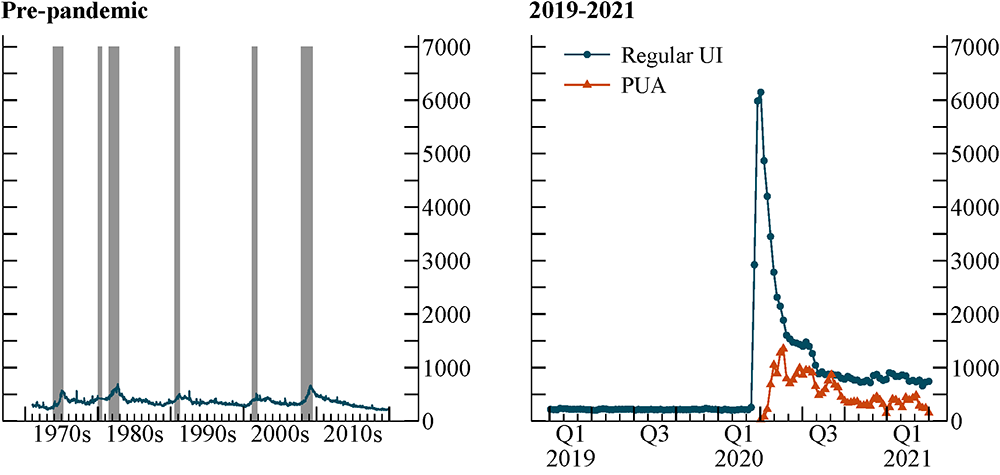
Note: Regular state UI claims are seasonally adjusted; PUA claims are not. Both are at weekly frequency. The last data point shown is for the week ending April 3, 2021. Grey bars in the left panel indicate pre-pandemic periods of business recession as defined by the National Bureau of Economic Research: November 1973–March 1975, January 1980–July 1980, July 1981–November 1982, July 1990–March 1991, March 2001–November 2001, and December 2007–June 2009.
Source: Department of Labor Employment and Training Administration (DOL ETA), form ETA 539, via Haver Analytics.
Why have initial UI claims remained so high for so long? In this note, I argue that much of the answer lies with the expansions to UI eligibility and generosity implemented in response to the pandemic. I focus primarily on the role of Pandemic Unemployment Assistance (PUA), a federal program that extends income support to self-employed workers and others who are ineligible for traditional UI benefits. Although such individuals would normally have little reason to apply for regular UI, many states have required them to do so as a first step towards obtaining PUA. Using data on UI eligibility currently available through the first quarter of 2021, I estimate that initial claims for regular UI benefits would have been 20 percent lower from 2020Q3 through 2021Q1 if not for increased filing prompted by PUA.
Other changes in UI policy have also kept claims abnormally elevated deep into the recovery. Supplemental benefits of $300 per week (formerly $600) have given unemployed and underemployed workers unusually strong incentives to apply for UI. In addition, almost every state waived its usual job search requirements early in the pandemic. These waivers, most of which were still in effect earlier this year, have made UI benefits available to many individuals for whom caregiving responsibilities or fears of infection have complicated returning to work.
Accounting for last year's UI expansions can thus go a long way towards explaining why initial claims have taken so long to return to familiar levels. By the same token, declining claim volumes in spring 2021 may owe partly to a new round of policy changes, as most states have by now reinstated pre-pandemic search requirements and many are withdrawing from the federal UI programs prior to their nationwide expiration. Initial claims are likely to fall further as the pandemic UI programs phase out and as the labor market continues to heal.
The role of the PUA program
Eligibility for regular UI benefits is limited to workers who have accrued sufficient earnings in UI-covered jobs in a base period leading up to their claim.3 Three groups of workers commonly fall short of this requirement: self-employed workers and independent contractors, who do not pay into the UI system; recent labor market entrants, who have not yet established an earnings history; and wage workers whose earnings fall below the required threshold, either because they work part-time at low wages or because they were jobless for much of the base period.
These groups are strikingly overrepresented among claims filed during the pandemic. Figure 2 plots the share of new claims passing the earnings test, as reported in the Department of Labor's quarterly data on UI monetary determinations.4 Prior to the pandemic, this share ranged between 75 and 90 percent, with a modest decline after each recession.5 During the pandemic, however, the passage rate fell much more precipitously than in the past: just over 50 percent of new claims satisfied the earnings test in the latter half of 2020, with only a slight rebound in 2021Q1. These unusually low eligibility rates signify an unprecedented influx of applicants with limited earnings in UI-covered jobs.6
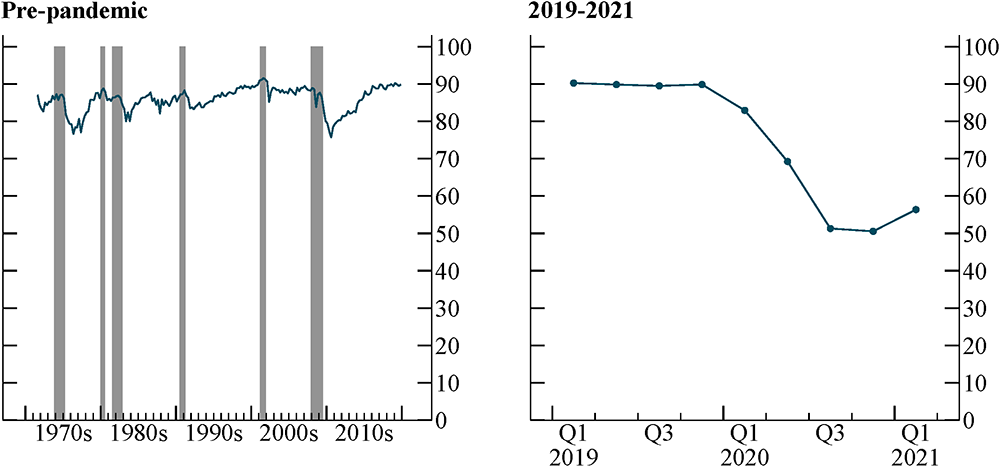
Note: Non-seasonally adjusted data at quarterly frequency, aggregated across states to obtain national totals. The plotted series is the percentage of monetary determinations finding that the claimant had sufficient base-period earnings to be eligible for regular state UI benefits, provided that non-monetary eligibility criteria are also met. Grey bars in the left panel indicate periods of business recession as defined by the National Bureau of Economic Research: November 1973–March 1975, January 1980–July 1980, July 1981–November 1982, July 1990–March 1991, March 2001–November 2001, and December 2007–June 2009.
Source: DOL ETA, form ETA 218.
This dramatic shift in the UI claimant pool owes largely to the federal PUA program, which was created in March 2020 to provide benefits to classes of workers not covered by traditional UI.7 Because federal guidelines restrict PUA to those who are ineligible for regular UI, many states instruct benefit-seekers that they must apply (and be denied) for regular UI before they can apply for PUA. As a result, many self-employed workers and other atypical claimants have been counted towards both regular UI and PUA in successive weeks, even though initial claims for these two programs are tallied separately in government statistics.
As evidence that PUA has fueled the surge in ineligible claimants, Figure 3 plots the share of new claimants passing the earnings test in three groups of states and territories: those that require claimants to apply for regular UI as a precondition for seeking PUA (27 programs); those that allow individuals to apply directly for PUA (16 programs); and those whose websites provide nuanced or ambiguous instructions (10 programs).8 Although passage rates have fallen nationwide, they have fallen much more steeply in states that instruct prospective PUA claimants to first apply for regular UI. These state-level patterns suggest that we would have seen a much more muted decline in eligibility rates nationwide if not for PUA.9
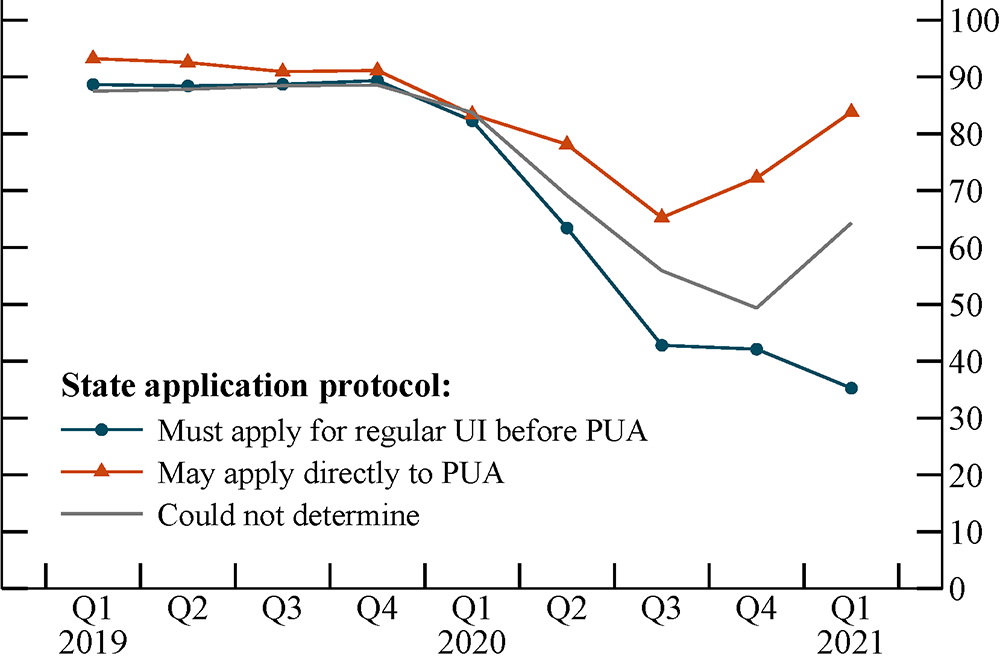
Note: See note to Figure 2. Each US state or territory is assigned to one of the three indicated categories based on the author’s review of application instructions given on its UI webpage.
Source: DOL ETA, form ETA 218, and author’s classification of state application protocols.
A simple back-of-the-envelope calculation can help us gauge what initial claim volumes might have looked like had the PUA program not been created. The first step is to note that initial claims fall into two separate categories, which differ in their relationship to PUA. New initial claims are filed by workers who have not received UI in the recent past. Reopened initial claims are filed by workers who were previously approved for benefits and who are now resuming benefit receipt after an intervening period of employment.10 I estimate counterfactual initial claims in the absence of PUA as
$$$$ \text{reopened initial claims} + \left(\frac{\text{observed passage rate}}{\text{passage rate absent PUA}}\right) \times \text{new inital claims}, $$$$
where I assume that 75 percent of new initial claims would have passed the earnings test in the absence of PUA, in line with the passage rate observed after the Great Recession.
The logic behind this formula is as follows. By definition, reopened claims originate from workers who have already passed the earnings test—in other words, standard claimants who would most likely be seeking benefits even in the absence of PUA. I therefore make no adjustment to the observed number of reopened claims. By contrast, new initial claims reflect a combination of standard and non-standard claimants. To weed out claims filed by non-standard claimants as a stepping-stone to PUA, I scale down the observed number of new claims based on the unusually low share of claimants passing the earnings test.11
Applying this formula quarter by quarter, I estimate that—if not for PUA—initial claims for regular UI benefits would have been about 7 percent lower in 2020Q2, when PUA was first being rolled out, and about 20 percent lower in each of 2020Q3, 2020Q4, and 2021Q1.
Even with this adjustment, initial claims would still have averaged over 600,000 per week in the first quarter of 2021. Such a tally would be comparable to the weekly counts reported in early 2009, even though monthly worker flows from employment into unemployment were about 50 percent higher in 2009 than they were in 2021Q1. Although PUA is a major reason why claims have been so slow to return to typical levels, it is clearly far from the only reason.
Other institutional factors
A second factor that has boosted initial claims is Federal Pandemic Unemployment Compensation (FPUC), which has provided supplemental benefits of $300 or $600 per week at various points during the pandemic.12 Take-up of UI benefits among eligible individuals is usually far from universal: qualifying workers may decline to file for UI because of a lack of information, stigma associated with benefit receipt, or an expectation that they will quickly be reemployed. FPUC has given unemployed and underemployed workers unusually strong incentives to claim UI, and there is good reason to believe that take-up rates have risen as a result.13 Although take-up rates are difficult to measure in available data, some indirect evidence comes from the unusually high share of 2020–21 UI claimants receiving partial UI benefits while working part-time. Partial UI recipients receive the $300/600 FPUC supplement in full, so FPUC has an especially large proportional impact on UI replacement rates for this group of workers.14
Alongside PUA, FPUC, and other federal programs created during the pandemic,15 many states broadened access to their UI programs at the start of the crisis by suspending waiting periods and by waiving their normal job search requirements. These state-level waivers may have drawn more applicants into the UI system, since individuals unable or unwilling to work—for example, because of childcare constraints associated with virtual schooling—might choose not to apply if they would be required to look for jobs.
In addition, UI statistics were heavily impacted in the first months of the crisis by backlogged claims, fraudulent filings, and other irregularities (Cajner et al., 2020; Government Accountability Office, 2020). Although these issues are likely much less consequential than they were early on, they may still be having an appreciable impact on claim volumes in some states.
These institutional factors should largely abate over the course of 2021. PUA, FPUC, and other federal programs are scheduled to expire in September, and many states have chosen to withdraw from them prior to their nationwide expiration.16 Most states have also reinstated their pre-pandemic job search requirements, and state and federal authorities have worked hard to resolve backlogs and to deter fraud. As the institutional landscape returns to pre-pandemic norms, policy measures unique to the pandemic should have a diminishing impact on reported claims.
The state of the labor market
A final consideration is that labor market conditions over the past year have likely been somewhat weaker than measured unemployment suggests. The official unemployment rate—which is calculated from household responses to the Current Population Survey (CPS)—excludes or undercounts at least four groups of individuals who may be filing UI claims. First, the Bureau of Labor Statistics has cautioned that some unemployed CPS respondents have been misclassified as employed but absent from work. Second, survey response rates have fallen during the pandemic, especially for groups that tend to have higher unemployment rates. The sampling weights used to estimate aggregate unemployment may not fully account for these missing respondents. Third, millions of workers have exited the labor force because of caregiving needs, fears of the virus, or a lack of suitable job opportunities. And lastly, the number of individuals working part-time for economic reasons is still well above pre-pandemic levels.17
In sum, while much of the recent disconnect between initial UI claims and other labor market indicators can be attributed to changes in UI policy in response to the pandemic, some of it may reflect forms of labor market weakness that other data sources do not adequately capture. As long as initial claims remain far above pre-pandemic levels, they will serve as a weekly reminder that the labor market recovery remains uneven and that much ground is still left to be regained.
I close with a cautionary note about how to interpret these findings. Although last year's UI expansions amplified claim volumes given contemporaneous labor market conditions, they have also influenced those conditions in turn. The pandemic UI programs have provided critical income support to millions of American households, but their net effect on the labor market has been hotly debated: supporters of these programs argue that they have spurred the recovery by buttressing aggregate demand, whereas critics maintain that they have impeded the recovery by disincentivizing job search. My analysis is silent on the question of how the labor market would have fared had UI policy not responded to the pandemic.
References
- Cajner, Tomaz, Andrew Figura, Brendan M. Price, David Ratner, and Alison Weingarden. 2020. "Reconciling Unemployment Claims with Job Losses in the First Months of the COVID-19 Crisis." Finance and Economics Discussion Series Working Paper No. 2020-055.
- Dube, Arindrajit. 2021. "Aggregate Employment Effects of Unemployment Benefits during Deep Downturns: Evidence from the Expiration of the Federal Pandemic Unemployment Compensation." National Bureau of Economic Research Working Paper No. 28470.
- Finamor, Lucas, and Dana Scott. 2021. "Labor Market Trends and Unemployment Insurance Generosity during the Pandemic." Economics Letters, 199(2021): 109722.
- Ganong, Peter, Pascal Noel, and Joseph Vavra. 2020. "US Unemployment Insurance Replacement Rates during the Pandemic." Journal of Public Economics, 191(2020), 104273.
- Government Accountability Office. 2020. "Urgent Actions Needed to Better Ensure an Effective Federal Response." Report GAO-21-191.
- Marinescu, Ioana, Daphne Skandalis, and Daniel Zhao. 2021. "The Impact of the Federal Pandemic Unemployment Compensation on Job Search and Vacancy Creation." National Bureau of Economic Research Working Paper No. 28567.
Acknowledgements
The views expressed here are strictly those of the author and do not necessarily represent the views of the Federal Reserve Board or its staff, nor those of the Department of Labor. I am grateful to Isabel Leigh for excellent research assistance and to Andrew Figura, Charles Fleischman, Ryan Michaels, Seth Murray, and Ivan Vidangos for helpful comments.
1. I compare 2021Q1 with 2014Q2. Using seasonally adjusted data from the Bureau of Labor Statistics, the unemployment rate averaged 6.2 percent in both quarters, and the share of workers transitioning from employment to unemployment was similar as well. Initial claims averaged about 315,000 per week in 2014Q2. Adjusting for subsequent growth in the labor force, this translates into about 330,000 claims per week in today's terms. Return to text
2. At the time of writing, the most recent Department of Labor press release reported that an average of 392,750 initial claims for regular UI benefits were filed weekly in the four weeks ending June 26, 2021. (This number is subject to revision in future releases.) By comparison, initial claims averaged about 220,000 per week in 2019. Return to text
3. Most states define the base period as the first four of the five most recent completed quarters. In addition to the earnings test, claimants must also satisfy a range of other eligibility criteria, such as having a valid reason for being unemployed, being able and available to work, and (absent a statewide waiver) engaging actively in job search. Return to text
4. At the time of analysis, state-level records were unavailable for Alabama throughout 2020 and for Alabama, Colorado, Montana, and New Jersey in 2021Q1. The passage rates plotted in Figures 2 and 3 were computed using data from all available states in each quarter. The patterns look virtually identical if I exclude these four states throughout the analysis period, so that the sample is defined consistently over time. Return to text
5. A plausible explanation for the post-recession decline in UI eligibility is that the longer and more frequent unemployment spells experienced during recessions gradually erode workers' base-period earnings. Some job losers may file claims without realizing they are ineligible, especially if they have been entitled to UI benefits in the past. Return to text
6. A similarly steep decline is evident in the ratio of the number of claims receiving first payments in each month to the number of new claims filed in that month—a proxy for the share of claims that are ultimately awarded benefits. However, because benefit payments are dated to the time of payment rather than the time of filing, this measure is potentially distorted by time lags in the adjudication of claims and the disbursal of benefits. The share of claims passing the earnings test is less susceptible to such distortions because monetary determinations are issued early in the process and because the numerator and denominator pertain to the same point in time. Return to text
7. The unusual sectoral and occupational profile of pandemic job losses may also have contributed to the record share of ineligible claimants. Since low-wage segments of the labor market have been hit hardest by the pandemic, recent job losses may be unusually concentrated among workers with insufficient base-period earnings to receive UI. Return to text
8. These 53 programs represent the 50 states, the District of Columbia, Puerto Rico, and the US Virgin Islands. I classify states based on a review of each state's UI website. In some cases, program websites explicitly indicate whether a two-stage application is required. For example, the Illinois UI website says: "You can file a claim for PUA only after you applied for regular unemployment insurance benefits and have been denied." By contrast, the Massachusetts website says that self-employed workers and others typically ineligible for UI benefits should apply directly to PUA. Other cases are less clear-cut; for example, some states recommend that PUA applicants first apply for regular UI but indicate that this is not a strict requirement. Return to text
9. Even in states where people can apply directly for PUA, some claimants who expect to ultimately receive PUA are likely to start by applying for regular UI. Advocate organizations encourage applicants to try regular UI first, even if they think they may be ineligible. Return to text
10. The date when a claim is first approved marks the beginning of a 12-month "benefit year." Reopened claims (known as "additional claims" in Department of Labor parlance) are initial claims filed within an existing benefit year, whereas new claims are those filed when no benefit year is in progress. The Department of Labor reports monthly breakdowns of initial claims into new versus additional claims in Employment and Training Administration form 5159. New claims accounted for 85 percent of initial claims in 2020Q2, but only about two-thirds of initial claims in subsequent quarters, as many workers have experienced recurrent spells of unemployment. Return to text
11. I derive the scaling factor as follows. We can express the observed number of new initial claims as the sum of three components: claimants who pass the earnings test (denoted P, for "pass"); claimants who fail the earnings test, but would have applied even in the absence of PUA (denoted SD, for "standard denied applicants"); and claimants who fail the earnings test and who would not have applied in the absence of PUA (denoted ND, for "non-standard denied applicants"). The observed passage rate is $$\frac{P}{P+SD+ND}$$, and the passage rate absent PUA is $$\frac{P}{P+SD}$$. The ratio of the observed passage rate to the counterfactual passage rate absent PUA is therefore $$\frac{P+SD}{P+SD+ND}$$, which equals the share of observed claimants who would have applied even in the absence of PUA. Return to text
12. From its creation in March 2020 through July 2020, FPUC provided supplemental benefits of $600 per week. From August to December 2020, FPUC was unavailable, though a short-lived program called Lost Wages Assistance provided $300 or $400 per week for part of this period. From January 2021 until its scheduled expiration in September 2021, FPUC provides $300 per week. See Ganong, Noel, and Vavra (2020) for an analysis of UI replacement rates during the first phase of FPUC. Return to text
13. Note that the question of whether FPUC has boosted UI take-up rates is distinct from the question of whether FPUC has impeded the labor market recovery by disincentivizing claimants from returning to work. A spate of academic papers have found scant evidence that FPUC constrained employment last year (e.g., Dube [2021], Finamor and Scott [2021], and Marinescu, Skandaris, and Zhao [2021]), though its effects may differ in the tighter labor market of 2021. Regardless of how it may have affected employment, the program may have encouraged filing among unemployed and underemployed individuals who would otherwise not have applied for benefits. Return to text
14. Partial UI offers prorated benefits to workers who remain employed but experience significant declines in weekly earnings—for example, because they have lost one of two jobs, or because their weekly hours have been cut. (These partial benefits are distinct from the Short-Time Compensation or "work-sharing" program, which requires employer participation and is designed for workers experiencing more modest reductions in earnings.) The share of claimants receiving partial benefits surged above 16 percent in 2020Q4, compared with a pre-pandemic record high of about 11 percent. Furthermore, the average benefit amount among partial UI recipients (not counting the FPUC supplement) has fallen sharply during the pandemic. These patterns are consistent with increased take-up among underemployed claimants whose weekly benefits would normally be too meager to induce them to apply. Return to text
15. Other federal programs include Pandemic Emergency Unemployment Compensation (PEUC), which provides extra weeks of benefits to claimants who exhaust regular UI, and Mixed Earner Unemployment Compensation (MEUC), which covers claimants who have a combination of earned and self-employment income. The federal government has also provided full funding of Extended Benefits (EB), which are normally financed jointly with the states. PEUC and EB have accounted for large shares of UI beneficiaries in 2020–21, but neither is likely to be a major driver of initial claims, since they come into play at the end of a worker's UI spell rather than at the beginning. Return to text
16. As of mid-June, 26 states had announced plans to withdraw from FPUC in advance of its nationwide expiration (or had already done so). All but five of these states are withdrawing from PUA and PEUC, as well. See Coral Murphy Marcos (2021), "Here Are the States Eliminating Pandemic Unemployment Benefits, and When," The New York Times, June 15. Return to text
17. In addition to these factors, brief unemployment spells lasting less than four weeks can go unobserved if they fall in the space between the monthly CPS surveys. Such transient spells may be especially common in the pandemic labor market, as businesses alternately close and reopen in response to public-health conditions. Changes in the prevalence of short unemployment spells should not bias estimates of the stock of unemployed workers (the numerator in the unemployment rate), but they can distort measures of layoff activity and other labor market flows. Return to text
Price, Brendan M. (2021). "Why Have Initial Unemployment Claims Stayed So High for So Long?," FEDS Notes. Washington: Board of Governors of the Federal Reserve System July 02, 2021, https://doi.org/10.17016/2380-7172.2932.
Disclaimer: FEDS Notes are articles in which Board staff offer their own views and present analysis on a range of topics in economics and finance. These articles are shorter and less technically oriented than FEDS Working Papers and IFDP papers.