Minutes of the Federal Open Market Committee
March 17-18, 2015
In conjunction with the Federal Open Market Committee (FOMC) meeting held on March 17-18, 2015, meeting participants submitted their projections of the most likely outcomes for real output growth, the unemployment rate, inflation, and the federal funds rate for each year from 2015 to 2017 and over the longer run.1 Each participant's projection was based on information available at the time of the meeting plus his or her assessment of appropriate monetary policy and assumptions about the factors likely to affect economic outcomes. The longer-run projections represent each participant's assessment of the value to which each variable would be expected to converge, over time, under appropriate monetary policy and in the absence of further shocks to the economy. "Appropriate monetary policy" is defined as the future path of policy that each participant deems most likely to foster outcomes for economic activity and inflation that best satisfy his or her individual interpretation of the Federal Reserve's objectives of maximum employment and stable prices.
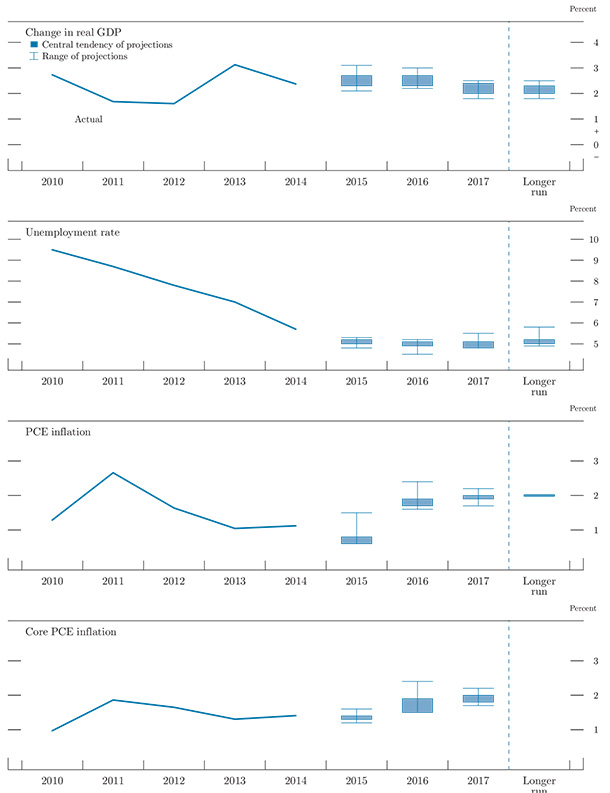
All FOMC participants but one expected that economic growth under appropriate policy would be somewhat faster in 2015 and in 2016 than their individual estimates of the U.S. economy's longer-run normal growth rate and at or near its longer-run rate in 2017 (table 1 and figure 1). Most participants projected that the unemployment rate would continue to decline in 2015 and 2016, and all participants projected that the unemployment rate would be at or below their individual judgments of its longer-run normal level by the end of 2017. Participants saw inflation, as measured by the four-quarter change in the price index for personal consumption expenditures (PCE), slowing this year but picking up notably next year; almost all of the participants projected that inflation would be at or close to the Committee's 2 percent longer-run objective in 2017.
Table 1. Economic projections of Federal Reserve Board members and Federal Reserve Bank presidents, March 2015
Percent
| Variable | Central tendency1 | Range2 | ||||||
|---|---|---|---|---|---|---|---|---|
| 2015 | 2016 | 2017 | Longer run | 2015 | 2016 | 2017 | Longer run | |
| Change in real GDP | 2.3 to 2.7 | 2.3 to 2.7 | 2.0 to 2.4 | 2.0 to 2.3 | 2.1 to 3.1 | 2.2 to 3.0 | 1.8 to 2.5 | 1.8 to 2.5 |
| December projection | 2.6 to 3.0 | 2.5 to 3.0 | 2.3 to 2.5 | 2.0 to 2.3 | 2.1 to 3.2 | 2.1 to 3.0 | 2.0 to 2.7 | 1.8 to 2.7 |
| Unemployment rate | 5.0 to 5.2 | 4.9 to 5.1 | 4.8 to 5.1 | 5.0 to 5.2 | 4.8 to 5.3 | 4.5 to 5.2 | 4.8 to 5.5 | 4.9 to 5.8 |
| December projection | 5.2 to 5.3 | 5.0 to 5.2 | 4.9 to 5.3 | 5.2 to 5.5 | 5.0 to 5.5 | 4.9 to 5.4 | 4.7 to 5.7 | 5.0 to 5.8 |
| PCE inflation | 0.6 to 0.8 | 1.7 to 1.9 | 1.9 to 2.0 | 2.0 | 0.6 to 1.5 | 1.6 to 2.4 | 1.7 to 2.2 | 2.0 |
| December projection | 1.0 to 1.6 | 1.7 to 2.0 | 1.8 to 2.0 | 2.0 | 1.0 to 2.2 | 1.6 to 2.1 | 1.8 to 2.2 | 2.0 |
| Core PCE inflation3 | 1.3 to 1.4 | 1.5 to 1.9 | 1.8 to 2.0 | 1.2 to 1.6 | 1.5 to 2.4 | 1.7 to 2.2 | ||
| December projection | 1.5 to 1.8 | 1.7 to 2.0 | 1.8 to 2.0 | 1.5 to 2.2 | 1.6 to 2.1 | 1.8 to 2.2 | ||
Note: Projections of change in real gross domestic product (GDP) and projections for both measures of inflation are percent changes from the fourth quarter of the previous year to the fourth quarter of the year indicated. PCE inflation and core PCE inflation are the percentage rates of change in, respectively, the price index for personal consumption expenditures (PCE) and the price index for PCE excluding food and energy. Projections for the unemployment rate are for the average civilian unemployment rate in the fourth quarter of the year indicated. Each participant's projections are based on his or her assessment of appropriate monetary policy. Longer-run projections represent each participant's assessment of the rate to which each variable would be expected to converge under appropriate monetary policy and in the absence of further shocks to the economy. The December projections were made in conjunction with the meeting of the Federal Open Market Committee on December 16-17, 2014.
1. The central tendency excludes the three highest and three lowest projections for each variable in each year. Return to table
2. The range for a variable in a given year includes all participants' projections, from lowest to highest, for that variable in that year. Return to table
3. Longer-run projections for core PCE inflation are not collected. Return to table
Figure 1. Central tendencies and ranges of economic projections, 2015-17 and over the longer run*
Accessible version of figure 1 | Return to figure 1
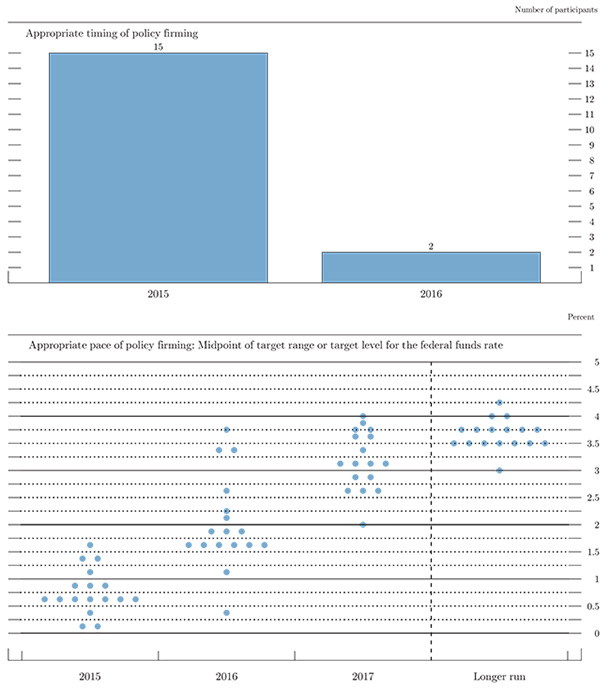
As shown in figure 2, all but two participants anticipated that it would be appropriate to begin raising the target range for the federal funds rate in 2015. Most expected that it would be appropriate to raise the target federal funds rate fairly gradually over the projection period as labor market conditions and inflation move toward values the Committee judges consistent with the attainment of its mandated objectives of maximum employment and stable prices. Most participants continued to expect that it would be appropriate for the federal funds rate to stay appreciably below its longer-run level after inflation and unemployment are near mandate-consistent levels, reflecting the effects of remaining headwinds holding back the recovery, along with other factors.
Figure 2. Overview of FOMC participants' assessments of appropriate monetary policy*
Accessible version of figure 2 | Return to figure 2
Most participants viewed the uncertainty associated with their outlooks for economic growth and the unemployment rate as broadly similar to the average level of the past 20 years. Most participants also judged the level of uncertainty about inflation to be broadly similar to the average level of the past 20 years, although several participants viewed it as higher. In addition, most participants continued to see the risks to the outlook for economic growth and for the unemployment rate as broadly balanced, though some viewed the risks to economic growth as weighted to the downside. Equal numbers of participants saw the risks to inflation as balanced or as weighted to the downside, while one judged these risks as tilted to the upside.
The Outlook for Economic Activity
Participants generally projected that, conditional on their individual assumptions about appropriate monetary policy, real gross domestic product (GDP) would grow in 2015 and 2016 at a pace somewhat faster than their estimates of its longer-run normal rate and at or near its longer-run rate in 2017. Participants pointed to a number of factors that they expected would contribute to solid real output growth over the next few years, including improving labor market conditions, strengthened household and business balance sheets, the boost to consumer spending from low energy prices, diminishing restraint from fiscal policy, and still-accommodative monetary policy.
Compared with their Summary of Economic Projections (SEP) contributions in December, all but a couple of participants revised down their projections of real GDP growth over the forecast period. A number of participants cited the further appreciation of the dollar and recent weakness in spending and production data as reasons for their revision. The central tendencies of participants' current projections for real GDP growth were 2.3 to 2.7 percent in 2015 and in 2016, and 2.0 to 2.4 percent in 2017. The central tendency of the projections of real GDP growth over the longer run was 2.0 to 2.3 percent, unchanged from December.
Most participants projected that the unemployment rate would continue to decline through 2016, and all projected that by the fourth quarter of 2017 the unemployment rate would be at or below their individual judgments of its longer-run normal level. The central tendencies of participants' forecasts for the unemployment rate in the fourth quarter of each year were 5.0 to 5.2 percent in 2015, 4.9 to 5.1 percent in 2016, and 4.8 to 5.1 percent in 2017. Compared with the December SEP, participants' projected paths for the unemployment rate generally shifted down slightly through 2017. Many participants noted that recent data pointing to faster-than-expected improvement in labor market conditions were an important factor underlying the downward revisions to their unemployment rate forecasts. More than half of the participants revised down their estimates of the longer-run normal rate of unemployment; as a result, the central tendency of these estimates shifted down to 5.0 to 5.2 percent. Several participants noted that still-subdued wage and price inflation despite the stronger-than-expected momentum in the labor market suggested a lower level of the longer-run normal unemployment rate than they had thought previously, and a couple mentioned research indicating that demographic groups with lower average unemployment rates have accounted for an increasing fraction of the labor force.
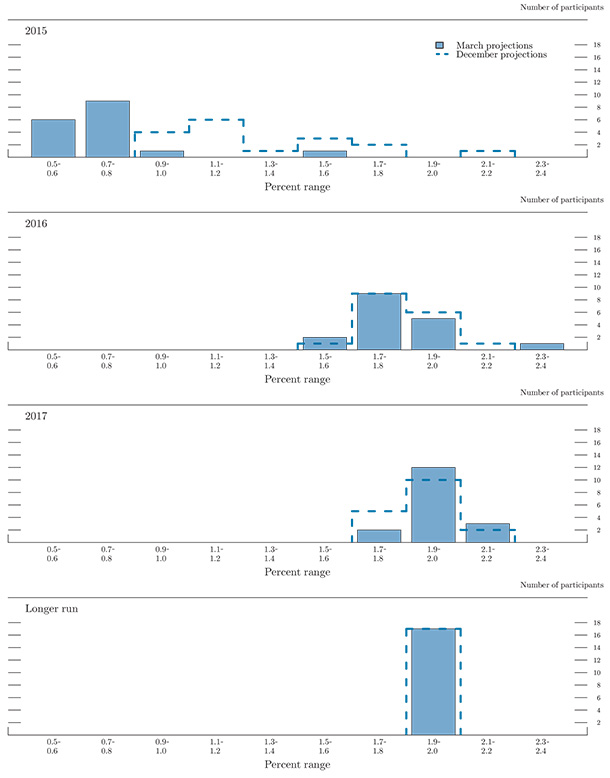
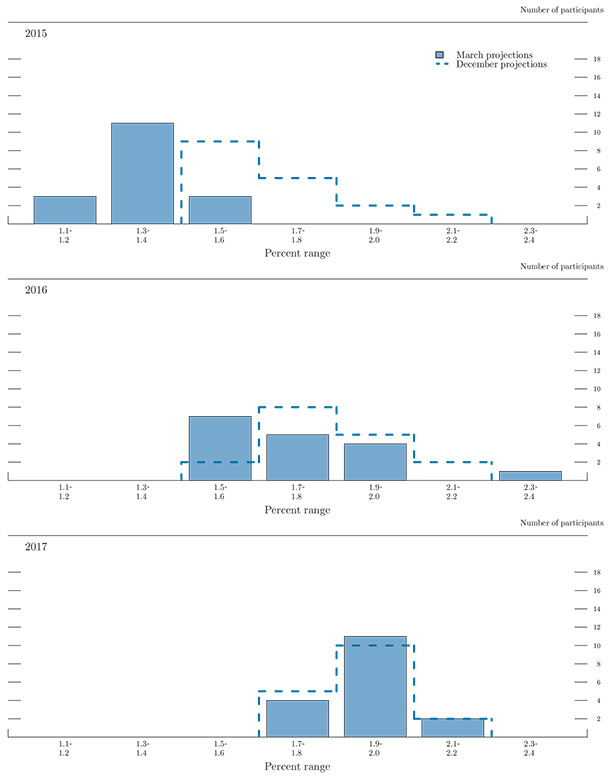
Figures 3.A and 3.B show the distribution of participants' views regarding the likely outcomes for real GDP growth and the unemployment rate through 2017. Some of the diversity of views reflected participants' individual assessments of the effects of lower oil prices on consumer spending and business investment, of the extent to which dollar appreciation would affect real activity, of the rate at which the forces that have been restraining the pace of the economic recovery would continue to abate, of the trajectory for growth in consumption as labor market slack diminishes, and of the appropriate path of monetary policy. Relative to the December SEP, the dispersion of participants' projections for real GDP growth was a bit narrower from 2015 through 2017, while for the unemployment rate, the dispersion was roughly unchanged.
Figure 3.A. Distribution of participants' projections for the change in real GDP, 2015-17 and over the longer run*
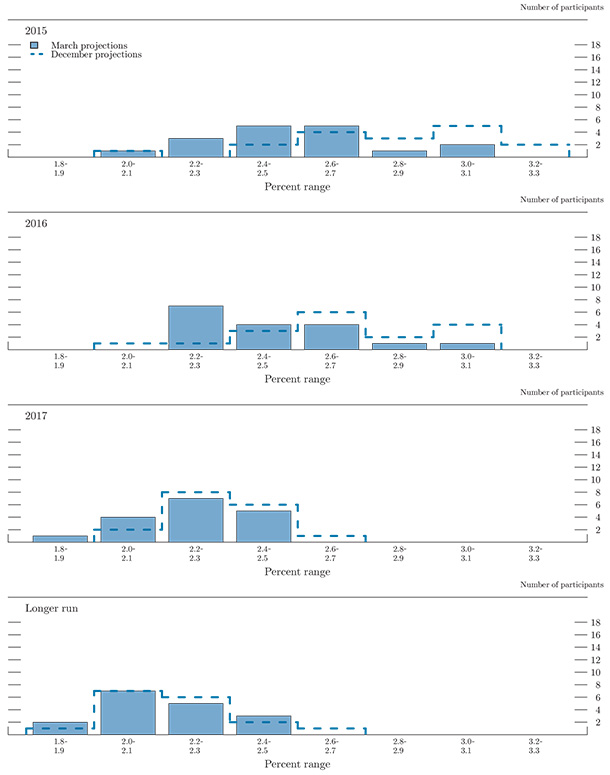
Accessible version of figure 3.A | Return to figure 3.A
Figure 3.B. Distribution of participants' projections for the unemployment rate, 2015-17 and over the longer run*
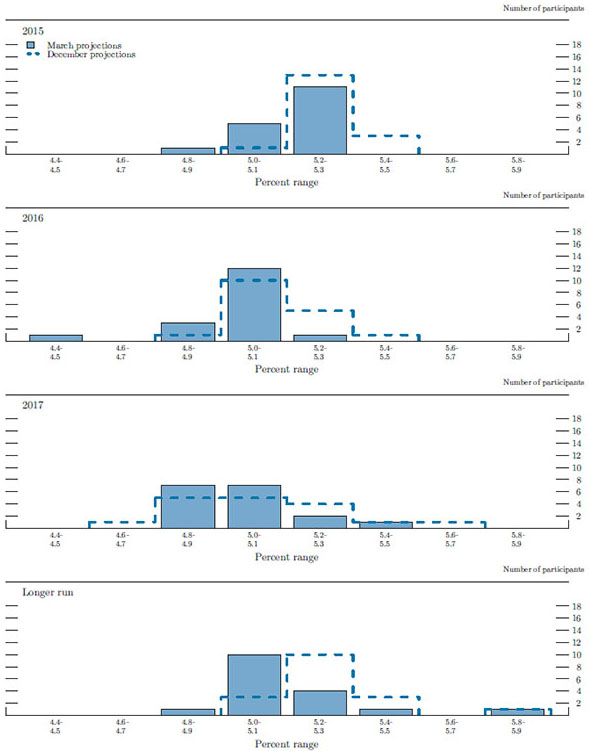
Accessible version of figure 3.B | Return to figure 3.B
The Outlook for Inflation
Compared with the December SEP, all participants marked down their projections for PCE inflation this year, noting that inflation had been running below their earlier projections and that significant declines in energy prices and import prices were putting temporary downward pressure on inflation. All participants saw PCE inflation picking up in 2016, and almost all saw inflation at or close to the Committee's 2 percent longer-run objective in 2017. All of the participants also marked down their projections for core PCE inflation this year, and nearly half revised down their projections for core PCE inflation in 2016 by 0.2 percentage point or more, with many noting that core inflation had run below their earlier projections in recent months and several citing declines in non-oil import prices and pass-through of declines in energy prices. Almost all expected core inflation to rise gradually over the projection period and to reach a level at or near 2 percent in 2017. The central tendencies for PCE inflation were 0.6 to 0.8 percent in 2015, 1.7 to 1.9 percent in 2016, and 1.9 to 2.0 percent in 2017, and the central tendencies for core PCE inflation were 1.3 to 1.4 percent in 2015, 1.5 to 1.9 percent in 2016, and 1.8 to 2.0 percent in 2017. Factors cited by participants as likely to contribute to a rise of inflation toward 2 percent included stable longer-term inflation expectations, steadily diminishing resource slack, a pickup in wage growth, the waning effects of declines in energy prices, and still-accommodative monetary policy.
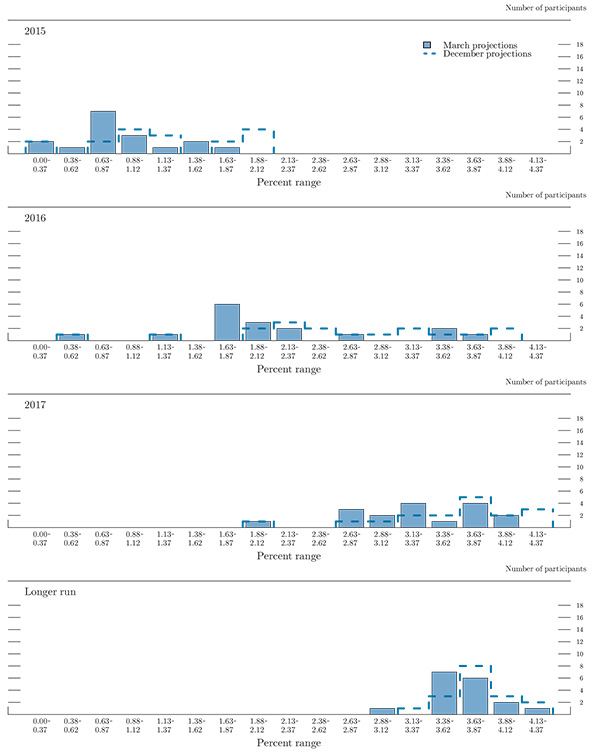
Figures 3.C and 3.D provide information on the distribution of participants' views about the outlook for inflation. The range of participants' projections for PCE inflation in 2015 narrowed somewhat compared with December. The range for PCE inflation in 2016 widened slightly, likely reflecting in part differences in participants' assessments of the effects of the declines in energy and import prices on the outlook for inflation. Similarly, the ranges for core PCE inflation narrowed in 2015 and widened slightly in 2016. The range for both measures in 2017 was relatively little changed and continued to show a very substantial concentration near the Committee's 2 percent longer-run objective by that time.
Figure 3.C. Distribution of participants' projections for PCE inflation, 2015-17 and over the longer run*
Accessible version of figure 3.C | Return to figure 3.C
Figure 3.D. Distribution of participants' projections for core PCE inflation, 2015-17*
Accessible version of figure 3.D | Return to figure 3.D
Appropriate Monetary Policy
Participants judged that it would be appropriate to raise the target range for the federal funds rate over the projection period as labor market conditions and inflation move toward values the Committee judges consistent with the attainment of its mandated objectives of maximum employment and price stability. As shown in figure 2, all but two participants anticipated that it would be appropriate to begin raising the target range for the federal funds rate during 2015. However, a large majority projected that the appropriate level of the federal funds rate would remain below their individual estimates of its longer-run normal level through 2017.
Most participants projected that the unemployment rate would be at or somewhat above their estimates of its longer-run normal level at the end of the year in which they judged the initial increase in the target range for the federal funds rate would be warranted. Almost all participants projected that inflation would be below the Committee's 2 percent objective that year, but they also saw inflation rising substantially closer to 2 percent in the following year.
Figure 3.E provides the distribution of participants' judgments regarding the appropriate level of the target federal funds rate at the end of each calendar year from 2015 to 2017 and over the longer run. The median values of the federal funds rate at the end of 2015, 2016, and 2017 decreased 50, 62, and 50 basis points, respectively, relative to December, to 0.63, 1.88, and 3.13 percent, while the mean values for those years declined 35, 52, and 32 basis points, respectively, to 0.78, 2.03, and 3.19 percent. Compared with December, the dispersion of the projections for the appropriate level of the federal funds rate was a bit narrower over the projection period.
Figure 3.E. Distribution of participants' judgments of the midpoint of the appropriate target range for the federal funds rate or the appropriate target level for the federal funds rate, 2015–17 and over the longer run*
Accessible version of figure 3.E | Return to figure 3.E
Most participants judged that it would be appropriate for the federal funds rate in 2017 to remain below its longer-run normal level, with nearly half of them projecting the federal funds rate in 2017 to be more than 1/2 percentage point lower than their estimates of its longer-run value. Participants provided a number of reasons why they thought it would be appropriate for the federal funds rate to remain below its longer-run normal level for some time after inflation and the unemployment rate were near mandate-consistent levels. These reasons included an assessment that the headwinds that have been holding back the recovery will continue to exert some restraint on economic activity at that time, that weak real activity abroad and the recent appreciation of the dollar are likely to continue to restrain U.S. net exports for some time, that residual slack in the labor market will still be evident in measures of labor utilization other than the unemployment rate, and that the risks to the economic outlook are asymmetric as a result of the constraints on monetary policy associated with the effective lower bound on the federal funds rate.
Relative to the December SEP, almost half of the participants revised down their estimates of the longer-run level of the federal funds rate, typically by 1/4 percentage point, with a lower assessment of the economy's longer-run potential growth rate generally cited as a contributing factor for those revisions. Though the median estimate of the longer-run normal federal funds rate was unchanged from December, the central tendency narrowed to 3.5 to 3.75 percent from 3.5 to 4.0 percent in December, and the range moved down a bit to 3.0 to 4.25 percent from 3.25 to 4.25 percent in December. All participants judged that inflation in the longer run would be equal to the Committee's inflation objective of 2 percent, implying that their individual judgments regarding the appropriate longer-run level of the real federal funds rate in the absence of further shocks to the economy ranged from 1.0 to 2.25 percent.
Participants' views of the appropriate path for monetary policy were informed by their judgments about the state of the economy, including the values of the unemployment rate and other labor market indicators that would be consistent with maximum employment, the extent to which the economy was currently falling short of maximum employment, the prospects for inflation to return to the Committee's longer-term objective of 2 percent, the implications of international developments for the domestic economy, the desire to minimize potential disruptions in financial markets, and the balance of risks around the outlook. Some participants also mentioned the prescriptions of various monetary policy rules as factors they considered in judging the appropriate path for the federal funds rate.
Uncertainty and Risks
Nearly all participants continued to judge the levels of uncertainty attending their projections for real GDP growth and the unemployment rate as broadly similar to the norms during the previous 20 years (figure 4).2 Most participants continued to see the risks to their outlooks for real GDP growth as broadly balanced, though some participants viewed the risks to real GDP growth as weighted to the downside. Those participants who viewed the risks as weighted to the downside cited, for example, concern about the limited ability of monetary policy at the effective lower bound to respond to further negative shocks to the economy or about the trajectory for economic growth abroad. Nearly all participants again judged the risks to the outlook for the unemployment rate to be broadly balanced.
Table 2. Average historical projection error ranges
Percentage points
| Variable | 2015 | 2016 | 2017 |
|---|---|---|---|
| Change in real GDP1 | ±1.6 | ±2.1 | ±2.0 |
| Unemployment rate1 | ±0.5 | ±1.2 | ±1.7 |
| Total consumer prices2 | ±0.9 | ±1.0 | ±1.0 |
Note: Error ranges shown are measured as plus or minus the root mean squared error of projections for 1995 through 2014 that were released in the spring by various private and government forecasters. As described in the box "Forecast Uncertainty," under certain assumptions, there is about a 70 percent probability that actual outcomes for real GDP, unemployment, and consumer prices will be in ranges implied by the average size of projection errors made in the past. For more information, see David Reifschneider and Peter Tulip (2007), "Gauging the Uncertainty of the Economic Outlook from Historical Forecasting Errors," Finance and Economics Discussion Series 2007-60 (Washington: Board of Governors of the Federal Reserve System, November); and Board of Governors of the Federal Reserve System, Division of Research and Statistics (2014), "Updated Historical Forecast Errors (PDF)," memorandum, April 9.
1. Definitions of variables are in the general note to table 1. Return to table
2. Measure is the overall consumer price index, the price measure that has been most widely used in government and private economic forecasts. Projection is percent change, fourth quarter of the previous year to the fourth quarter of the year indicated. Return to table
As in the December SEP, participants generally agreed that the levels of uncertainty associated with their inflation forecasts were broadly similar to historical norms. Almost half of participants viewed the risks to their inflation forecast as balanced. However, the risks were seen as tilted to the downside by an equal number of participants, an increase since the December SEP. These participants cited the possibility that the recent low levels of inflation could prove more persistent than anticipated or that the upward pressure on prices from inflation expectations might be weaker than assumed, or the judgment that, in current circumstances, it would be difficult for the Committee to respond effectively to low-inflation outcomes. Conversely, one participant saw upside risks to inflation, citing uncertainty about the timing and efficacy of the Committee's withdrawal of monetary policy accommodation.
Figure 4. Uncertainty and risks in economic projections*
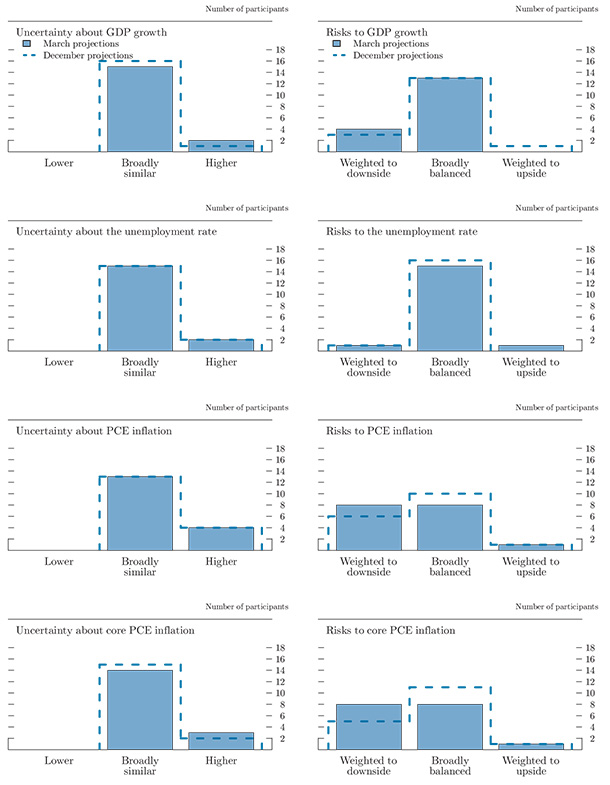
Accessible version of figure 4 | Return to figure 4
The economic projections provided by the members of the Board of Governors and the presidents of the Federal Reserve Banks inform discussions of monetary policy among policymakers and can aid public understanding of the basis for policy actions. Considerable uncertainty attends these projections, however. The economic and statistical models and relationships used to help produce economic forecasts are necessarily imperfect descriptions of the real world, and the future path of the economy can be affected by myriad unforeseen developments and events. Thus, in setting the stance of monetary policy, participants consider not only what appears to be the most likely economic outcome as embodied in their projections, but also the range of alternative possibilities, the likelihood of their occurring, and the potential costs to the economy should they occur.
Table 2 summarizes the average historical accuracy of a range of forecasts, including those reported in past Monetary Policy Reports and those prepared by the Federal Reserve Board's staff in advance of meetings of the Federal Open Market Committee. The projection error ranges shown in the table illustrate the considerable uncertainty associated with economic forecasts. For example, suppose a participant projects that real gross domestic product (GDP) and total consumer prices will rise steadily at annual rates of, respectively, 3 percent and 2 percent. If the uncertainty attending those projections is similar to that experienced in the past and the risks around the projections are broadly balanced, the numbers reported in table 2 would imply a probability of about 70 percent that actual GDP would expand within a range of 1.4 to 4.6 percent in the current year, 0.9 to 5.1 percent in the second year, and 1.0 to 5.0 percent in the third year. The corresponding 70 percent confidence intervals for overall inflation would be 1.1 to 2.9 percent in the current year, 1.0 to 3.0 percent in the second year and third years.
Because current conditions may differ from those that prevailed, on average, over history, participants provide judgments as to whether the uncertainty attached to their projections of each variable is greater than, smaller than, or broadly similar to typical levels of forecast uncertainty in the past, as shown in table 2. Participants also provide judgments as to whether the risks to their projections are weighted to the upside, are weighted to the downside, or are broadly balanced. That is, participants judge whether each variable is more likely to be above or below their projections of the most likely outcome. These judgments about the uncertainty and the risks attending each participant’s projections are distinct from the diversity of participants' views about the most likely outcomes. Forecast uncertainty is concerned with the risks associated with a particular projection rather than with divergences across a number of different projections.
As with real activity and inflation, the outlook for the future path of the federal funds rate is subject to considerable uncertainty. This uncertainty arises primarily because each participants assessment of the appropriate stance of monetary policy depends importantly on the evolution of real activity and inflation over time. If economic conditions evolve in an unexpected manner, then assessments of the appropriate setting of the federal funds rate would change from that point forward.
1. The president of the Federal Reserve Bank of Dallas did not participate in this FOMC meeting, and the incoming president of the Federal Reserve Bank of Philadelphia is scheduled to assume office on July 1. Helen E. Holcomb and Blake Prichard, First Vice Presidents of the Federal Reserve Banks of Dallas and Philadelphia, respectively, submitted economic projections. Return to text
2. Table 2 provides estimates of the forecast uncertainty for the change in real GDP, the unemployment rate, and total consumer price inflation over the period from 1995 through 2014. At the end of this summary, the box "Forecast Uncertainty" discusses the sources and interpretation of uncertainty in the economic forecasts and explains the approach used to assess the uncertainty and risks attending the participants' projections. Return to text