September 26, 2017
Why Persistent Employment Disparities Matter for the Economy's Health
Governor Lael Brainard
At "Disparities in the Labor Market: What Are We Missing?" a research conference sponsored by the Board of Governors of the Federal Reserve System, Washington, D.C.
I want to compliment the organizers and others for gathering an outstanding group of researchers and papers for this conference. Understanding why some groups persistently fare better than others in the job market and how these disparities may affect the economy's overall performance is vitally important to the Federal Reserve. While opportunity and inclusion have long been central to American values, it is increasingly clear that they are also central to the strength of our economy.1
As directed by the Congress, the Federal Reserve's dual mandate is to promote maximum employment and stable prices. In fulfilling its dual mandate, the Federal Open Market Committee (FOMC) has set a target of 2 percent for inflation but does not have a similarly fixed numerical goal for maximum employment. That is because the level of maximum employment depends on "nonmonetary factors that affect the structure and dynamics of the labor market," which "may change over time and may not be directly measurable."2 Understanding how close the labor market is to our full-employment goal requires consulting a variety of evidence along with a healthy dose of judgment. The recognition that maximum employment evolves over time to reflect changes in the economic landscape serves us well by requiring FOMC participants to develop a nuanced understanding of labor market developments.
This approach to maximum employment has allowed the FOMC to navigate the current expansion in a way that has likely brought more people back into productive employment than might have been the case with a fixed unemployment rate target based on pre-crisis standards. This is especially true at a time when the traditional Phillips curve relationship is flatter than in the past, which means that price inflation is likely to be less informative regarding labor market tightness than it was previously.3 It therefore seems particularly valuable to look beyond inflation and headline unemployment to assess the strength of the labor market. Even when aggregate economic statistics look strong, studying geographic areas and demographic groups that are not faring as well can point to ways of further improving the economy's performance.
The Federal Reserve is also keenly interested in disparities in employment, labor force participation, income, and wealth because they may have implications for the growth capacity of the economy. When we consider appropriate monetary policy, we need to have a good sense of how fast the economy can grow without fueling excessive price inflation. At a time when the retirement of the baby-boom generation looks likely to be something of a drag on the growth of the labor force, it is especially important to consider whether relatively low levels of employment and labor force participation for some prime working-age groups represent slack that, if successfully tapped, could increase the labor force and boost economic activity.
More broadly, when a person who was previously unemployed or discouraged secures a job, not only does it boost the economy, but that person also may gain a greater sense of economic security, self-sufficiency, and self-worth and be better able to invest in their family's future. With a richer understanding of economic or social barriers that inhibit labor market success and prosperity for some groups, we may better grasp how much these individuals can be helped by broad economic expansion and how much targeted intervention is required through other policy means.
There is also an important connection between the economy's potential growth rate and equality of opportunity. Large disparities in opportunity based on race, ethnicity, gender, or geography mean that the enterprise, exertion, and investments of households and businesses from different groups are not rewarded commensurately. To the extent that disparities in income and wealth across race, ethnicity, gender, or geography reflect such disparities in opportunity, families and small businesses from the disadvantaged groups will then underinvest in education or business endeavors, and potential growth will fall short of the levels it might otherwise attain.4
Aside from reducing the long-run productive potential of the economy, persistently high levels of income and wealth inequality may also have implications for the robustness of consumer spending, which accounts for roughly two-thirds of aggregate spending in the United States. The gaps in household income and wealth between the richest and poorest households are at historically high levels, as income and wealth have increasingly accrued to the very richest households. For example, results from the Federal Reserve's latest Survey of Consumer Finances (SCF), which is due to be released soon, indicate that the share of income held by the top 1 percent of households reached 24 percent in 2015, up from 17 percent in 1988. The share of wealth held by the top 1 percent rose to 39 percent in 2016, up from 30 percent in 1989.5 Some research suggests that widening income and wealth inequality may damp consumer spending in the aggregate, as the wealthiest households are likely to save a much larger proportion of any additional income they earn relative to households in lower income groups that are likely to spend a higher proportion on goods and services.6
Disparities by Race and Ethnicity
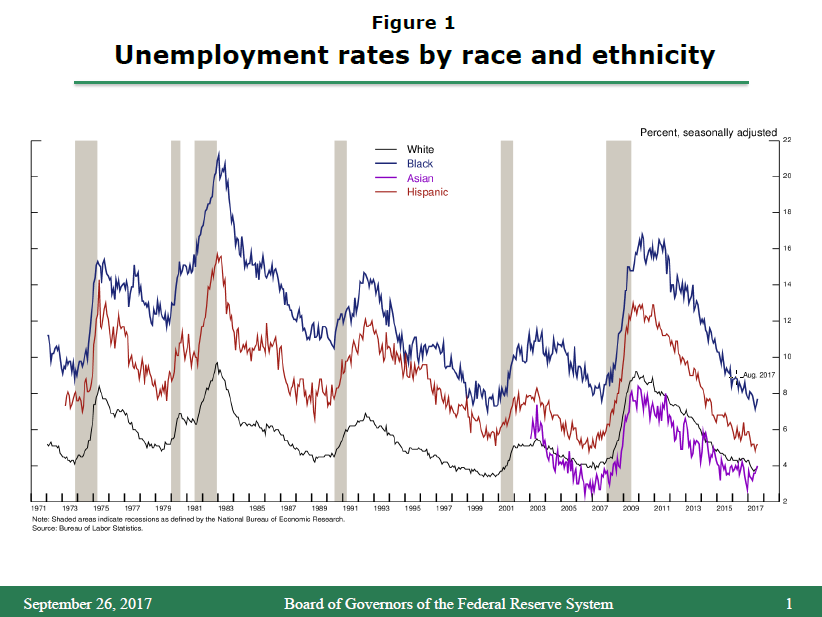
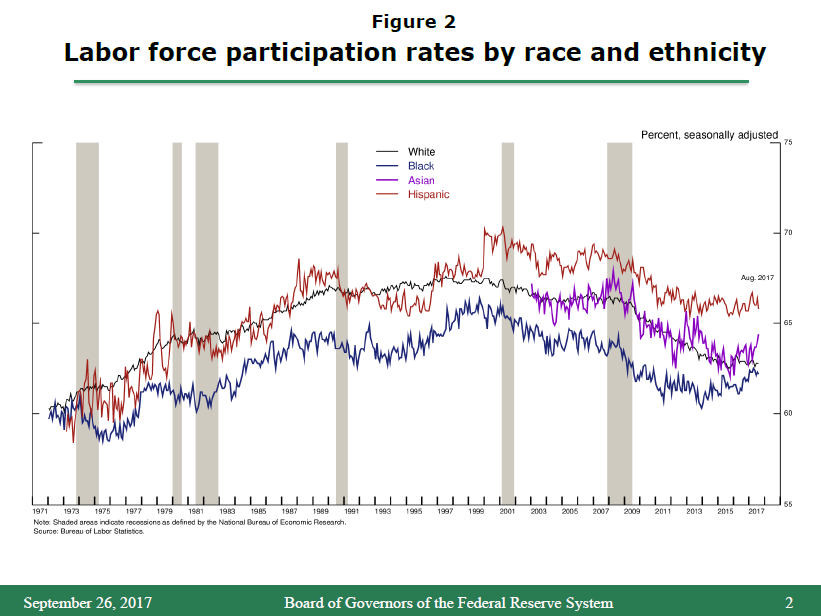
When we disaggregate the economy-wide labor market statistics, we find significant and persistent racial and ethnic disparities.7 In August, the national unemployment rate of 4.4 percent, which is low by historical standards, masked substantial differences across different demographic groups. As shown in figure 1, unemployment rates ranged from 3.9 percent for whites to 4 percent for Asians, 5.2 percent for Hispanics, and 7.7 percent for African Americans. Labor force participation rates, shown in figure 2, also differ substantially, although by less than unemployment rates, with the rate for African Americans lowest at 62.2 percent. These differences are not a recent development--similar differences across racial and ethnic dimensions have existed for as long as these data have been collected. Even more striking, a significant portion of the gaps in unemployment rates across racial and ethnic groups cannot be attributed to differences in their underlying characteristics, such as age and education levels.8
Although the differences in employment rates between racial and ethnic groups are still quite large, they have narrowed recently, after having widened considerably during the recession, and are near their lowest levels in decades. Differences in unemployment rates across racial and ethnic groups tend to widen sharply during recessions, as less advantaged groups shoulder an outsized share of total layoffs, and these differences shrink during recoveries. For example, in the second quarter of 2017, the unemployment rate for black adult men was a little more than 3 percentage points higher than for white adult men. This differential, while sizable, is nonetheless close to the smallest gap seen since comparable data became available in the mid-1970s. Differences in unemployment rates are similarly near historical lows for black women relative to white women, and for Hispanics relative to whites. Since racial disparities tend to get smaller throughout the course of an economic expansion, it seems likely that racial differences in unemployment rates will continue to shrink if the overall unemployment rate falls further.9
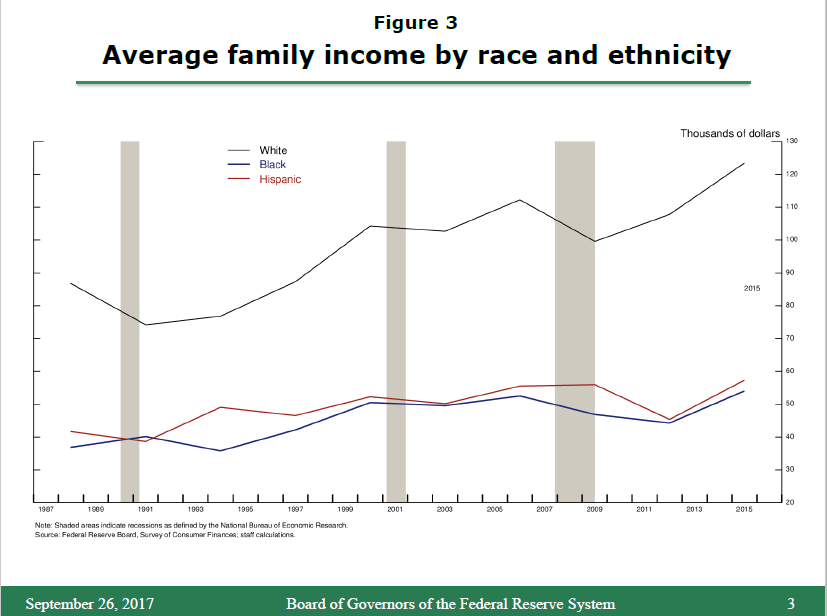
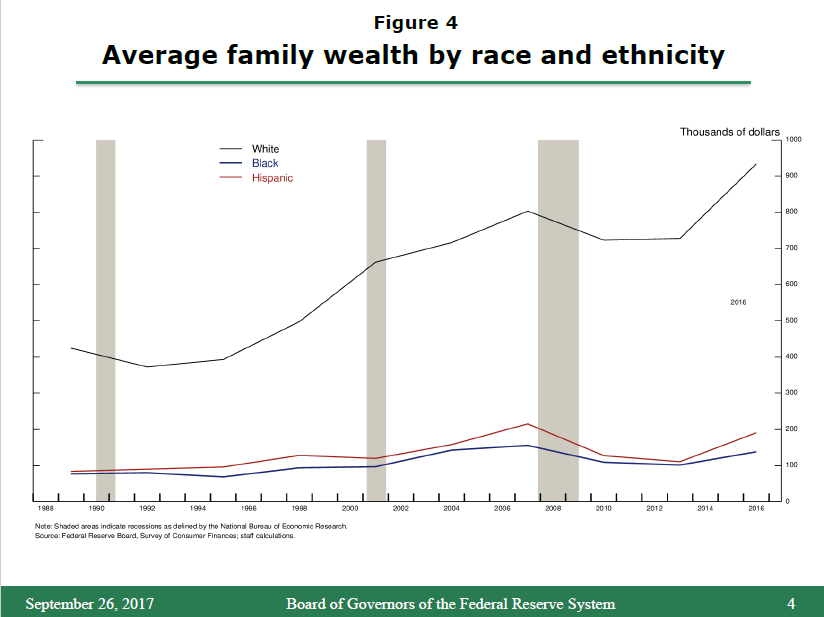
More broadly, the persistent disparities in employment outcomes are mirrored in significant and persistent racial and ethnic differences in families' income and wealth. According to forthcoming findings from the latest SCF and as shown in figure 3, the average income for white families in 2015 was about $123,000 per year, compared with $54,000 for black families and $57,000 for Hispanic families.10 Disparities in wealth, shown in figure 4, are even larger: Average wealth holdings for white families in 2016 were about $933,000, compared with $191,000 for Hispanic families and $138,000 for black families.11 Moreover, these racial and ethnic gaps in average family income and wealth have generally widened rather than narrowed over the past few decades. Based on SCF data, median family wealth has grown much more rapidly for white families than for other families over the past few decades, while median family incomes have risen by about the same amount for white, black, and Hispanic families.
As the economic expansion continues and brings more Americans off the sidelines and into productive employment, it seems likely that the positive trends in employment and participation rates for historically disadvantaged groups will continue. That said, the benefits of a lengthy recovery can only go so far, as the research points to some barriers to labor market outcomes for particular groups that appear to be structural. After controlling for sectoral and educational differences, the research suggests that these factors include discrimination as well as differences in access to quality education and informal social networks that may be an important source of information and support regarding employment opportunities.12 While the policy tools available to the Federal Reserve are not well suited to addressing the barriers that contribute to persistent disparities in labor market outcomes, understanding these barriers and efforts to address them is vital in assessing maximum employment as well as potential growth.
Geographic Disparities
The Federal Reserve System benefits not only from our engagement with research, statistics, and surveys, but also from our presence in communities all across America. This local presence, by design, provides valuable perspectives on how Americans in different communities are experiencing the economy and the varied challenges that lie beneath the aggregate numbers. While traveling around the country with our community development staff, I have been struck by the widening gulf between the economic fortunes of our large metropolitan areas and those of our small cities, towns, and rural areas.
The statistics bear this out. Over the past 30 years, the convergence in income across regions of the country has slowed dramatically.13 Much of the gains in employment, income, and wealth since the end of the recession, and more broadly over the past few decades, have accrued to workers and families in larger cities. Since some workers and families may find it difficult to move, this concentration of economic opportunities in larger cities may have adverse implications for the well-being of these households and, potentially, the growth capacity of the economy as a whole.
Although pockets of opportunity and poverty are found in large metropolitan and rural areas alike, a greater share of the new jobs and business establishments created during the recovery that followed the Great Recession have been in larger metro areas than was the case in previous recoveries.14 In countless rural towns and small cities we are seeing how a deep economic setback can leave a profound and long-lasting mark. These experiences challenge common assumptions about the ability of local economies to recover from a setback. This could be the legacy of the concentrated presence of an industry that experiences decline due to trade or technology, or it could be the byproduct of a lack of connectivity--whether by highways or broadband. Technological change, globalization, and other shifts in demand and costs are not new to the U.S. economy, but there are troubling signs that less diversified or connected localities have a diminished ability to adapt. And the evidence suggests that concentrated economic shocks and the associated labor market stress also have broader consequences for health and mortality.15
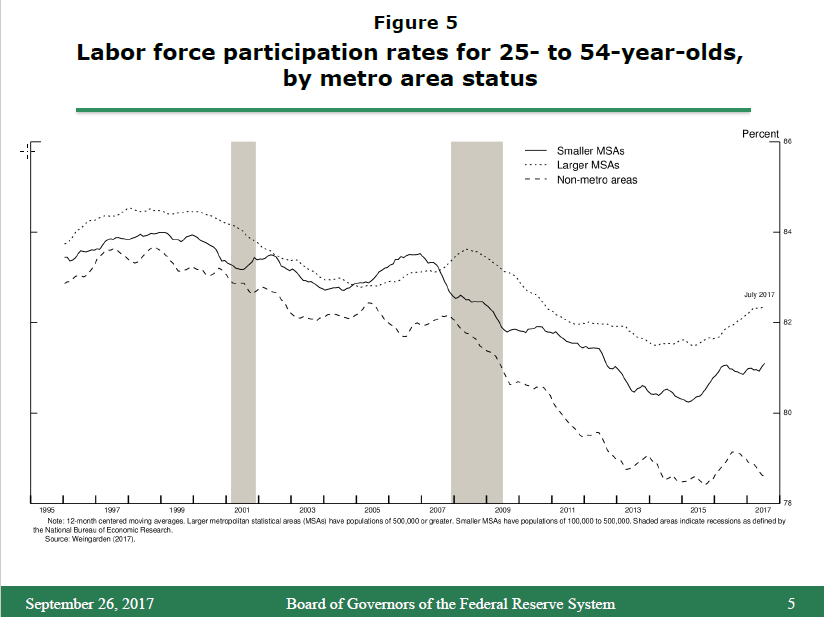
To provide some sense of the magnitudes, on average over the past year the unemployment rate for adults of prime working age (25 to 54) was about 1 percentage point higher in nonmetropolitan areas than in larger metro areas.16 But there is an even greater gap in labor force engagement, as can be seen in figure 5. The participation rate for prime-age adults in larger metro areas is currently nearly 3‑1/2 percentage points above the participation rate for prime-age adults in nonmetro areas. Interestingly, the geographic participation rate gap between more and less populous areas is apparent for all races as well as, in recent years, for both men and women.17
This gap in labor force participation between large cities and other areas has widened substantially since just before the Great Recession: Since 2007, the participation rate for prime-age adults in nonmetro areas has fallen nearly 3 percentage points, as compared with less than 1 percentage point on net in larger metro areas. Indeed, since 2007, the large decline in labor force participation in small metro and rural areas can explain about 40 percent of the economy-wide decline in prime-age labor force participation, even though these areas account for a smaller 25 percent of the population.
Before discussing possible contributors to this growing participation gap, it is important to emphasize that less populous areas appear to be falling behind in ways beyond these employment outcomes. Based on forthcoming SCF data, for example, the average annual income for families in metro areas was about $54,000 higher than for families in nonmetro areas, and the average wealth holdings for families in metro areas exceeded average wealth for families in nonmetro areas by nearly $500,000--and these gaps have more than doubled over the past three decades.18 i The gaps in many other measures of well-being have widened as well. In small towns and rural areas, college attainment rates have increased by less, disability rates have increased by more, divorce rates have risen by more, and mortality due to lung disease, cancer, or cardiovascular disease have either improved by less or worsened by more.19 Opioid use is also most prevalent in less populous metro and rural areas.20
I have seen many of these challenges first hand. In the small towns and hollers of eastern Kentucky, I visited with community development financial institutions that are trying to plug the gap in access to credit so that small businesses can continue operating and hiring locally, and so that families can access housing that is safe and affordable. In rural communities in the Mississippi Delta, I learned about diminished access to financial services available to rural residents, which can be a barrier to housing and business investment and pose vexing challenges to local governments. In Texas, I learned about barriers to economic development in the rural colonias areas on the southern border associated with underinvestment in physical and broadband infrastructure.21
As we consider the long-term health of the U.S. economy, it is important to better understand the decade-long decline in aggregate labor force participation. It is striking that in larger metro areas, the labor force participation rate for prime-age men has recently retraced much of the decline experienced during the recession, while in smaller metro and rural areas, the labor force participation rate remains well below its pre-recession level, with only modest improvements of late. The evidence increasingly suggests that much of the decline relates to a sustained decline in job opportunities for prime-age men, especially less-educated prime-age men, resulting in languishing wages relative to other groups.22 Indeed, it is notable that the striking decrease in labor force participation rates for nonmetro areas relative to large metro areas is highly concentrated among adults with no more than a high school education, who comprise a larger share of the prime-age population in nonmetro areas. The labor force participation rate for adults with no more than a high school education has fallen to 72 percent in nonmetro areas--about 3-1/2 percent below larger metro areas.23
Although the precise causes of this decline are still not fully settled, one contributing factor is advancing automation and computerization.24 Another contributor is globalization. For example, a growing body of research has identified a steeper decline in the employment and labor force attachment of prime-age men in areas of the country that specialized in the industries that were most negatively affected by increased imports from China.25
Research suggests that some of the decline in prime-age labor force participation relates to some individuals' reduced ability or desire to work, in some cases resulting directly from the ongoing decline in job opportunities. There are many reasons why some prime-age men may be less willing or able to work. One possibility is that the unusually long spells of nonemployment associated with the Great Recession may have eroded job skills and informal employment networks. Another possibility that is increasingly in focus is that physical disabilities, as well as sharp increases in opioid use, have increasingly inhibited some individuals from participating in the labor force. The fraction of prime-age men receiving disability insurance benefits has increased from 1 percent in the late 1970s to 3 percent more recently.26 Recent research also finds that among all prime-age men who are not in the labor force, about one-third reported having at least one disability, and nearly one-half reported taking pain medications daily.27 These supply-side explanations may be related to the drop in labor demand: the despair related to diminished prospects of a stable and quality job may lead to substance abuse and related health or mortality concerns.28
At least some of these explanations potentially relate to the growing divide between large metro areas and other areas of the country. As noted earlier, the opioid epidemic appears to be particularly acute in smaller cities and rural areas. In addition, employment in non-metro areas tends to be more concentrated in manufacturing, which is the sector that has experienced the largest decline in employment from automation and globalization.29 Similarly, research suggests that workers in less populous areas have been more likely to be directly affected by increased import competition from China due to the geographical distribution of industries.30 And for many less populous areas, job opportunities are less diverse than in bigger cities, so that when a plant shuts down, there are fewer local alternative job opportunities for unemployed workers, especially with comparable levels of employment security or benefits.
These striking results naturally raise the question of whether we are seeing heightened migration from the less populous areas to the larger metros with greater economic opportunity. A conventional assumption in economics is that regional differences should narrow over time as workers move toward areas where jobs are more plentiful and wages are higher.31 In reality, Americans' propensity to move is currently at its lowest level in many decades. In 2016, the fraction of the population that had moved within the United States in the past year was 11 percent, down from 17 percent or more in the early 1980s, with the steepest decline in the fraction of people moving longer distances, across county or state lines.32 The evidence suggests that the decline in geographic mobility cannot be fully explained by population aging, by the housing boom and bust, by changes in the composition of industries, by the increasing ease of telecommuting from longer distances, or by the rise in dual-earner households which may make work-related relocation more difficult. Some of the decline may be related to changes in the labor market, perhaps because workers are more likely to perceive that job opportunities are no better elsewhere, and consequently that the labor market returns to switching jobs or locations--in terms of better wages or higher job quality--have declined.33 Also, zoning requirements may be boosting housing costs in cities where job opportunities are most abundant, such as San Francisco, pricing out many potential workers and inhibiting migration.34
Whatever the reason, the fact that families are less likely to move now than in the past suggests that many of those in less populous areas are not able to access the economic opportunity present in denser and more diversified large metropolitan areas at a time when the gap in labor market outcomes for larger metros relative to other areas continues to grow.
Federal Reserve Work on Labor Market Disparities
The Federal Reserve is deeply engaged in understanding disparities through our data collection, research collaboration, and community development work. One way the Federal Reserve seeks to obtain a clearer picture is by collecting data ourselves. For instance, some of the data I have cited today come from the Federal Reserve's triennial Survey of Consumer Finances, which provides detailed information on income and wealth holdings by demographic groups. The Survey of Household Economics and Decisionmaking provides a portrait of household finances, employment, housing, and debt; the Survey of Young Workers provides insights into younger adults' employment experiences soon after entering the labor force; and the Enterprising and Informal Work Activities Survey provides information about income generating activities that are often outside the scope of other employment and income surveys.35
Across the Federal Reserve System, a variety of initiatives are aimed at understanding economic disparities and how to foster more-inclusive growth. The Opportunity and Inclusive Growth Institute at the Federal Reserve Bank of Minneapolis brings together researchers from a variety of fields to analyze barriers to economic opportunity and advancement. The Economic Growth and Mobility Project at the Federal Reserve Bank of Philadelphia aims to bring together researchers with community stakeholders to focus on differences in poverty and economic mobility across demographic characteristics. The Investing in America's Workforce Initiative is a collaboration between the Federal Reserve System and academic research institutions to promote investment in workforce skills that better align with employers' needs.36
All of that brings me to today's conference, which I am confident will make an important contribution to this mission. I am heartened to see so many researchers and practitioners from a variety of backgrounds focused on these important issues. This conference is part of our efforts to hear from experts with diverse backgrounds and perspectives to better understand the nature and implications of labor market disparities.
A deeper understanding of labor market disparities is central to the mission of the Federal Reserve because it may help us better assess full employment, where resources may be underutilized, and the likely evolution of the labor market and overall economic activity. We look forward to hearing what you have to say about these important questions and learning what other questions are in need of attention.
References
Aaronson, Stephanie, Tomaz Cajner, Bruce Fallick, Felix Galbis-Reig, Christopher Smith, and William Wascher (2014). "Labor Force Participation: Recent Developments and Future Prospects," Brookings Papers on Economic Activity, Fall, pp. 197-255.
Acemoglu, Daron, David Autor, David Dorn, Gordon H. Hanson, and Brendan Price (2016). "Import Competition and the Great U.S. Employment Sag of the 2000s," Journal of Labor Economics, vol. 34 (part 2, January), S141-98.
Acemoglu, Daron, and Pascual Restrepo (2017). "Robots and Jobs: Evidence from U.S. Labor Markets (PDF)," unpublished paper, March 17.
Adamy, Janet, and Paul Overberg (2017). "Rural America is the New 'Inner City'," Wall Street Journal, May 26.
Alichi, Ali, Kory Kantenga, and Juan Solè (2016). "Income Polarization in the United States (PDF)," IMF Working Paper 16/121. Washington: International Monetary Fund.
Autor, David (2010). "The Polarization of Job Opportunities in the U.S. Labor Market: Implications for Employment and Earnings (PDF)." Washington: Center for American Progress and Hamilton Project.
Autor, David, David Dorn, and Gordon Hanson (2013). "The China Syndrome: Local Labor Market Effects of Import Competition in the United States," American Economic Review, vol. 103 (October), pp. 1553-97.
Autor, David, David Dorn, and Gordon Hanson (2015). "Untangling Trade and Technology: Evidence from Local Labor Markets," Economic Journal, vol. 125 (May), pp. 621-46.
Bernstein, Jared (2013). "The Impact of Inequality on Growth." Washington: Center for American Progress.
Blanchard, Olivier (2016). "The U.S. Phillips Curve: Back to the 60s? (PDF)" Policy Brief PB16-1. Washington: Peterson Institute for International Economics, January.
Blanchard, Olivier and Lawrence Katz (1992). "Regional Evolutions (PDF)," Brookings Papers on Economic Activity, no. 1, pp. 1-75.
Brainard, Lael (2015). "Economic Outlook and Monetary Policy," speech delivered at the 57th National Association for Business Economics Annual Meeting, Washington, October 12.
Brainard, Lael (2017). "Why Opportunity and Inclusion Matter for America's Economic Strength," speech delivered at the Opportunity and Inclusive Growth Institute Conference, sponsored by the Federal Reserve Bank of Minneapolis, Minneapolis, Minnesota, May 22.
Bricker, Jesse, Lisa J. Dettling, Alice Henriques, Joanne W. Hsu, Lindsay Jacobs, Kevin B. Moore, Sarah Pack, John Sabelhaus, Jeffrey Thompson, and Richard A. Windle (forthcoming). "Changes in U.S. Family Finances from 2013 to 2016: Evidence from the Survey of Consumer Finances," Federal Reserve Bulletin.
Cajner, Tomaz, Tyler Radler, David Ratner, and Ivan Vidangos (2017). "Racial Gaps in Labor Market Outcomes in the Last Four Decades and over the Business Cycle (PDF)," Finance and Economics Discussion Series 2017-071. Washington: Board of Governors of the Federal Reserve System.
Case, Anne and Angus Deaton (2015). "Rising Morbidity and Mortality in Midlife among White Non-Hispanic Americans in the 21st Century," Proceedings of the National Academy of Sciences, vol. 112 (December), pp. 15078-83.
-------- (2017). "Mortality and Morbidity in the 21st Century (PDF)," Brookings Papers on Economic Activity, Spring, pp. 397-452.
Council of Economic Advisors (2014). "The Labor Force Participation Rate since 2007: Causes and Policy Implications (PDF)." Washington: Council of Economic Advisors, Executive Office of the President of the United States.
-------- (2016). "The Long-Term Decline in Prime-Age Male Labor Force Participation (PDF)." Washington: Council of Economic Advisors, Executive Office of the President of the United States.
Economic Innovation Group (2016). The New Map of Economic Growth and Recovery (PDF). Washington: EIG, May.
Fryer, Jr., Roland G. (2011). "Racial Inequality in the 21st Century: The Declining Significance of Discrimination," in David Card and Orley Ashenfelter, eds., Handbook of Labor Economics, vol. 4b. Amsterdam: North Holland, pp. 855‑971.
Ganong, Peter, and Daniel W. Shoag (2017). "Why Has Regional Income Convergence in the U.S. Declined?" National Bureau of Economic Research Working Paper No. 23609.
Goetz, Stephen, Mark Partridge, and Heather Stephens (2017). "The Economic Status of Rural America in the Trump Era," MPRA Paper 77830. Munich: Munich Personal RePEc Archive, March.
Guy, Jr., Gery P., Kun Zhang Kun, Michele K. Bohm, Jan Losby, Brian Lewis, Randall Young, Louise B. Murphy, and Deborah Dowell (2017). "Vital Signs: Changes in Opioid Prescribing in the United States, 2006–2015 (PDF)," Morbidity and Mortality Weekly Report, vol. 66 (July 7), pp. 697-704.
Herkenhoff, Kyle F., Lee E. Ohanian, and Edward C. Prescott (2017). "Tarnishing the Golden and Empire States: Land-Use Regulations and the U.S. Economic Slowdown." NBER Working Paper No. 23790. Cambridge, Mass.: National Bureau of Economic Research, September.
Kaplan, Greg, and Sam Schulhofer-Wohl (2017). "Understanding the Long-Run Decline in Interstate Migration," International Economic Review, vol. 58 (February) pp. 57-94.
Kiley, Michael T. (2015). "Low Inflation in the United States: A Summary of Recent Research," FEDS Notes. Washington: Board of Governors of the Federal Reserve System, November 23.
Krueger, Alan (forthcoming). "Where Have All the Workers Gone? An Inquiry into the Decline of the U.S. Labor Force Participation Rate." Brookings Papers on Economic Activity. (The conference draft is available at https://www.brookings.edu/bpea-articles/where-have-all-the-workers-gone-an-inquiry-into-the-decline-of-the-u-s-labor-force-participation-rate.)
Marrero, Gustavo, and Juan Rodrìguez (2013). "Inequality of Opportunity and Growth," Journal of Development Economics, vol. 104 (September), pp. 107-22.
Molloy, Raven, Christopher L. Smith and Abigail Wozniak (2011). "Internal Migration in the United States," Journal of Economic Perspectives, vol. 25 (Summer), pp. 173-96.
-------- (2017). "Job Changing and the Decline in Long-Distance Migration in the United States," Demography, vol. 54 (April), pp. 631-53.
Pierce, Justin R. and Peter K. Schott (2016a). "The Surprisingly Swift Decline of U.S. Manufacturing Employment," American Economic Review, vol. 106 (July), pp. 1632-62.
-------- (2016b). "Trade Liberalization and Mortality: Evidence from U.S. Counties (PDF)," Finance and Economics Discussion Series 2016-094. Washington: Board of Governors of the Federal Reserve System, November.
Ritter, Joseph A., and Lowell J. Taylor (2011). "Racial Disparity in Unemployment," Review of Economics and Statistics, vol. 93 (February), pp. 30-42.
Sampson, Robert J. (2016). "Individual and Community Economic Mobility in the Great Recession Era: The Spatial Foundations of Persistent Inequality (PDF)," in Federal Reserve Bank of St. Louis and Board of Governors of the Federal Reserve System, eds., Economic Mobility: Research and Ideas on Strengthening Families, Communities, and the Economy. St. Louis: Federal Reserve Bank of St. Louis, pp. 259-87.
Semega, Jessica L., Kayla R. Fontenot, and Melissa A. Kollar (2017). "Income and Poverty in the United States: 2016 (PDF)," Current Population Reports, pp. 60-259. Washington: U.S. Census Bureau, September, .
Weingarden, Alison (2017). "Labor Market Outcomes in Metropolitan and Non-metropolitan Areas: Signs of Growing Disparities," FEDS Notes. Washington: Board of Governors of the Federal Reserve System, September 25.
Yellen, Janet L. (2015). "So We All Can Succeed: 125 Years of Women's Participation in the Economy," speech delivered at "125 Years of Women at Brown," a conference sponsored by Brown University, Providence, Rhode Island, May 5.
1. I am grateful to Christopher Smith for his assistance in preparing this text. The remarks represent my own views, which do not necessarily represent those of the Federal Reserve Board or the Federal Open Market Committee. Return to text
2. The FOMC's Statement on Longer-Run Goals and Monetary Policy Strategy is available on the Board's website at https://www.federalreserve.gov/monetarypolicy/files/fomc_longerrungoals.pdf. Return to text
3. For more on the Phillips curve and its ability to provide information on labor-market slack, see Brainard (2015), Blanchard (2016), and Kiley (2015). Return to text
4. For more on inequality of opportunity see Marrero and Rodriquez (2013). Return to text
5. Staff calculations from forthcoming SCF data (to be released on September 27); for additional analysis of these data, see Bricker and others (forthcoming). Return to text
6. See Bernstein (2013) and Alichi, Kantenga, and Solè (2016) for more on the potential link between income and wealth inequality and consumer spending. Return to text
7. For a discussion of gender disparities, see Yellen (2015). Return to text
8. See Cajner and others (2017) for more on racial gaps and the labor market. Return to text
9. Data on recent estimates of unemployment rates for adult men (20 years and older) by race and ethnicity are available from the Bureau of Labor Statistics. Historical gaps are provided by Cajner and others (2017). Return to text
10. Staff calculations from forthcoming SCF data. Recent estimates of household income from Current Population Survey data and reported by the Census in Semega, Fontenot, and Kollar (2017) are qualitatively similar, in that between 2013 and 2016 for both sets of data, family income has increased for whites, blacks, and Hispanics (with greater increases, in percentage terms, for black and Hispanic families). Return to text
11. Racial and ethnic differences in median income and wealth are somewhat smaller. For example, in 2016 median income for white families was about $61,000, compared with $35,000 for black families and $39,000 for Hispanic families. Median wealth was about $171,000 for white families, compared with about $20,000 for black and Hispanic families. The larger gap in average income and wealth than median income and wealth reflects a greater concentration of income and wealth among the wealthiest white families than for other races and ethnicities. Return to text
12. For example, see Fryer (2011) and Ritter and Taylor (2011). Return to text
13. See Ganong and Shoag (2017) and references therein for more on the decline in income convergence. Return to text
14. See Goetz, Partridge, and Stephens (2017) and Economic Innovation Group (2016) for details on growing regional differences during the recovery. Return to text
15. See Autor, Dorn, and Hanson (2013) and Pierce and Schott (2016b). Return to text
16. Larger metro areas are defined as metropolitan statistical areas (MSAs) with a population of 500,000 or larger, while smaller metro areas are MSAs with population between 100,000 and 500,000, and nonmetro areas are the remainder; see Weingarden (2017). Return to text
17. This gap appears to be a post-crisis phenomenon for women, while for men the gap began to widen in the 1990s. Return to text
18. Staff estimates from forthcoming SCF data. Although the difference in average income and wealth has grown, there has been little change in differences in median family income and wealth in larger metros relative to other areas. The widening gap for average income and wealth, but not for median income and wealth, is because in larger metro areas income and wealth has become increasingly held by wealthier families. Return to text
19. These statistics are provided in Adamy and Overberg (2017). Return to text
20. See Guy, Jr., and others (2017). Return to text
21. See the Brainard (2017) speech on opportunity and inclusion. Return to text
22. Most analysis suggests that at least half of the decline in the aggregate labor force participation rate since 2007 is attributable to the aging of the population, with a significant portion of the decline that is not related to aging attributable to a longer-run decline in participation for younger individuals and prime-age men; for example, see Aaronson and others (2014) and the Council of Economic Advisors (2014). For an overview of factors potentially attributable to the decline in labor force participation of prime-age men, see the Council of Economic Advisors (2016). Return to text
23. These estimates are based on data from Weingarden (2017). Return to text
24. For an overview of factors that have potentially impacted job opportunities for this group, see Autor (2010). For examples of research on the recent labor market effects of technology and automation, see Autor, Dorn, and Hanson (2015) and Acemoglu and Restrepo (2017). Return to text
25. For national-level estimates of the labor market effects from cheaper Chinese imports, see Pierce and Schott (2016a) and Acemoglu and others (2016). For evidence related to cross-country differences in these effects, see Autor, Dorn, and Hanson (2013), and Pierce and Schott (2016b). Return to text
26. See Council of Economic Advisors (2016). Return to text
27. Krueger (forthcoming) describes evidence from a variety of surveys showing that a significant fraction of prime-age men who are out of the labor force report having pain, being in poor health, or taking medication related to this pain, and that these behaviors are far more common among prime-age men than prime-age women. Return to text
28. See Case and Deaton (2015, 2017). Return to text
29. Based on staff analysis of publically available data from the Bureau of Economic Analysis on metropolitan and nonmetropolitan employment by industry. Return to text
30. This observation reflects unpublished calculations from Pierce and Schott (2016b). Return to text
31. See Blanchard and Katz (1992). Return to text
32. Data on internal migration rates come from the Current Population Survey and are published annually by the Census Bureau; see "Table A-1. Annual Geographic Mobility Rates, by Type of Movement: 1948-2016." Return to text
33. For a discussion of the multidecade decline in internal migration and its potential causes, see Molloy, Smith, and Wozniak (2011, 2017) and Kaplan and Schulhofer-Wohl (2017). Return to text
34. See Ganong and Shoag (2017) and Herkenhoff, Ohanian, and Prescott (2017). Return to text
35. Further information on these surveys are found on the Board's website; see the Survey of Consumer Finances; the Survey of Household Economics and Decisionmaking; the Survey of Young Workers; and the Survey of Enterprising and Informal Work Activities (PDF). Return to text
36. For information about the Opportunity and Inclusive Growth Institute, see https://www.minneapolisfed.org/institute, for information about the Economic Growth and Mobility Project, see https://www.philadelphiafed.org/egmp, and for information about the America's Workforce Initiative, see https://www.investinwork.org. Return to text
i. Note. On September 27, 2017, a typo was corrected to change $25,000 to $54,000 in the following sentence on page 9: "Based on forthcoming SCF data, for example, the average annual income for families in metro areas was about $54,000 higher than for families in nonmetro areas, and the average wealth holdings for families in metro areas exceeded average wealth for families in nonmetro areas by nearly $500,000--and these gaps have more than doubled over the past three decades." The original number incorrectly stated the median instead of the mean. Return to text