EFA: State Pensions
State and Local Government Defined Benefit Pension Plans: State-level Detail
These tables and maps provide state-level detail on the funding status of state and local government employee defined benefit (DB) retirement plans, complementing the aggregate data reported in Table L.120.b of the Financial Accounts of the United States. The table shows state-level detail on pension assets, liabilities and several measures of funding status. The interactive visualizations allow users to explore state-level differences in the assets, liabilities, and funding levels of state and local government pension plans, as well as how these measures have changed in recent years. Additional detail on the measurement of state and local government defined benefit pensions is documented in an associated FEDS Note: State and Local Pension Funding in the Enhanced Financial Accounts.
Interactive Data Visualizations
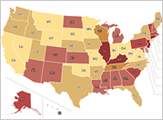
Explore interactive maps of state and local government pension funding ratios and funding status by state and year. Watch how they change over time.
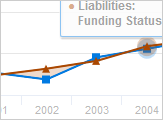
View interactive timeline charts by state. Choose which states to compare.
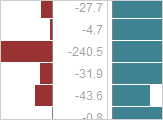
Examine all state and local government pension data in sortable bar charts.

Use interactive line charts to select and compare states. Select and compare assets, liabilities, and different measures of pension funding.
Documentation
Data on state and local government defined benefit plan assets are derived from the Census Bureau’s Annual Survey of Public Pensions. The Census survey reports plan assets at market value as of the end of the second quarter. The end-of-the-fourth-quarter assets are from aggregate U.S. state and local pension assets reported in the Financial Accounts of the United States which are benchmarked annually to the Census data. Each state’s end-of-the-fourth-quarter share of aggregate assets is derived from Census second quarter data and averaged over the current year and the next year.
Data on state and local government pension liabilities comes from the Bureau of Economic Analysis (BEA)'s supplemental estimates of state and local government defined benefit pension plans, which is the same source used in the Financial Accounts of the U.S. State-level revenue figures, which include revenue for both state and local governments, are obtained from the Census Survey of State & Local Government Finances. State-level revenue data is not available for 2001 and 2003. Data for state-level GDP comes from the BEA's All Industry Total Annual GDP by State series, included in the BEA's Regional Economic Accounts.
Note that as of September 2018, the Bureau of Economic Analysis changed the method used to estimate state and local government pension liabilities to a projected benefit obligation (PBO) basis; previously, they were presented on an accumulated benefit obligation (ABO) basis. For more information see BEA’s Preview of the 2018 Comprehensive Update of the National Income and Product Accounts. This change in methodology resulted in a significant increase in the state and local pension liabilities that are shown in both the Financial Accounts and in this EFA project. Historical data for this EFA project based on the ABO method for valuing pension liabilities are available through 2015 at the following link: https://federalreserve.gov/releases/z1/dataviz/download/zips/efa-state-pension-tables-annual-historical-20180111.zip.