FEDS Notes
July 15, 2022
An Analysis of the Interest Rate Risk of the Federal Reserve’s Balance Sheet, Part 1: Background and Historical Perspective1
Alyssa Anderson, Dave Na, Bernd Schlusche, and Zeynep Senyuz
As part of its implementation of monetary policy, the Federal Reserve (Fed) holds Treasury securities and agency mortgage-backed securities (MBS) in the System Open Market Account (SOMA). The market value of these securities and the Fed's income fluctuate with changes in interest rates. As such, the ongoing increases in the policy rate to address inflationary pressures are expected to put downward pressure on the Fed's net income. Also, the associated increases in market interest rates are projected to reduce the market value of the Fed's securities holdings in the near-term. The Fed's monetary policy objectives, as mandated by Congress, are to achieve maximum employment and price stability. Ancillary effects of rising interest rates on the SOMA portfolio's unrealized gain or loss position or the Fed's income do not have any implications for how the Fed conducts monetary policy and do not impinge on its ability to meet its financial obligations.
In this first note of a two-note series, we explain the concepts related to the SOMA portfolio's market value and the Fed's income and discuss their evolution in recent years. In the second note, we quantify the interest rate risk of the SOMA portfolio and the Fed's income by providing illustrative projections of the Fed's balance sheet and income under a wide range of interest rate paths associated with different macroeconomic outcomes.
What is the Unrealized Gain or Loss Position of the SOMA Portfolio?
The unrealized gain or loss position of the securities in the SOMA portfolio is the difference between the market value of the securities and their amortized cost.2 The market value, or the fair value, of the Fed's securities portfolio at any point reflects the prices of the securities that would be received if they were sold in orderly market transactions. When the Fed purchases a security, the security is purchased at the prevailing market value at that time, often for more or less than its par or face value. The difference between the purchase price and the face value—the premium or the discount on that security—is recorded on the balance sheet to be amortized over the life of the security. The security's amortized cost is defined as the purchase price less the amount of the premium or discount that has been already recognized, and it ultimately converges to its face value at maturity.3
The market value of Treasury securities and agency MBS held in the SOMA changes over time as interest rates move up or down. When interest rates rise, the market value of the securities declines, resulting in a decrease in the unrealized position; when interest rates fall, the unrealized position increases. This inverse relationship between interest rates and the unrealized position is apparent in Figure 1, which shows the 10-year Treasury yield and the SOMA's quarter-end unrealized gain or loss since 2012.4
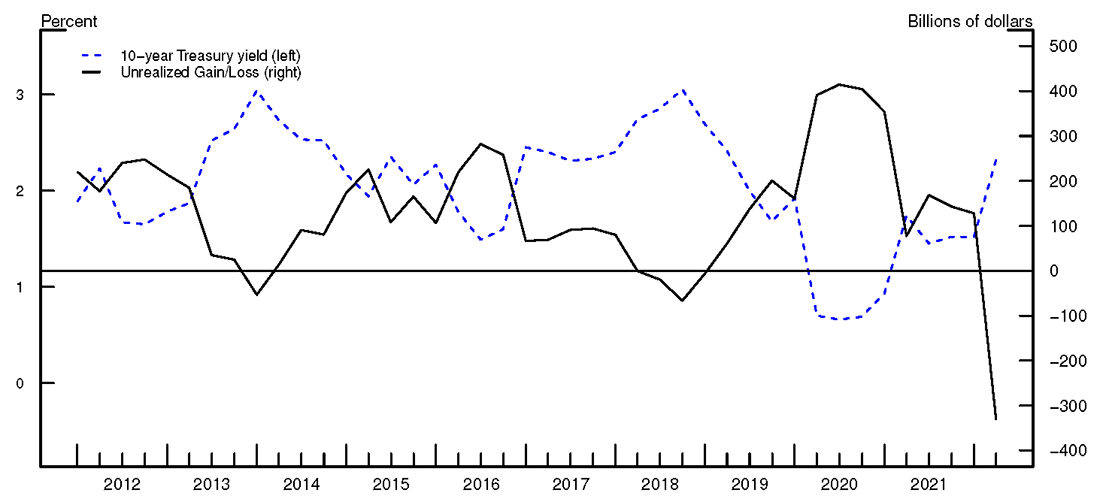
Source: Federal Reserve, H.15 Select Interest Rates, https://www.federalreserve.gov/releases/h15/; Federal Reserve, Federal Reserve Banks Combined Quarterly Financial Report and Federal Reserve Banks Combined Financial Statements.
The size of an unrealized gain or loss position depends on both the size of the SOMA portfolio and changes in interest rates. In the years following the Global Financial Crisis (GFC), the SOMA portfolio was in an unrealized gain position—that is, the unrealized position was positive with the SOMA portfolio's market value being higher than its amortized cost—driven by the historically low levels of interest rates. The SOMA's unrealized position became negative briefly in 2013 around the time of the "taper tantrum", during which Treasury yields rose sharply, and then again in early 2018. Subsequently, the unrealized gain position reached a peak of more than $400 billion in 2020, when the COVID-19 pandemic led to a global flight to safety and the swift policy response by the Fed pushed Treasury yields to record low levels. Some of the measures taken include the lowering of the target range for the federal funds rate to its effective lower bound (ELB) and purchasing large quantities of Treasury securities and agency MBS to restore market functioning and support the flow of credit to the U.S. economy. In March 2022, the Fed ended its asset purchases and started increasing the target range for the federal funds rate. At that point, the Committee's prior communications had already contributed to a tightening of financial conditions, as evident in the roughly 110-basis-point and 60-basis-point increase in 2-year and 10-year Treasury yields, respectively, over the few months leading up to the first rate hike in March. With the Fed's firming of monetary policy, the SOMA portfolio's unrealized position turned negative—that is, it turned into an unrealized loss position with the SOMA portfolio's market value being lower than its amortized cost—and reached $330 billion, or about 4 percent of the portfolio's par value, as of March 31, 2022.5,6
The size of the current unrealized loss position is driven both by interest rates that are notably higher than at the time when many of the SOMA securities were originally purchased and by the unprecedented size of the SOMA portfolio resulting from the asset purchases that started at the onset of the pandemic.7 Specifically, the size of the SOMA portfolio more than doubled in two years, from about $4 trillion before the pandemic to roughly $8.5 trillion at the conclusion of net asset purchases in March 2022.8
What Determines the Fed's Income and Remittances to the U.S. Treasury?
The Fed's net income is mainly determined by the difference between the interest income generated from its securities holdings in the SOMA portfolio and the interest expense associated with its liabilities. The interest income also reflects earnings from other assets such as repurchase agreements, discount window lending, and other credit and liquidity facilities, but the income from these sources is negligible compared to that generated from the Treasury securities and agency MBS holdings in the SOMA portfolio. In terms of its expense, the Fed pays interest on some liability items, such as reserve balances and the overnight reverse repurchase agreement (ON RRP) facility but pays no interest on other liability items such as currency in circulation and the Treasury General Account (TGA).9,10
The Fed remits all its net income—after providing for operating costs, payments of dividends, and any amount necessary to maintain surplus required by the Federal Reserve Act—to the U.S. Treasury.11 What happens if net income turns negative? In such a case, remittances to the U.S. Treasury would be suspended and a deferred asset, which is equal to the cumulative shortfall of net income, would be recorded on the Fed's balance sheet, as further discussed in Note 2.12 A shortfall in net income means remittances to the U.S. Treasury would cease temporarily, however it does not affect the Fed's conduct of monetary policy or its ability to meet its financial obligations.13
Both interest income and expense fluctuate over time with changes in the policy rate and, therefore, the Fed's income is subject to interest rate risk. Interest income reacts slowly to changes in the policy rate; only as the Fed reinvests maturing securities and purchases new Treasury securities for reserve management purposes do higher interest rates lead to higher interest income. In contrast, the interest expense is directly tied to the policy rate through administered rates and hence, adjusts quickly to changes in the policy rate. The interest rate risk regarding the Fed's income stems from the inherent duration mismatch of the assets and liabilities on the Fed's balance sheet. While the Fed holds Treasury securities with original maturities ranging from four weeks to 30 years and agency MBS with mostly 15-year and 30-year original maturities on the asset side of its balance sheet, it holds short-term liabilities such as reserves and the ON RRP on the liability side. Since the pandemic-era asset purchases were mostly funded by interest-bearing liabilities, their share of total Fed liabilities has increased from just under a half in early 2020 to about two-thirds by the time net asset purchases ended in March 2022. This compositional shift in liabilities made interest expense more sensitive to changes in interest rates than it had been previously, and in turn made net income more negatively influenced by rising interest rates.
Overall, the Fed's net income, and thus remittances to the U.S. Treasury, have fluctuated over the years but remained positive throughout, as shown in Figure 2.14 In the early 2000s, remittances were in the range of $20-30 billion per year, given the smaller size of the SOMA portfolio (between $600 and $700 billion) and the low share of interest-bearing liabilities. As a result of the large-scale asset purchases conducted in response to the GFC, remittances to the U.S. Treasury increased to average around $90 billion per year from 2010 to 2017 as SOMA interest income rose more rapidly than interest expense. During the balance sheet runoff of 2017-2019, remittances fell given higher interest expense due to increases in the policy rate and, to a lesser extent, lower interest income due to the shrinking SOMA portfolio. When the federal funds rate returned to the ELB at the onset of the COVID-19 pandemic, interest expense fell. At the same time, interest income rose notably as the Fed added sizable quantities of Treasury securities and agency MBS to its portfolio. By the time pandemic-era asset purchases ended in March 2022, the SOMA portfolio stood at about $8.5 trillion, more than doubling its size in two years. During this time, interest income of the SOMA portfolio increased much more than interest paid on liabilities. As a result, the Fed's remittances to the U.S. Treasury almost doubled in the last two years, rising from about $55 billion in 2019 to a record high of $109 billion in 2021. Overall, remittances to the Treasury totaled more than $1 trillion since 2010.
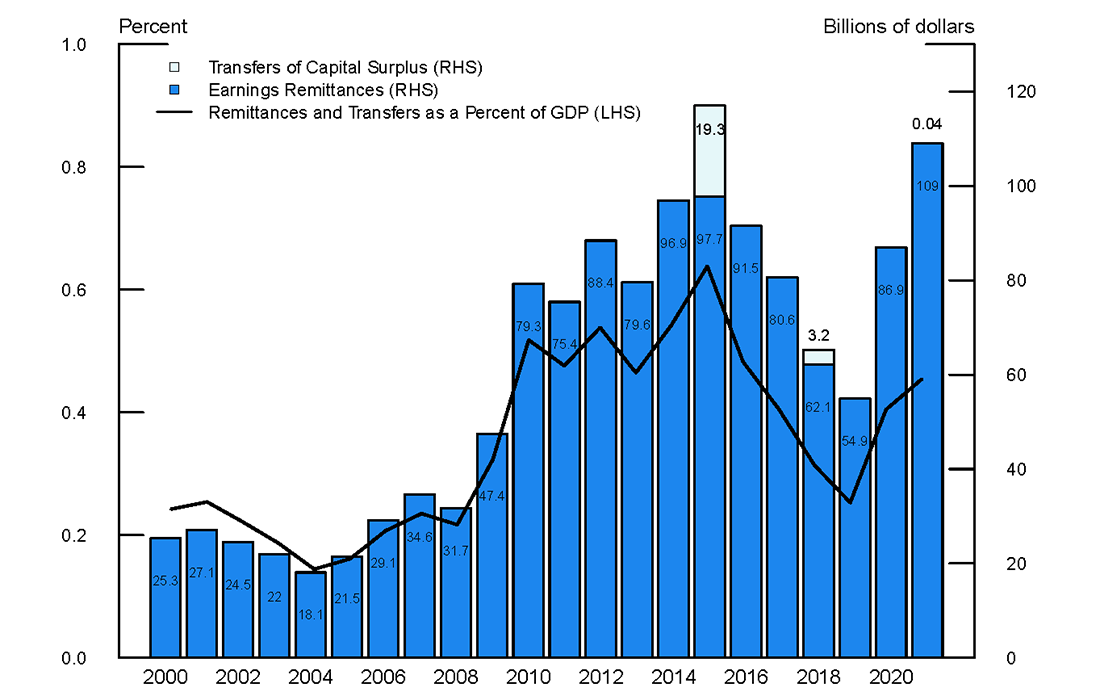
Note: The light blue bars indicate transfers of Reserve Bank capital surplus from the Federal Reserve to the Treasury. The transfers in the amounts shown were necessary to reduce aggregate Reserve Bank surplus to prevailing aggregate surplus limitations.
Source: Board of Governors of the Federal Reserve System; Bureau of Economic Analysis
While remittances have been very high recently, they are expected to fall temporarily as monetary policy tightening continues. The expansion of the Fed's balance sheet in response to the COVID-19 pandemic has increased the risk of the Fed's net income temporarily turning negative and remittances to the U.S. Treasury being suspended in the near-term with rising interest rates and associated increases in interest expense. However, while the risk of experiencing a period in which net income turns negative has increased, the Fed's response to the pandemic benefited households, businesses, the federal government, and the U.S. taxpayer. These actions supported smooth market functioning and the flow of credit to businesses and households, which ultimately resulted in higher economic output and a strong labor market, consistent with the Fed's mandate. Experiencing a period in which net income turns negative does not have any implications for the Fed's conduct of monetary policy.
What is the relationship between the unrealized position and net income?
The unrealized position of the SOMA portfolio is affected by fluctuations in interest rates due to changes in the expected path of short-term interest rates which are largely determined by the actual and expected policy rate, term premia, and, in the case of MBS, yield spreads. In a similar manner, the Fed's expected net income is also affected by changes in the expected path of interest rates. However, unrealized gains or losses do not flow through to the Fed's net income. An individual security's market value converges to its face value as it approaches maturity, and any gains or losses due to interest rate fluctuations remain unrealized for securities that are held to maturity. Only if securities are sold would the unrealized gains or losses become realized gains or losses with a direct effect on the Fed's net income.15
While an unrealized gain or loss position on the SOMA portfolio does not directly affect the Fed's net income, if a higher expected policy rate path causes an unrealized loss position, this would be indicative of higher future interest expense.16 In contrast, if the SOMA portfolio incurs an unrealized loss due to changes in term premia, this would not imply an increase in future interest expense for the Fed.17 Lastly, a rising interest-rate environment leading to an unrealized loss position today may also indicate higher future interest income as the Fed reinvests maturing Treasury securities and purchases new securities for reserve management purchases at higher yields.
Final Thoughts
With essential increases in interest rates to address inflationary pressures, the SOMA portfolio's unrealized loss position is likely to grow further and the Fed's net income is projected to decline in the near-term, topics which we cover in detail in the second note. Even in the case where the SOMA portfolio's unrealized loss position becomes larger and the Fed's net income turns negative temporarily, the Fed would still be able to meet all its responsibilities. In pursuit of its mandated goals to achieve maximum employment and stable prices set by Congress, the Fed would continue to set and effectively implement monetary policy for the United States.
References
Bonis, Brian, Lauren Fiesthumel and Jamie Noonan (2018). "SOMA's Unrealized Loss: What does it mean?," FEDS Notes. Washington: Board of Governors of the Federal Reserve System, August 13, 2018, https://doi.org/10.17016/2380-7172.2234.
Bukhari, Meryam, Alyssa Cambron, Marco Del Negro, and Julie Remache (2013). "A History of SOMA Income," Liberty Street Economics. New York: Federal Reserve Bank of New York, August 13, 2013.
Carpenter, Seth, Jane Ihrig, Elizabeth Klee, Daniel Quinn, and Alexander Boote (2015). "The Federal Reserve's Balance Sheet and Earnings: A Primer and Projections," International Journal of Central Banking 11 (2), 237-283.
English, William and Donald Kohn (2022). "What if the Federal Reserve Books Losses Because of its Quantitative Easing?, " The Hutchins Center Explains, Brookings Institution, June 1, 2022.
1. We thank David Bowman, Christian Cabanilla, Kathryn Chen, Casey Clark, Jim Clouse, Rochelle Edge, Chris Gust, Lorie Logan, Grace Milbank, Linsey Molloy, Trevor Reeve, Kim Zaikov, and Patricia Zobel for their useful comments and suggestions. The views expressed in this note are our own, and do not necessarily represent the views of the Board of Governors or the Federal Reserve System. Return to text
2. The unrealized gain or loss position is reported both quarterly and annually in the public financial statements for transparency purposes. Federal Reserve Banks Combined Quarterly Financial Reports (Unaudited) are available at https://www.federalreserve.gov/aboutthefed/combined-quarterly-financial-reports-unaudited.htm. Federal Reserve System Audited Annual Financial Statements are available at https://www.federalreserve.gov/aboutthefed/audited-annual-financial-statements.htm. Return to text
3. This practice follows the accounting principles documented in the Financial Accounting Manual for Federal Reserve Banks (FAM), available at https://www.federalreserve.gov/aboutthefed/files/bstfinaccountingmanual.pdf. See Bonis et al. (2018) for further discussion of the accounting of the Federal Reserve's unrealized position. Return to text
4. The 10-year Treasury yield serves as a proxy for the general direction of interest rates that affect the market value of the securities held in the SOMA. In reality, the market value of these securities is affected by changes in the term structure of interest rates as well as yield spreads. Return to text
5. As a percent of the portfolio, this unrealized loss position is not large by historical standards. For a longer-term perspective on the unrealized position of the SOMA portfolio, see Bukhari et al. (2013), which shows the unrealized position back to 1954. The unrealized loss as a share of the SOMA's par value reached its highest value to date of 7 percent in the early 1980s when interest rates were exceptionally high amid elevated inflation. Return to text
6. The unrealized loss position for the end of first quarter was reported in the Federal Reserve Banks Combined Quarterly Financial Report available at https://www.federalreserve.gov/aboutthefed/files/quarterly-report-20220527.pdf. Return to text
7. Additionally, the SOMA portfolio's exposure to interest rate risk has increased as reflected by the increase in the weighted average duration of its securities holdings since March 2020. The duration of Treasury holdings increased modestly as the decline in duration from the aging of the existing portfolio was more than offset by increases in duration from outright purchases and reinvestments. Also, the increase in mortgage rates led to an increase in the duration of agency MBS holdings given the reduced incentives to refinance or payoff the mortgage loans. Overall, the par-weighted average duration of the securities held in the SOMA portfolio, which is a measure of price sensitivity of securities to changes in interest rates, rose from 4.7 years in March 2020 to 5.8 years in December 2021. This duration implies that a 100-basis-point increase in interest rates would result in a roughly 5.8 percent unrealized loss on the portfolio. Return to text
8. These purchases were critical in fostering smooth market functioning and accommodative financial conditions, and thereby supporting the flow of credit to households and businesses. Return to text
9. The currency in circulation is currently close to $2.3 trillion, and the TGA has fluctuated significantly since the onset of the COVID-19 pandemic around an average of just under $1 trillion and reached as high as $1.8 trillion. Return to text
10. Interest on reserves was introduced in 2008 to help with rate control once the policy rate was lowered to the ELB, and the ON RRP facility was introduced in 2013 to enhance rate control in an environment of abundant reserves. Return to text
11. The Federal Reserve Act requires each Reserve Bank to pay each member bank an annual dividend based on the amount of the member bank's paid-in capital stock and a rate determined by the member bank's total consolidated assets. Return to text
12. See Carpenter et al. (2015) for a discussion of the deferred asset. Return to text
13. See English and Kohn (2022) for a discussion of the implications of the Fed's income turning negative temporarily. Return to text
14. Net income was also consistently positive before 2000, as discussed by Bukhari et al. (2013), which shows Federal Reserve net income back to 1915. Return to text
15. In addition, when MBS prepayment occurs, the amortization of premiums and accretion of discounts are accelerated, resulting in realized gains or losses calculated as the difference between the principal payments received and the amortized costs. Return to text
16. A higher policy rate path means that the Fed will have to pay more on its liabilities such as reserves held by banking system and the ON RRP facility. Return to text
17. As discussed earlier, the Fed has both interest-bearing liabilities and non-interest-bearing liabilities. Therefore, in addition to changes in the policy rate path, the composition of liabilities would be another factor in determining future interest expenses. Return to text
Anderson, Alyssa, Dave Na, Bernd Schlusche, and Zeynep Senyuz (2022). "An Analysis of the Interest Rate Risk of the Federal Reserve's Balance Sheet, Part 1: Background and Historical Perspective," FEDS Notes. Washington: Board of Governors of the Federal Reserve System, July 15, 2022, https://doi.org/10.17016/2380-7172.3173.
Disclaimer: FEDS Notes are articles in which Board staff offer their own views and present analysis on a range of topics in economics and finance. These articles are shorter and less technically oriented than FEDS Working Papers and IFDP papers.