FEDS Notes
July 17, 2020
Dealer Inventory Constraints during the COVID-19 Pandemic: Evidence from the Treasury Market and Broader Implications1
Strains in the Treasury market in March indicated a decline in broker-dealer inventory capacity, which has historically predicted persistent reductions in market liquidity across asset classes, the availability of financing for non-financial firms, and real activity.
Overview
The Treasury market is typically highly liquid and has essential roles in the broader financial system and the transmission of monetary policy. Strains in market liquidity in the Treasury market are therefore often viewed as a sign of wider financial dislocations.
The analysis in this note, based on the price and quantity of liquidity in the Treasury market, suggests that dealer inventory capacity declined notably in March while investors' demand for dealer-provided liquidity soared, causing the price of liquidity to rise. Through mid-April, dealer inventory capacity is estimated to have declined somewhat further, while investors' liquidity demand retraced completely its earlier rise.
A tightening of dealer inventory constraints of the magnitude observed in March and April has historically been associated with a notable persistent decline in market liquidity in multiple asset classes (including corporate bonds, equities, and agency mortgage-backed securities), a significant persistent deterioration in corporate financing conditions, and a rise in the unemployment rate.2 In contrast, a rise in investors' demand for dealer-provided liquidity has historically been associated with a transitory increase in illiquidity outside Treasury markets and has had no historical relation with corporate financing conditions or real activity.
Federal Reserve interventions in financial markets in recent months may have importantly affected the evolution of dealers' liquidity supply and investors' demand for dealer-provided liquidity. This note explores the channels through which such interventions might affect liquidity supply and demand. However, the analysis cannot attribute changes in liquidity supply and demand to particular announcements or events, especially in periods when multiple policy announcements occur on the very same day.
Methodology
This note uses an estimated structural vector autoregression (VAR) model of the price and quantity of market liquidity in the Treasury market. Changes in the price and quantity of liquidity are parsed into shifts in dealers' liquidity supply and investors' demand for dealer-provided liquidity. An inward shift in liquidity supply reflects a tightening in dealer inventory constraints.
In many asset classes, dealers use their balance sheets to make markets and provide immediacy to investors. When dealers' inventory capacity is strained, assets in dealer-intermediated markets can trade at prices away from their fundamental values. In theories of liquidity with inventory frictions, temporary price deviations—or noise in prices—reflect the expected return for providing liquidity.3 A well-known measure of such price deviations is Treasury noise—deviations of individual Treasury yields from a smooth fitted yield curve.4 Treasury market noise is measured on a daily basis by fitting a Svensson (1994) yield curve to individual Treasury yields.
Figure 1 shows observed market yields for nominal Treasury coupon securities with varying remaining maturity. The figure also shows smooth fitted yield curves. The top panels show yields on three normal days in 1994 and three days during the 2007–09 financial crisis. During the financial crisis, market yields and fitted yields diverged considerably. The bottom panels show that, in February and March this year, market yields increasingly diverged from fitted yields.5
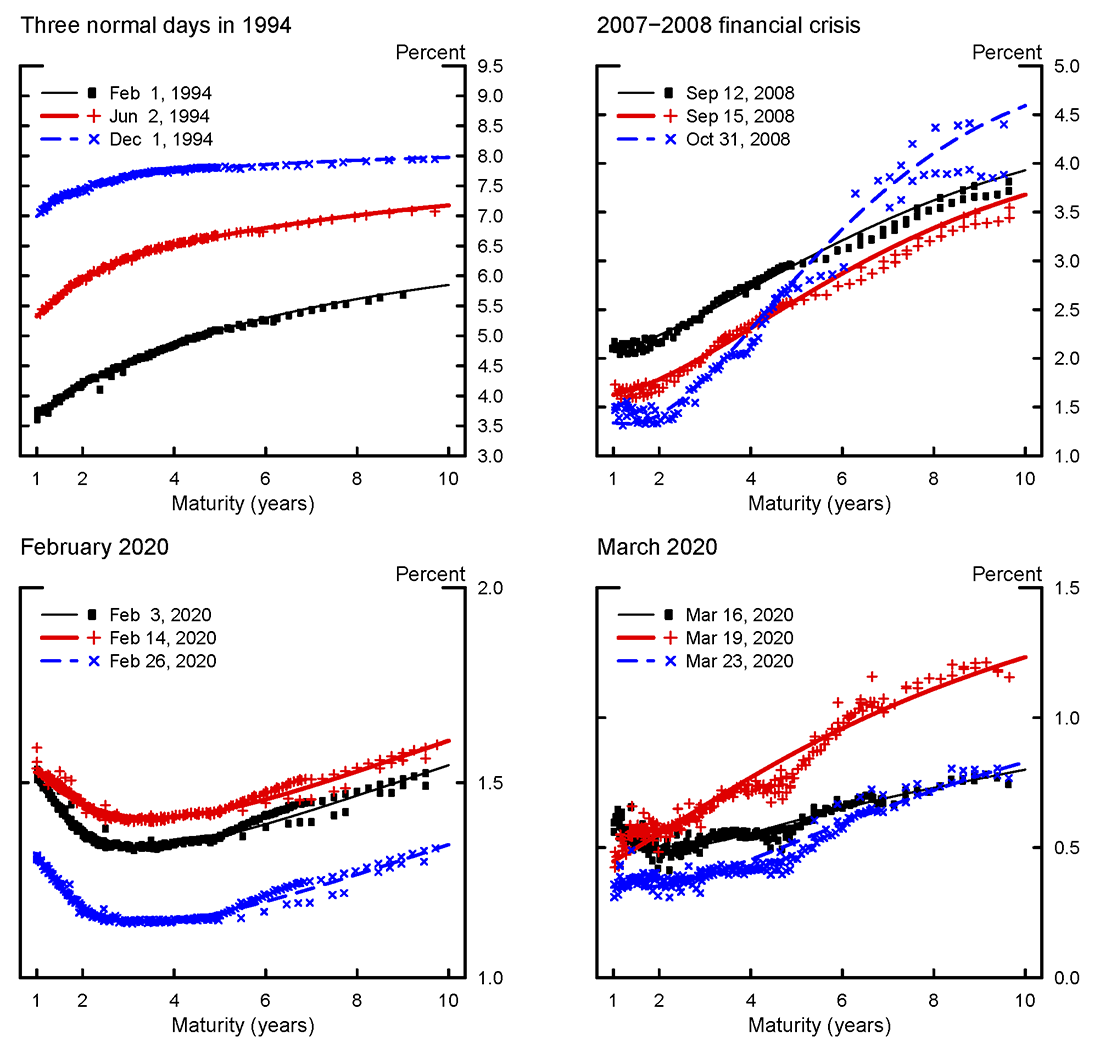
Source: Board staff estimates.
In the Treasury market, dealers smooth out the Treasury yield curve by taking long positions in bonds that investors want to sell and short positions in similar-maturity bonds that investors want to buy. This intermediation does not require dealers to take a net long or net short position, but it does require them to take gross long and gross short positions. Thus, the model uses dealer gross positions—the sum of gross long and gross short positions in nominal Treasury securities—as the quantity of liquidity. Dealer gross positions are measured on a weekly basis for primary dealers, using the FR 2004 report.6
The empirical model used in this note infers shifts in liquidity supply and demand using a VAR and simple sign restrictions. A supply shift is assumed to lead to opposite-sign changes in price and quantity. A demand shift is assumed to lead to same-sign changes in price and quantity. Goldberg (2020) and Goldberg and Nozawa (forthcoming) describe this methodology in detail.
The usefulness of this decomposition is highlighted by the historical pattern (documented in Goldberg (2020)) that liquidity supply shifts have been associated with persistent changes in aggregate liquidity across asset classes and changes in corporate financing conditions. In contrast, liquidity demand shifts have historically been associated with only transitory changes in market liquidity and little if any change in corporate financing conditions.
Remarks about dealers' liquidity supply and investors' demand for dealer-provided liquidity
Dealers' liquidity supply curve is upward-sloping, implicitly reflecting convex costs of using their balance sheets to provide liquidity to investors. When investors' liquidity demand curve shifts outward, the price (and quantity) of liquidity increases. In this sense, an outward shift in liquidity demand leads to a higher price of liquidity by "clogging" dealer balance sheets. Thus, dealer inventory constraints are important in determining how the price and quantity of liquidity change when investors' demand for liquidity increases. However, this "clogging" of dealer balance sheets is conceptually different from an inward shift in the liquidity supply curve. An inward shift in the liquidity supply curve reflects a tightening of dealer constraints arising outside of the Treasury market. For example, if dealers experience trading losses, money-market funds become less willing to provide secured funding to dealers, or regulations tighten, dealers' liquidity supply curve in the Treasury market might shift inward.7
Data and liquidity supply and demand measures
Figure 2 shows the time series of noise and dealer gross positions. To aggregate across securities, noise on each day is defined as the absolute average deviation between model-implied and observed market yields, for nominal Treasury coupon securities with remaining maturity of 2 to 10 years. Dealer gross positions are the sum of all primary dealers' gross long and gross short positions in nominal Treasury coupon securities.8 These are the inputs in the model.
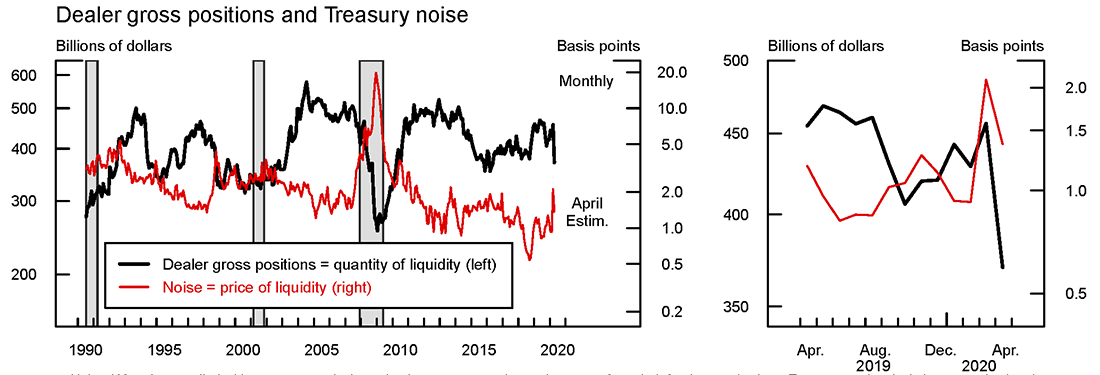
Shaded regions represent NBER recessions.
Noise: When intermediaries' inventory capacity is strained, assets can trade at prices away from their fundamental values. Temporary price deviations, or noise in prices, reflect the expected return for providing liquidity. A well−known measure of such price deviations is Treasury noise−−deviations of individual Treasury yields from a smooth fitted yield curve. The noise measure shown here is the average absolute deviation between observed market−based yields and model−implied yields.
Dealer gross positions: Dealer gross positions is the sum of gross long and gross short positions in nominal Treasury securities, from the FR2004, in 2019 dollars, and seasonally adjusted. Dealers smooth out the Treasury yield curve by taking long positions in bonds that investors want to sell and short positions in similar−maturity bonds that investors want to buy. This intermediation does not require dealers to take a net long or net short position, but it does require them to take gross long and gross short positions.
Zooming in on the last two years of data (right panel in Figure 2), noise rose significantly in March but declined somewhat in April. In contrast, dealer gross positions increased modestly in March but declined notably in April. The model translates these developments into estimated shifts in liquidity supply and demand curves.
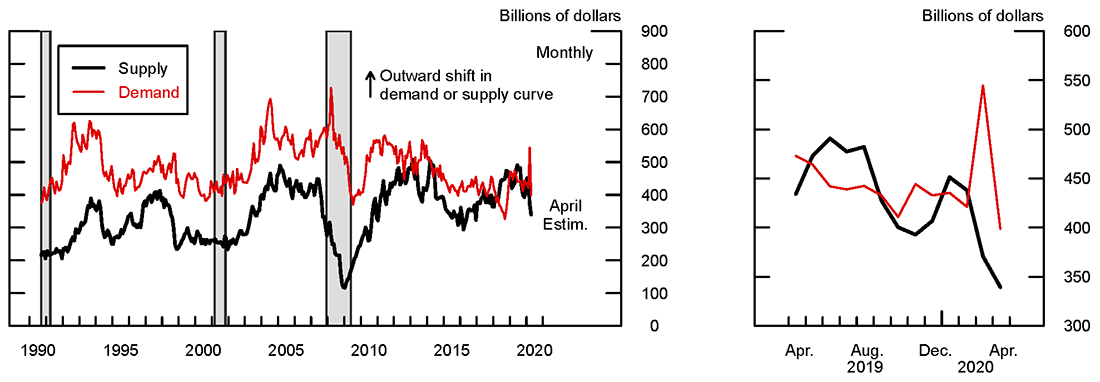
Shaded regions represent NBER recessions.
Note: This panel shows the liquidity supply index and the liquidity demand index. The liquidity supply index is the model−based quantity of liquidity, in billions of dollars, that dealers would supply if the price of liquidity were 1 basis point. The liquidity demand index is the model−based quantity of liquidity that investors would demand if the price of liquidity were 1 basis point. An increase in the liquidity supply index corresponds to an outward shift in the liquidity supply curve. An increase in the liquidity demand index corresponds to an outward shift in the liquidity demand curve.
Source: Staff calculations based on Goldberg, Jonathan, "Liquidity supply by broker−dealers and real activity," Journal of Financial Economics (2020).
Figure 3 presents information from the model about dealers' liquidity supply and investors' liquidity demand. I define the liquidity supply index as the quantity of liquidity that (according to the model) dealers would provide if the price of liquidity were 1 basis point.9 Similarly, I define the liquidity demand index as the quantity of liquidity that investors would demand if the price of liquidity were 1 basis point. An increase in the liquidity supply index thus captures an outward shift in liquidity supply. Similarly, an increase in the liquidity demand index captures an outward shift in liquidity demand. Table 1 presents information about recent shifts in liquidity supply and demand and compares recent experience with important historical episodes over the past three decades, such as the failure of the Long-Term Capital Management hedge fund or the Lehman collapse.
Table 1. Recent changes in liquidity supply and demand, in historical context
| Date | Change in supply index in percent | Change in demand index in percent | |
|---|---|---|---|
| Feb 2020 | -3 | -3.3 | |
| Mar 2020 | -16.7 | 25.7 | |
| Apr 2020 | -8.8 | -31.2 | |
| Oct 1998 | -18.4 | -0.3 | |
| Sep 2001 | (9/11) | -3.6 | 15.2 |
| Mar 2008 | (Bear Stearns) | -13.7 | 16 |
| Oct 2008 | (Lehman) | -28.7 | -6.7 |
| Nov 2008 | (Lehman) | -24.4 | -3.8 |
Liquidity supply and demand during the COVID-19 pandemic
The model suggests a notable inward shift in liquidity supply in March (Figure 3, inset box on the right). Preliminary data for April suggest that liquidity supply shifted further inward in late March or early April. All told, the liquidity supply curve is estimated to have shifted inward by $100 billion. The 17 percent decline in March was the fifth largest decline in liquidity supply since 1990, in percentage terms, according to the model. Based on preliminary data, the model points to a further decline in liquidity supply in April. The decline in liquidity supply in March, in percentage terms, was roughly the same as following the collapse of the Long-Term Capital Management hedge fund. However, the decline in liquidity supply in March was significantly smaller in magnitude than the declines observed after the collapse of Lehman Brothers in 2008.
According to the model, investors' liquidity demand soared in March. Investors' liquidity demand curve shifted outward by $120 billion, or 26 percent. The estimated increase in liquidity demand was the largest, in percentage terms, since collection of the underlying data began in 1990. For example, following the 9/11 attacks in 2001 and the collapse of Bear Stearns in 2008, liquidity demand increased about 15 percent.
However, preliminary data for April suggest that the rise in investors' demand for dealer-provided liquidity retraced in late March or April. The estimated decline in investors' demand for dealer-provided liquidity was the largest decline, in percentage terms, since 1990.
Role of Federal Reserve operations related to the Treasury market
Federal Reserve interventions in financial markets in recent months may have importantly affected the evolution over this period in dealers' liquidity supply and investors' demand for dealer-provided liquidity.
Operations in which the Federal Reserve lends to dealers against Treasury or other collateral might increase the availability of financing to dealers and reduce their funding risks.10 Such operations might therefore lead to an outward shift in dealers' liquidity supply curve in the Treasury market.
Operations in which the Federal Reserve lends to foreign central banks against Treasury collateral might allow foreign central banks and investors to obtain dollar funding without selling Treasury securities. Thus, such operations might lead to an inward shift in the demand for dealer-provided liquidity in the Treasury market.11
Treasury purchase operations, except when limited to securities with very short remaining maturity, absorb duration risk and might reduce term premiums. These effects of purchases might bolster dealers' risk-bearing capacity, contributing to an outward shift in dealers' liquidity supply curve.12 Because Treasury purchase operations are typically conducted to concentrate purchases in the cheapest securities within maturity buckets, Treasury purchase operations might also reduce the demand imbalances that give rise to noise, thereby leading to an inward shift in investors' demand for dealer-provided liquidity.
Unfortunately, the empirical model used in this note cannot attribute changes in liquidity supply and demand to particular announcements and events. Such an attribution is challenging for two main reasons. First, the model is not able to provide a high-frequency description of liquidity supply and demand changes during narrow windows around policy announcements or operations, especially in periods when many policy announcements are made in the same day. Second, it is difficult to pin down the expected timing of the effects of Federal Reserve operations on dealers' liquidity supply or investors' liquidity demand in the Treasury market. Would these operations affect liquidity supply only upon the announcement of unexpected operations? What would be the effect of the execution of pre-announced operations? As suggested by Duffie (2010), a number of institutional impediments such as search-and-matching frictions can importantly affect the immediate effect of an unexpected announcement of operations and the evolution of this effect over time.
Broader implications and caveats
The Treasury market plays important roles in the functioning of the entire financial system and the transmission of monetary policy. The Treasury yield curve is an important benchmark for pricing many other financial assets; investors rely on the Treasury market to be able to sell bonds for cash when the need arises; and Treasury bonds have a high collateral value. These roles of the Treasury market highlight the importance of understanding market liquidity in the Treasury market.
Understanding liquidity in the Treasury market is also useful because the Treasury market is typically highly liquid and Treasury securities have amongst the highest credit quality. Thus, a shortage of market liquidity in the Treasury market provides an important signal about liquidity in the broader universe of financial markets. Moreover, many of the dealers that provide liquidity in the Treasury market are active across financial markets. We can therefore use the Treasury market to extract a signal about dealers' inventory constraints more broadly.
Historically, declines in liquidity supply in the Treasury market have been associated with contemporaneous and persistent declines in liquidity in a wide range of dealer-intermediated markets (see, for example Goldberg, 2020). One such market is that of corporate debt, for which declines in liquidity supply can lead to reductions in corporate debt issuance. Indeed, corporate debt issuance has historically declined following declines in Treasury market liquidity supply.13 Moreover, Goldberg and Nozawa (forthcoming) show that declines in dealers' liquidity supply in corporate bond markets are associated with higher risk premiums for corporate bonds.
In contrast, increases in investors' liquidity demand in the Treasury market have historically been associated with only transitory changes in market liquidity outside the Treasury market. Moreover, increases in investors' liquidity demand have not historically been associated with changes in corporate financing patterns.
Thus, in light of historical experience, the decline in liquidity supply estimated by the model in March and early April suggests a tightening of dealer inventory constraints that could have persistent implications for aggregate market liquidity and corporate financing conditions.
Estimates from Goldberg (2020) indicate that a tightening of dealer inventory constraints of the magnitude observed in March and April has historically been associated with: a persistent increase of about 20 percent in trading costs in the corporate bond and equity markets; a decline in four-quarters-ahead corporate bond issuance of 0.3 percent of GDP and a decline in payouts to equity holders (dividends and share repurchases) of 0.4 percent of GDP; and a 0.4 percentage point rise in the unemployment rate over the subsequent year.14 This increase in the unemployment rate is economically important, although, unsurprisingly, it accounts for only a small part of the large increase in unemployment associated with COVID-19, which has profoundly reduced real activity by reducing in-person transactions and sidelining workers.
The model also estimates little net change in investors' demand for dealer-provided liquidity in the Treasury market over the same period. If historical patterns were to repeat, changes in investors' liquidity demand would not be associated with important broader macro-financial implications. However, the intense market strains observed in March might have been driven by fluctuations in investor liquidity demand of a different nature than during previous episodes of stress, suggesting caution in using historical experience as a guide to make predictions about the aggregate implications of the rise in liquidity demand in March. This caution is especially warranted for two main reasons. First, the estimated increase in liquidity demand in March was larger in magnitude than in any other month since the data collection began in 1990. Second, over time, the regulatory and institutional framework of the Treasury market and other markets has changed, suggesting that projections based on historical patterns should be undertaken with caution.15
References
Adrian, Tobias, Michael Fleming, Jonathan Goldberg, Morgan Lewis, Fabio Natalucci, and Jason Wu (2013), "Dealer Balance Sheet Capacity and Market Liquidity during the 2013 Selloff in Fixed Income Markets," FEDS Notes. Washington: Board of Governors of the Federal Reserve System, October 16, 2013.
Adrian, Tobias, Michael Fleming, Or Shachar, and Erik Vogt (2017). "Market liquidity after the financial crisis," Annual Review of Financial Economics, Vol. 9 (1), pp. 43-83.
Brain, Doug, Michiel De Pooter, Dobrislav Dobrev, Michael Fleming, Peter Johansson, Frank Keane, Michael Puglia, Tony Rodrigues, and Or Shachar (2018). "Breaking Down TRACE Volumes Further," FEDS Notes. Washington: Board of Governors of the Federal Reserve System, November 29, 2018.
Brunnermeier, Markus K., and Lasse Heje Pedersen (2009). "Market Liquidity and Funding Liquidity," Review of Financial Studies, vol. 22 (6), pp. 2201–38.
Duffie, Darrell (2010). "Presidential address: Asset price dynamics with slow‐moving capital," Journal of Finance, vol. 65(4), pp. 1237–67.
Engle, Robert, Michael Fleming, Eric Ghysels, and Giang Nguyen (forthcoming) "Liquidity and Volatility in the U.S. Treasury Market," Journal of Econometrics.
Fontaine, Jean-Sébastien, and René Garcia (2012). "Bond liquidity premia," Review of Financial Studies vol. 25 (4), pp. 1207–1254.
Fleming, Michael (2020). “Treasury Market Liquidity and the Federal Reserve during the COVID-19 Pandemic.” Federal Reserve Bank of New York, Liberty Street Economics.
Goldberg, Jonathan (2020). "Liquidity Supply by Broker-Dealers and Real Activity." Journal of Financial Economics, vol. 136(3), pp. 806–27.
Goldberg, Jonathan and Yoshio Nozawa (forthcoming) "Liquidity Supply in the Corporate Bond Market," Journal of Finance.
Goldenring, Jessica, Sebastian Infante, Dan Li, Lubomir Petrasek, Zack Saravay, Sean Grossman, Sanford J., and Merton H. Miller (1988). "Liquidity and Market Structure," Journal of Finance, vol. 43 (3), pp. 617–33.
Hu, Grace Xing, Jun Pan, and Jiang Wang (2013). "Noise as information for illiquidity," Journal of Finance, vol. 68 (6), pp. 2341–2382.
Kondor, Péter and Dmitri Vayanos (2019). "Liquidity Risk and the Dynamics of Arbitrage Capital," Journal of Finance, vol. 74, pp. 1139–1173.
Krishnamurthy, Arvind (2002). "The bond/old-bond spread," Journal of Financial Economics, vol. 66 (2), pp. 463–506.
Schrimpf, Andreas, Hyun Song Shin, and Vladyslav Sushko (2020). “Leverage and margin spirals in fixed income markets during the Covid-19 crisis.” Bank for International Settlements Bulletin No. 2.
Svensson, Lars EO (1994). "Estimating and interpreting forward interest rates: Sweden 1992–1994." NBER working paper 4871.
Vayanos, Dimitri and Jiang Wang (2013). "Market Liquidity—Theory and Empirical Evidence," in George M. Constantinides, Milton Harris, and Rene M. Stulz, eds., Handbook of the Economics of Finance, Vol. 2B, pp 1289–1361.
1. I thank Andrea Ajello, Jim Clouse, Michiel De Pooter, Rochelle Edge, Giovanni Favara, Sebastian Infante Bilbao, Thomas Laubach, Andrew Meldrum, Lubomir Petrasek, Trevor Reeve, Sean Savage, and Min Wei for helpful comments. Gerardo Sanz-Maldonado and Tyler Pike provided excellent research assistance. The views expressed here are those of the author and do not necessarily represent the views of the Federal Reserve Board or its staff. Return to text
2. A tightening of dealer inventory constraints of the magnitude observed in recent months has historically been associated with a 0.4 percentage point rise in the unemployment rate. Such an increase in the unemployment rate is economically important. However, and unsurprisingly, this increase in the unemployment rate is small relative to the overall increase in unemployment associated with the coronavirus (COVID-19)—a public-health emergency that has profoundly reduced real economic activity by reducing in-person transactions and sidelining workers. Return to text
3. See, for example, Grossman and Miller (1988). Vayanos and Wang (2013) survey the literature. Return to text
4. Regarding Treasury noise, see Fontaine and Garcia (2012) and Hu, Pan, and Wang (2013). The on-the-run premium (Krishnamurthy (2002)) is a Treasury liquidity measure related to noise; an advantage of using noise is that it captures information from the entire cross-section of nominal Treasury coupon securities. Other research focuses on bid-ask spreads and market depth in the on-the-run Treasury market (Adrian, Fleming, Shachar, and Vogt (2017) and Engle, Fleming, Ghysels, and Nguyen (forthcoming)). The analysis in this note isolates shifts in liquidity supply and demand using an approach motivated by theories of market liquidity with intermediary inventory frictions such as Kondor and Vayanos (2019). Return to text
5. Measures of liquidity in the on-the-run Treasury market, the most liquid part of Treasury markets, also deteriorated notably in February and March, amid dislocations between the cash and futures markets (Fleming (2020), Schrimpf, Shin, and Sushko (2020)). Return to text
6. Federal Reserve Board, Form FR 2004, Government Securities Dealers Reports. Return to text
7. Of note, an outward demand shift is interpreted as a rise in demand imbalances to buy particular Treasury bonds (even if they are priced richly relative to the smooth yield curve) or to sell particular Treasury bonds (even if they are priced cheaply). For a dynamic general equilibrium consistent with these observations and the model-based decomposition, see the Internet Appendix of Goldberg and Nozawa (forthcoming). Return to text
8. A monthly average is taken across all trading days (for noise) and all reporting dates (for positions) within the calendar month. Positions are reported weekly, as the close of business on Wednesdays. Averages can also be taken defining the last Wednesday of each calendar month as the month end, so that monthly averages of noise and dealer gross positions cover the exact same set of dates. The main results here are robust to this alternative approach. The evolution of gross long and gross short positions in the Treasury market during the Taper Tantrum in 2013 and other episodes of market stress is analyzed in Adrian et al. (2013). Return to text
9. The underlying structural VAR contains a supply curve and a demand curve that shift stochastically over time. The liquidity supply and demand indexes are constructed from the implicit supply and demand curves in the VAR, and correspond to the liquidity quantity supplied (or demanded) conditional on a liquidity price of 1 basis point. The model assumes constant elasticities of supply and demand. See Goldberg (2020) for details and a discussion of robustness. Return to text
10. Examples include repurchase operations and lending to dealers through the Primary Dealer Credit Facility. Note that an operation lending to dealers against Treasury collateral has no mechanical effect on the model inputs (dealer gross positions and noise), because dealer gross positions are included irrespective of how dealers finance the positions. Return to text
11. An example is the temporary repurchase agreement facility for foreign and international monetary authorities (FIMA Repo Facility), announced March 31, 2020. Swap lines with foreign central banks might similarly reduce demand for dealer-provided market liquidity in the Treasury market. Return to text
12. In a dynamic general equilibrium theoretical model consistent with the empirical model used for the decomposition, a reduction in the quantity or duration of bonds that must be held by the private sector leads to reduced risk premium and improved market liquidity, reflecting dealers' dual role as a marginal investor and provider of market liquidity. Return to text
13. Moreover, declines in corporate bond liquidity and issuance associated with reduced liquidity supply have historically been sharper for junk-rated firms than for investment-grade firms. Return to text
14. Note that the level of trading costs and deviations of prices from fundamentals differ markedly across asset classes; for example, trading costs in equity markets are much smaller than in the over-the-counter market for corporate debt. Nevertheless, it is natural to expect similar percentage increase in trading costs across asset classes from a tightening in dealer inventory constraints, as suggested by contagion models such as Brunnermeier and Pedersen (2009). Indeed, Goldberg (2020) finds that tighter dealer inventory constraints in the Treasury market are associated with similar percentage increases in trading costs or mispricing across asset classes. Return to text
15. Of note, the model-based decomposition focuses on off-the-run securities and dealer positions held overnight (as opposed to intraday). For this type of liquidity provision, dealers have continued to play a very important role even as non-dealers, in particular principal trading firms, have increased their role in intraday on-the-run trading. Regarding the role of primary dealers and principal trading firms in the Treasury market, see Brain et al. (2018). Return to text
Goldberg, Jonathan (2020). "Dealer Inventory Constraints during the COVID-19 Pandemic: Evidence from the Treasury Market and Broader Implications," FEDS Notes. Washington: Board of Governors of the Federal Reserve System, July 17, 2020, https://doi.org/10.17016/2380-7172.2581.
Disclaimer: FEDS Notes are articles in which Board staff offer their own views and present analysis on a range of topics in economics and finance. These articles are shorter and less technically oriented than FEDS Working Papers and IFDP papers.