FEDS Notes
December 18, 2020
Globalization and the Reach of Multinationals Implications for Portfolio Exposures, Capital Flows, and Home Bias
Carol Bertaut, Beau Bressler, and Stephanie Curcuru1
Introduction
The residence-based framework of measuring international exposure is increasingly less informative, as a growing number of firms locate in low-tax jurisdictions and issue securities through offshore subsidiaries. This has clouded the view of capital flows and investor exposures from standard sources such as the IMF Balance of Payments and the Coordinated Portfolio Investment Survey. Recent work has taken steps to address this issue: Bertaut, Bressler, and Curcuru (2019) map security-level data on U.S. investors' cross-border holdings from a residence-basis (where the issuing subsidiary is incorporated, or "resident") to a nationality-basis (reflecting the country of the parent firm) and find that 30% of the market value of long-term foreign portfolio securities held by U.S. investors in 2017 reflected exposures to countries other than as reported in the official U.S. statistics. Coppola et al. (2020) map the universe of traded securities to their parent companies and subsidiaries and provide adjustment factors for converting residence-based statistics to a nationality basis. These studies underscore the limitations of the residence-based statistical framework used in official datasets of cross-border positions and capital flows.
However, in a globalized economy even these nationality-based statistics cannot fully capture the true economic exposures of investors. Securities issued by firms with operations around the world will provide exposure to countries other than the country of nationality or residence. Indeed, stock prices of internationally-exposed U.S. firms certainly respond to foreign shocks and developments such as dollar appreciation or announcements about potential changes to trade policy such as tariff increases (see, for example, Amiti, Kong, and Weinstein 2020). In this note we combine security-level data on U.S. holdings of common stock with firm-level geographic revenue data to get a fuller picture of the economic exposure of U.S. investors. We then briefly examine some of the implications of this remapping for our understanding of home bias, which is one important driver of cross-border investment.
Data and Methodology
Our new estimates of the geographic exposure of U.S. equity investors consider the full equity portfolio of U.S. investors, including equity of U.S. companies. We start with the annual surveys collected as part of the Treasury International Capital (TIC) system. These data are collected on a legal residence basis for construction of the U.S. International Investment Position. The data on U.S. holdings of stock issued abroad comes directly from the "U.S. Residents Portfolio Holdings of Foreign Securities" survey. U.S. investor holdings of stock issued domestically is inferred from the difference between the total stock market capitalization for each firm (from Worldscope) and the total the amount held by foreign investors as reported in the "Foreign Residents' Portfolio Holdings of U.S. Securities" survey. We then reassign each firm from country of residence to country of nationality using the remapping algorithm of Bertaut, Bressler, and Curcuru (2019).2
We then take this remapping of equity holdings from the country of residence to nationality one step further and remap equity holdings based on the geography of firm revenue. Our data on firms' geographic revenue distribution comes from Worldscope.3 This is a challenging exercise, because geographic segment descriptions reported to Worldscope are non-standardized and often refer to regions rather than individual countries. When revenue is allocated to a region, we allocate revenue to the component countries of each region based on each country's GDP weights in each region.4 Overall, Worldscope coverage for firms in the U.S. equity portfolio (especially for U.S.-listed firms) is quite good, and improves over time. We are able to classify market capitalization and U.S. portfolio holdings for December 2003 through 2018. By 2018, we have data on nearly 9,200 firms with market capitalization at end-2018 of $68 trillion.5
Revenue-based Estimates of U.S. Equity Exposure
Figures 1a, 1b, and 1c compare total U.S. portfolio holdings on a residence, nationality, and revenue basis. On a residence basis, holdings of domestic equities amount to about $21 trillion in December 2018 (Figure 1a), roughly 80 percent of the total equity holdings of about $27 trillion. Domestic holdings are slightly higher on a nationality basis, increasing to $21.8 trillion (Figure 1b), reflecting our reclassification of $800 billion in holdings of equity of U.S. multinationals incorporated in offshore centers. Holdings of emerging market equity are also slightly larger, in large part reflecting the reclassification of financial center equity to China (see Bertaut, Bressler, and Curcuru 2019).
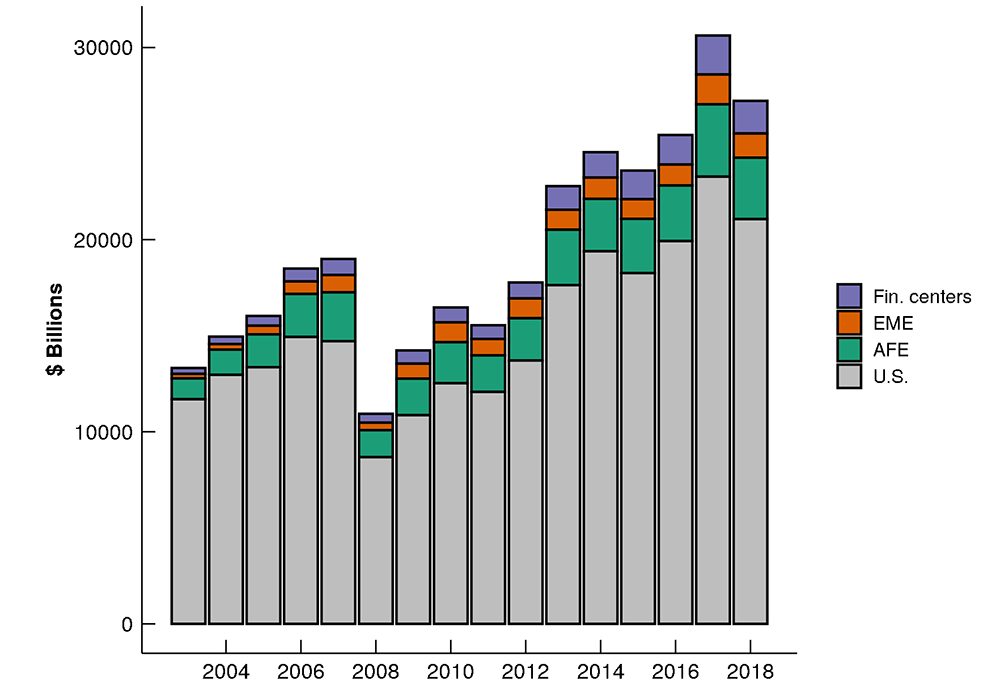
Note: Legend entries are ordered from top to bottom.
Source: Treasury International Capital System; Bloomberg; Refinitiv Worldscope Fundamentals; Authors' calculations.
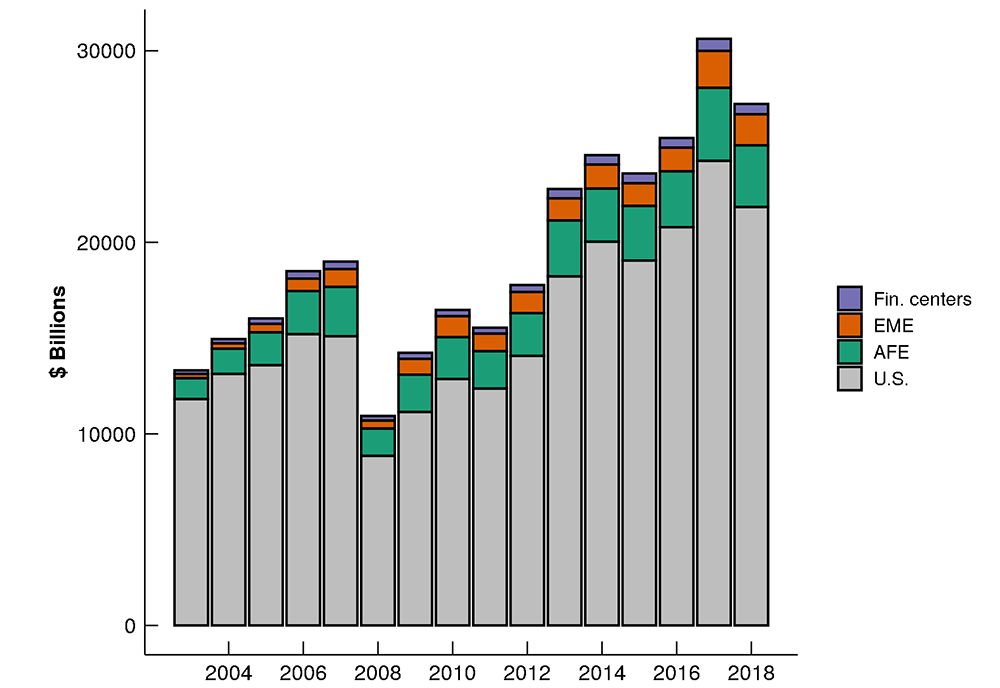
Note: Legend entries are ordered from top to bottom.
Source: Treasury International Capital System; Bloomberg; Refinitiv Worldscope Fundamentals; Authors' calculations.
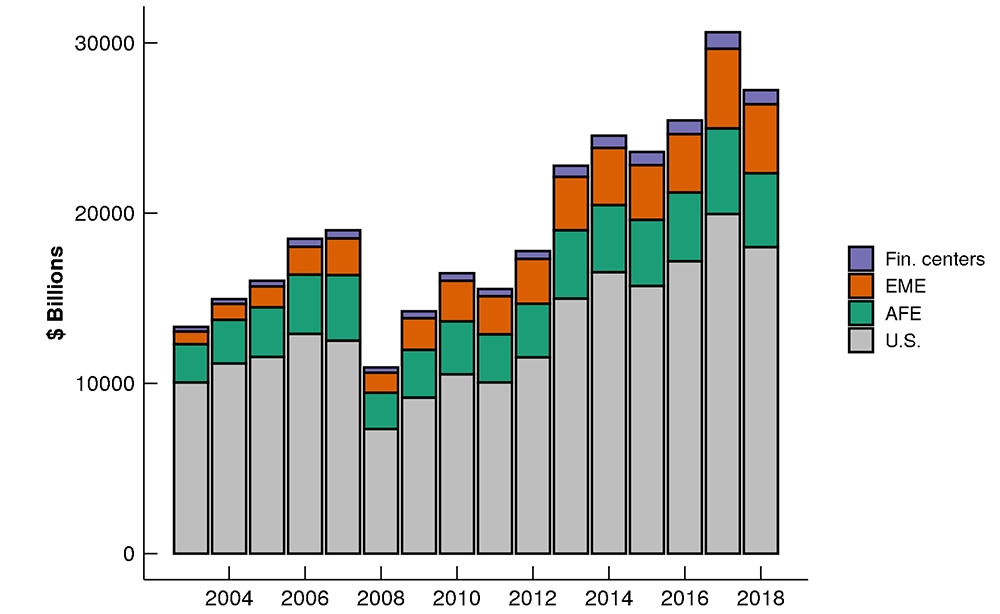
Note: Legend entries are ordered from top to bottom.
Source: Treasury International Capital System; Bloomberg; Refinitiv Worldscope Fundamentals; Authors' calculations.
Our remapping using the geography of firm revenue presents a much different picture of U.S. investor exposure. On a revenue basis, domestic equity holdings remain the largest portion of the total portfolio but fall to $18 trillion (figure 1c). This smaller U.S. exposure reflects the fact that large-cap U.S. firms have substantial revenue from global sources and thus holding their shares provides U.S. investors with considerable exposure to other countries. Of course, the reduced exposure to the United States and increased exposure to the rest of the world is partially offset by a reallocation of some of the holdings of foreign equity: Foreign multinationals often generate significant revenue from U.S. sales, and thus U.S. investors acquire some U.S. exposure through their holdings of foreign stocks. The differences in geographic allocations between the revenue-based statistics and the residence- and nationality-based statistics are shown in figures 2a and 2b, respectively. In the early part of our sample, most of the reallocation from domestic to foreign exposure was to advanced foreign economies (AFEs). In more recent years, however, most of the remapping has been to emerging market economies (EMEs).
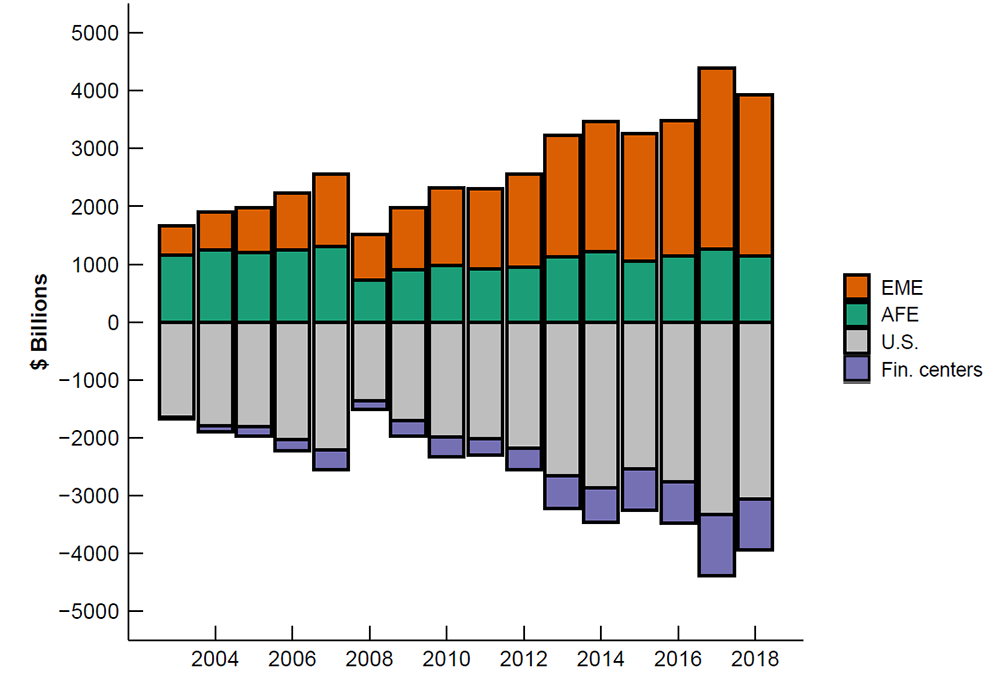
Note: Legend entries are ordered from top to bottom.
Source: Treasury International Capital System; Bloomberg; Refinitiv Worldscope Fundamentals; Authors' calculations.
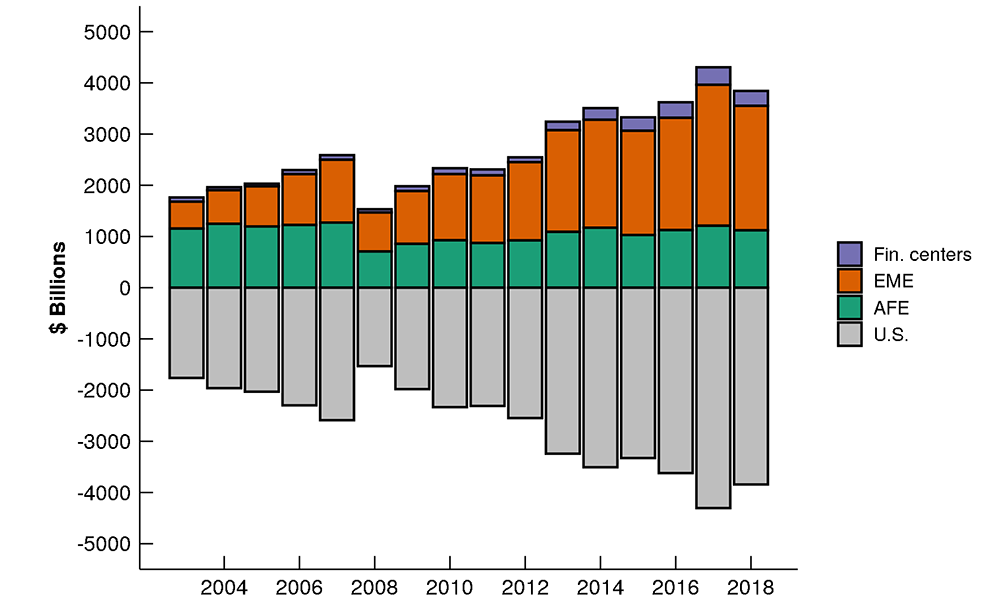
Note: Legend entries are ordered from top to bottom.
Source: Treasury International Capital System; Bloomberg; Refinitiv Worldscope Fundamentals; Authors' calculations.
Two particularly striking facts stand out from the revenue-based holding estimates. First, we find that U.S. investors may have as much indirect foreign exposure from their holdings of equity of U.S. multinationals as from direct holdings of foreign equity. The sources of the domestic and foreign exposures of U.S. investors are shown in Figure 3. In December 2018, U.S. investors had $4.6 trillion of foreign exposure from their holdings of U.S. equity, almost as much as their $4.8 trillion of foreign exposure from their direct foreign equity holdings.
Figure 3. U.S. holdings of common stock, Revenue exposure basis by type of economy and nationality of firm
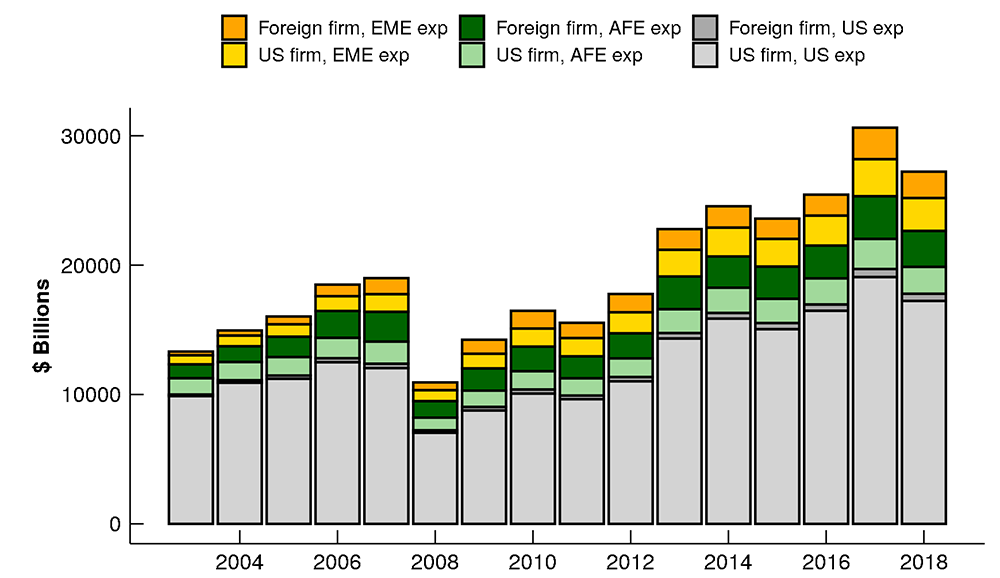
Note: Legend entries are ordered from top to bottom.
Source: Treasury International Capital System; Bloomberg; Refinitiv Worldscope Fundamentals; Authors' calculations.
Second, we find that U.S. investors have about as much exposure to emerging markets as they do to advanced foreign economies, as both U.S. and AFE multinationals have significant exposures to emerging markets. In 2018, U.S. investors had $4.6 trillion in EME exposure, including $2.5 trillion through U.S. holdings of domestic multinationals, versus $4.9 trillion of AFE exposure.
Implications for Home Bias
Our results have implications for a wide range of topics of interest to global policy makers and academics. These include conclusions we draw about the factors influencing capital flows, in particular those to emerging markets, and the drivers of international investment allocations more generally, such as "home bias"; in other words, the lack of diversification of international investors relative to the optimal holdings implied by the International Capital Asset Pricing model (ICAPM). The ICAPM predicts that in a world with frictionless markets the optimal asset allocation is the world portfolio; in other words, investors should spread their wealth among global equities according to each asset's share of global market capitalization. For example, since U.S. equities currently make up about 40 percent of global market capitalization, about 40 percent of U.S. investors' equity holdings should be in U.S. stocks.
The usual estimate for the degree of home bias in investor portfolios compares portfolio allocations in foreign (to the investor) equity to shares in global market capitalization. :
$$$$ 1 - \frac{\frac{holdings\ of\ foreign\ equity}{total\ equity\ portfolio}}{\frac{foreign\ equity\ market\ cap}{world\ equity\ market\ cap}} $$$$
Note that if portfolio shares are close to or equal market capitalization shares, the ratio in the second term will be close to one. Thus the ratio is typically subtracted from 1 to measure home bias, so that the larger this resulting calculation, the greater the extent of home bias. A home bias of 0.5 means that investors hold half as much foreign stock (or twice as much domestic stock) as implied by the ICAPM.
In practice, investors in the U.S. hold larger shares of their wealth in domestic securities than predicted by the ICAPM, and this is true for investors around the globe. There is a large literature on the potential causes of home bias, which include hedging motives arising from exchange rate and other risks, and frictions such as transactions costs as well as easier access to and better information about domestic markets. Coeurdacier and Rey (2013) provide a comprehensive survey of this literature. This literature focuses on factors that affect investor demand for exposure, and the associated characteristics of investment in different countries. But how these portfolio shares – and market capitalization shares – are constructed can lead to markedly different measures of home bias, which in turn can confound our interpretation of what drives portfolio preferences such as "home bias".
Figure 4 shows our home bias estimates for U.S. investors. When holdings are measured by residence (the red line), home bias in common stock is quite high. That said, it has trended down slightly from about 0.75 in the early 2000s to about 0.65 after the global financial crisis, and it has remained around that level for the past several years. When instead holdings measured on a nationality basis (the blue line), home bias is even higher, largely due to holdings of firms in financial centers that we remap to the United States. Home bias estimates are notably lower when holdings are revenue-based (the green line), generally below 0.5. This lower level of home bias largely reflects the additional exposure to foreign countries that U.S. investors achieve through their holdings of equity of U.S. multinationals.
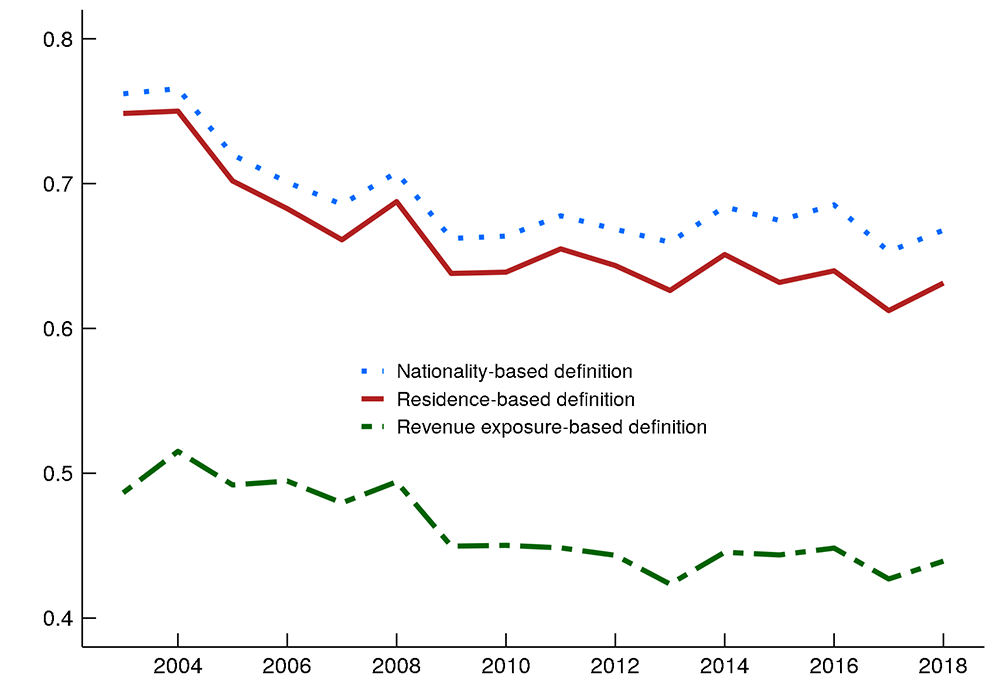
Source: Authors' calculations.
The marked differences in measures and trends for U.S. home bias suggests caution in constructing such estimates using aggregate data such as from the IMF's Coordinated Portfolio Investment Survey (CPIS). The CPIS is collected on a residency basis, and as our analysis shows, holding shares of multinational firms can considerably increase the global exposure of a country's investors. Our investigation of the U.S. portfolio indicates that U.S. "home bias" clearly still exists, but is notably reduced when calculated on a geographic revenue-basis. In ongoing work, we consider how these differences in measures of international exposure also affect the conclusions we draw about the drivers of home bias and portfolio allocations.
References
Amenc, Noël, Felix Goltz, Sivagaminathan Sivasubramanian and Ashish Lodh (2015). "Robustness of Smart Beta Strategies." The Journal of Index Investing, 6(1), 17-38.
Amiti, Mary, Sang Hoon Kong and David Weinstein (2020). "The Effect of the U.S.-China Trade War on U.S. Investment." NBER Working Paper No. 27114.
Bertaut, Carol C., Beau Bressler and Stephanie Curcuru (2019). "Globalization and the Geography of Capital Flows." FEDS Notes 2019-09-06. Board of Governors of the Federal Reserve System (U.S.).
Coppola, Antonio, Matteo Maggiori, Brent Neiman, and Jesse Schreger (2020). "Redrawing the Map of Global Capital Flows: The Role of Cross-Border Financing and Tax Havens." Working Paper.
Coeurdacier, Nicolas and Hélène Rey (2013). "Home Bias in Open Economy Financial Macroeconomics." Journal of Economic Literature, 51(1), 63-115.
U.S. Department of Treasury, annual reports on U.S. Portfolio Surveys of Foreign Securities, various years. https://www.treasury.gov/resource-center/data-chart-center/tic/Pages/shcreports.aspx
Appendix
For each geographic segment provided for location of sales revenue, we calculate the firm-specific share of total sales revenue attributable to that segment, and then use each share to allocate market capitalization exposures and U.S. portfolio exposures. When geographic segments list individual countries, we assign sales shares to that particular country. When geographic segment data lists regions or combinations of countries, we allocate across countries by GDP shares. If no geographic segment data is listed, we assume all sales are domestic. When sales location data is missing in one year, we use the prior year sales shares.
1. Bertaut and Curcuru are at the Federal Reserve Board, Bressler is at University of California, Davis. Estelle Ou provided excellent research assistance.Return to text
2. For this exercise focusing on the U.S. investor equity portfolio, our residence-to-nationality remapping only affects equity of foreign firms, as all of the common stock equity identified as "U.S." in the TIC system is also identified as "U.S." by standard benchmarks such as the MSCI. The mapping would be less straightforward if we were to extend our analysis to the U.S. bond portfolio, because debt issued by U.S.-resident financing subsidiaries with foreign parents are included as "U.S." bonds by TIC. Return to text
3. Worldscope defines their geographic sales variable as "represents the total revenues from the geographic region updated in the respective description." Return to text
4. This methodology for allocating geographic revenue is similar in spirit to Amenc et al. (2015) and also to Morningstar's "Revenue Exposure by Region." See Appendix for more details on methodology. For firms not reported in Worldscope or with incomplete information, we use data from Bloomberg and from company annual reports where possible to determine market capitalization and sales revenue allocations. Return to text
5. By comparison, the World Bank's World Development indicators lists global equity market capitalization for 2018 at $68.6 trillion. In terms of foreign-issued equity held by U.S. investors, we are able to match more than 80% of the market value of foreign common stock held in the early 2000s, increasing to more than 90% by 2009. Return to text
Bertaut, Carol, Beau Bressler, and Stephanie Curcuru (2020). "Globalization and the Reach of Multinationals Implications for Portfolio Exposures, Capital Flows, and Home Bias," FEDS Notes. Washington: Board of Governors of the Federal Reserve System, December 18, 2020, https://doi.org/10.17016/2380-7172.2829.
Disclaimer: FEDS Notes are articles in which Board staff offer their own views and present analysis on a range of topics in economics and finance. These articles are shorter and less technically oriented than FEDS Working Papers and IFDP papers.