FEDS Notes
July 12, 2022
Monetary Policy, Inflation Outlook, and Recession Probabilities1
Andrea Ajello, Luca Benzoni, Makena Schwinn, Yannick Timmer, and Francisco Vazquez-Grande
Introduction
An inverted yield curve—defined as an episode in which long-maturity Treasury yields fall below their short-maturity counterparts—is a powerful near-term predictor of recessions.2 While most previous studies focus on the predictive power of the spread between long- and short-maturity Treasury yields, Engstrom and Sharpe (2019) have recently shown that a measure of the nominal near-term forward spread (NTFS), given by the difference between the six-quarter-ahead forward Treasury yield and the current three-month Treasury bill rate, dominates long-term spreads as a leading indicator of economic activity.
Why does the NTFS predict recessions?
In this note we explore the economic forces that shape the NTFS dynamics and identify channels through which the NTFS forecasts recessions. In particular, we highlight the roles of the current stance of monetary policy and short-term inflation expectations in predicting downturns. Moreover, we examine the tradeoff between the Federal Reserve's ability to reduce inflation by increasing the federal funds rate and the effect of such intervention on the estimated likelihood of an upcoming recession.
The NTFS is an informative gauge of market-participants' expectations about future near-term monetary policy actions, such as the raising and lowering of the federal funds rate by the Federal Reserve. Thus, it carries information about current and near-term real interest rates, future expected inflation, and the interest rate forward risk premium (or term premium), which in turn are linked to expectations of future business cycle outcomes.
Building on these insights, we decompose the NTFS into four terms: the current and expected stance of monetary policy, measured as the policy gap between current or expected short-term real rates and their longer-run equilibrium level ($$r^{\ast}$$); the slope of inflation forecasts; and the term premium on the short-maturity forward yield. We explore the effect of these channels on the estimated probability of a recession and find that the power of the NTFS mostly lies in the information contained in the current real rate gap and the slope of short-run inflation expectations. In contrast, the near-term expected policy gap and the near-term premium contain little information that predicts downturns.
We perform the NTFS decomposition with the dynamic term structure model of Ajello, Benzoni, and Chyruk (2020, ABC), estimated on quarterly Treasury yields and inflation data from 1962Q2 to 2022Q2.3 The ABC model provides a good fit of the yield curve as well as core and headline inflation, both in and out of sample—an important requirement to decompose the sources of information contained in the NTFS that we exploit in this study.4 We focus on a long sample period that starts in the early 1960s to inform the analysis with data from the inflationary episodes from the 1960s through the early 1980s, as well as data from later years during which inflation realizations and expectations declined.
Using the variables from the NTFS decomposition, we estimate a probit model that predicts the probability of a recession in the U.S. economy over the next twelve months. We find that tighter current monetary policy relative to a neutral stance, i.e., a narrower current policy gap, and a downward near-term slope of the expected inflation path are significant predictors of recessions. In contrast, the near-term expected policy gap and the near-term premium contain little information that predicts downturns. Moreover, we show that the quality of fit and the predictive ability of our model is at par with other probit specifications that only include nominal yield spreads data.
Why does the NTFS predict that a recession is not imminent?
We use our framework to explore why, using data through the first quarter of 2022, Engstrom and Sharpe (2022) find that the NTFS predicts a low probability that the U.S. economy will transition into a recession over the next year. Our analysis has highlighted that the predictive power of the NTFS mostly stems from the information contained in the current monetary policy stance and the slope of expected inflation. Using data through early June 2022, we estimate a largely accommodative current policy gap that lowers the odds of an incipient economic downturn. We also find a downward sloping expected inflation curve. Historically a decrease in the slope of the expected inflation curve is associated with a higher likelihood of a recession. Of these two counter-acting effects the first one prevails, resulting in the low recession probability documented by Engstrom and Sharpe (2022). This is a rare combination of events that has not been observed prior to a U.S. recession over our sample period, extending back to the early 1960s.
What lies ahead as monetary policy continues to tighten?
While the NTFS is currently positive, market participants anticipate further monetary policy tightening in the upcoming months.5 If such interest rates hikes indeed materialize, they could result in a lower NTFS and thus an increase in recession probabilities. In the second part of this note, we use our NTFS decomposition to inform the channels that can lead to such a change in the economic outlook. We simulate future realizations of the policy gap and the slope of inflation forecasts from the ABC model from current initial conditions through 2023Q4. Through this analysis, we show that future inflation outcomes and the odds of a recession depend critically on both the pace of removal of monetary policy accommodation and on how restrictive the monetary policy stance will become over the medium term. In particular, we highlight two scenarios:
- Baseline Case: The ABC model predicts that nominal and real yields will rise over the next six quarters, the current policy gap will narrow and become mildly restrictive in mid-2023, while core inflation will fall and remain around one percentage point above its model-implied longer-run expectations through 2023. The expected tightening of the policy gap and a downward-sloping expected inflation path combine to increase the one-year-ahead recession probability to about 35% by 2023, compared with the 16% unconditional estimate. Such a level is similar to the one estimated ahead of the 1994 monetary policy tightening cycle that was followed by a soft-landing scenario.
- Tighter-Policy Scenario: We then consider an alternative scenario characterized by faster removal of monetary policy accommodation relative to the baseline forecasts. When we focus on model simulations in which the policy gap is markedly restrictive over 2023, we find that core inflation declines more rapidly than under the baseline, closing the gap with its model-implied longer-run expectations almost completely by the end of 2023. By that date, in this scenario the likelihood of a recession approaches 60%, a level that, based on our historical estimates, is generally followed by a recession in our sample.
In sum, our results highlight the role of the policy gap and the slope of near-term expected inflation as important predictors of U.S. recessions. Moreover, our analysis allows us to quantify the outcomes associated with monetary policy scenarios characterized by a different pace of removal of accommodation, and different degrees of overshooting of a model-consistent measure of the neutral long-run real rate. In our baseline case, the model expects the policy gap to close and become mildly restrictive, inflation to decline, and recession probability to increase to around 35% by 2023. However, we also identify a tighter-policy scenario for monetary policy in which the policy gap closes more rapidly and becomes more restrictive than under the baseline over the same time horizon. In this scenario inflation retreats more rapidly at the cost of a significantly higher recession risk. This analysis highlights the relationship between the potential risk of an economic contraction and the degree of monetary policy tightness that is enacted in response to inflationary pressures. Our results hinge on several modeling assumptions, e.g., we focus on the signal contained in the NTFS rather than the information in long-maturity yields. We discuss the reasons for these modeling choices and their implications for our results in the concluding section, leaving more work on this topic to future research.
1. A Decomposition of the Near-Term Slope of the Yield Curve
The NTFS is a measure of the short-run nominal yield curve slope, defined as:
$$$${\rm NTFS}_t={\rm fwd}_t^6-y_t^1,$$$$
Where $${\rm fwd}_t^6$$ is the six-quarter ahead one-quarter Treasury rate and $$y_t^1$$ is the one-quarter Treasury rate at time $$t$$.
The NTFS closely mirrors market participants' expectations for the trajectory of the Federal Funds rate over the near future. Such expectations are influenced by views about the business cycle and monetary policy. For instance, if market participants anticipate a recession, they will also likely expect that monetary policymakers will lower the policy rate to provide accommodation. The expectation of lower future rates reduces forward rates, resulting in a negative NTFS. Thus, to the extent that markets' expectations are correct, a negative NTFS is associated with a heightened recession probability.
While the NTFS is an important measure of near-term monetary policy expectations, several underlying forces can affect its fluctuations. The spread embeds information about market participants' expectations about the path of real interest rates relative to their long-run equilibrium level. When real rates are at their neutral level, monetary policy is neither accommodative nor restrictive on the economy. In contrast, a negative policy gap indicates that the current, or future expected, monetary policy is accommodative, while a positive gap occurs when the Federal Reserve removes accommodation, to the point that the policy stance becomes restrictive. The NTFS also reflects market participants' expectations of future inflation outcomes and their attitudes toward interest rate risk, which all can carry information about the future evolution of the economy. Thus, movement in any of these components can drive fluctuations in the NTFS and help forecast downturn risk in their own right.
Motivated by these insights, we explore the distinct channels through which the NTFS predicts recessions. We decompose the NTFS in terms of (i) current and (ii) expected measures of the policy gap—an indicator of the degree of accommodation of the monetary policy stance, defined as the difference between the short-term real rate and a model-consistent estimate for the natural rate; (iii) the slope of the expected inflation path, and (iv) the term premium on short-maturity forward rates:6
(1) $${\rm NTFS}_t \approx \left(r_{t+6}^{e,1}-r_t^{\ast}\right) - \left(r_t^1-r_t^{\ast}\right) + (\pi_{t+7:t+10}^e-\pi_{t+1:t+4}^e) + (tp_t^{t+6})$$.
The first two terms capture the slope of the policy gap over the next six quarters, defined as the distance of the expected and current real spot rates, $$r_{t+6}^{e,1}$$ and $$r_t^1$$, from the natural rate, denoted by $$r_t^{\ast}$$. The next term, $$(\pi_{t+7:t+10}^e-\pi_{t+1:t+4}^e)$$, reflects the slope of the times $$t+6$$ and $$t$$ one-year-ahead headline inflation forecasts computed using time $$t$$ information. The last term, $$tp_t^{t+6}$$, is the term premium that gauges the compensation for real and inflation risks embedded in the six-quarter forward nominal rate. All such variables respond over time to aggregate shocks to the outlook and to the conduct of monetary policy.
While the NTFS is easily measured with interest rate data, its constituents are not observable. To overcome this problem, in what follows we rely on the ABC model to estimate the expectation and risk premium components in term structure data. The ABC model jointly prices the real and nominal term structures using no-arbitrage restrictions. Estimation exploits a panel of nominal Treasury yields and CPI data on core, food, and energy inflation. In the model, the three inflation series have distinct dynamics that allow for a different degree of persistence and volatility of each inflation component. The three individual series recombine into a single headline inflation measure that ties nominal and real bond prices together. An important feature of the ABC model that we exploit in our analysis is that it can be estimated over a long historical sample of quarterly data starting in 1962Q2 and ending in 2022Q2.7 During this long window the U.S. economy has experienced alternating periods of inflationary pressure and easing, several monetary policy cycles, expansions, and recessions with different underlying drivers. These events will inform the ABC estimates of the terms in equation (1) and thus help us to identify the channels through which the NTFS predicts recessions. As a proxy for the natural rate $$(r_t^{\ast})$$, we use the ABC estimate of the level of real rates expected to prevail between five and ten years in the future. We interpret this measure as a market-based estimate of long-run equilibrium real rates, which serves as an approximation to the natural rate of interest.8 Finally, the proxy for expected inflation computed at quarters $$t$$ and $$t+6$$ is the average of quarterly ABC expected headline inflation over the following 4 quarters.
In the next section, we use the ABC estimates of the NTFS components to predict whether the U.S. economy will transition into a recession in the next four quarters. We compare these results to those from a model that relies on the NTFS alone as a leading indicator of economic activity.9
1.1 The Policy Gap, the Expected Inflation Slope, and Recession Probabilities
Table 1 shows estimates for the marginal effects of the explanatory variables of three probit models, on the probability that the U.S. will transition into a recession in any of the following four quarters.10 The first column displays the estimates for the benchmark model, in which the probability of a recession depends only on the NTFS. The second column displays the estimates for a probit specification estimated on the four NTFS components given on the right-hand side of equation (1): the six-quarters-slope of the expected inflation curve, the current policy gap, the six-quarter-ahead expected policy gap, and the term premium. The third column displays the estimates for our preferred probit model that excludes the six-quarter-ahead expected policy gap and the term premium, which are insignificant in model (2).
Table 1. Probit Models to Forecast Recessions
| Model (1) | Model (2) | Model (3) | |
|---|---|---|---|
| NTFS | -0.23*** | n.a. | n.a. |
| (0.03) | n.a. | n.a. | |
| Expected Inflation Slope | n.a. | -0.29*** | -0.27*** |
| n.a. | (0.04) | (0.03) | |
| Policy Gap (r – r*) | n.a. | 0.15*** | 0.13*** |
| n.a. | (0.02) | (0.02) | |
| Policy Gap 6Q-ahead (r – r*) | n.a. | -0.05 | n.a. |
| n.a. | (0.03) | n.a. | |
| Term Premium | n.a. | -0.06 | n.a. |
| n.a. | (0.04) | n.a. | |
| R-squared | 0.74 | 0.75 | 0.72 |
| AIC | 147 | 137 | 136 |
| N | 237 | 237 | 237 |
Model (1) confirms the finding of Engstrom and Sharpe (2019) that the NTFS is a significant predictor of economic downturns, with narrowing spreads pointing to a higher likelihood that the U.S. economy will transition into a recession in any of the next four quarters. Model (2) and model (3) show that an increase of the current policy gap, i.e., tighter policy today, is associated with higher probability of an upcoming recession. Moreover, lower future expected inflation relative to current expected inflation (a negative slope in the expected inflation curve) points to a higher likelihood of recession. This finding is mostly driven by the experience observed in the second part of the sample period, during which economic downturns have generally been accompanied by mild or even negative inflation.11 The marginal effect of the expected future policy gap and the term premium are not significant in model (2) and therefore we do not include these variables in model (3).12 Model (3) confirms that the bulk of predictive power in the NTFS comes from the current policy gap and the expected inflation slope, without loss of fit relative to model (1) and model (2) measured by the pseudo-R2 of McKelvey and Zavoina (1975) or by the Akaike information criterion.13
Figure 1 compares the fitted recession probability estimates based on model (1), the blue solid line, and (3), the green dashed line, as well as the 16% unconditional estimate of the recession-transition probability (the dotted line).14 While the signal that the probit models provide ahead of recessions is comparable across the two specifications, the fitted recession probability for model (3) features fewer false positives than the model that relies only on the NTFS as a leading indicator. This is visible in the mid-1960s and, more recently, in response to the taper tantrum episode of 2013.15
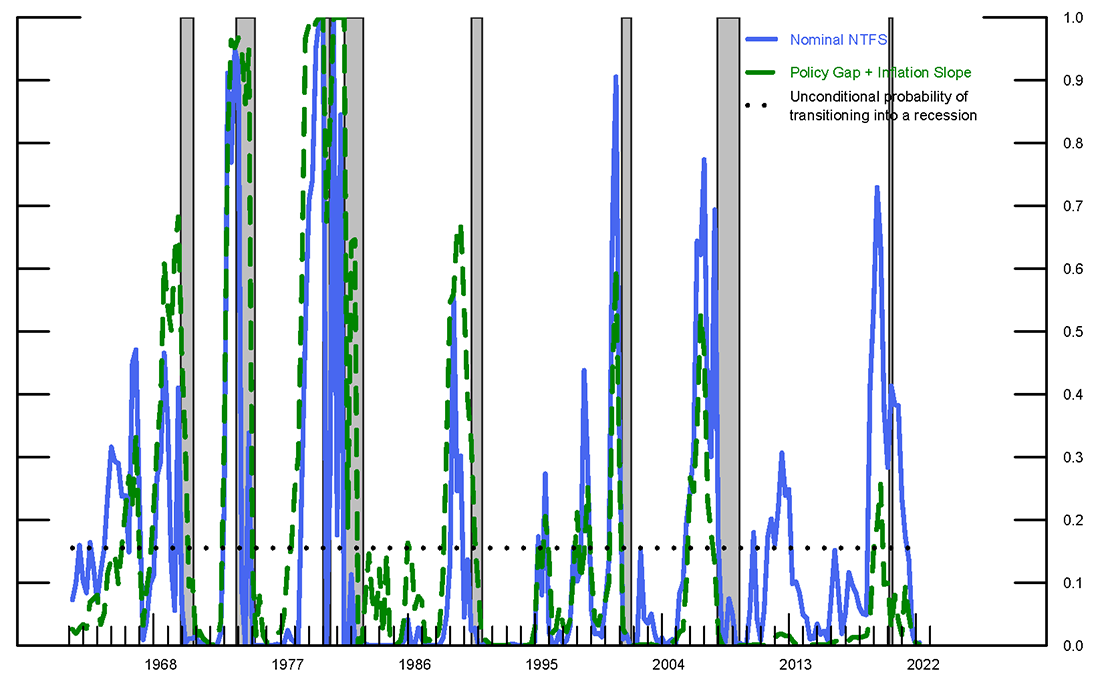
Note: This chart depicts fitted recession probabilities, conditional on being in an economic expansion, using quarterly data from 1962Q2 to 2022Q1. The blue line shows results from the probit model using the nominal NTFS as the independent variable. The green dashed line shows results from the probit model using two explanatory variables: the current policy gap and headline inflation slope. The black dotted line marks the unconditional probability of transitioning from an expansion into a recession, which is 15.5%.
Sources: Interest rate data from FRB. Expected inflation and real rates from ABC model.
Turning now to the current outlook, in model (1) a wide and positive NTFS predicts a near-zero probability that a recession will occur over the next four quarters. This evidence confirms the result highlighted by Engstrom and Sharpe (2022) for the first quarter of 2022 and extends it to 2022Q2. Model (3) helps us to interpret this finding. There are two opposing forces at play: On the one hand, the ABC estimate of the policy gap, $$(r_t^1 – r_t^{\ast})$$, is wide and negative in 2022Q1-2022Q2, pointing to a current high degree of monetary policy accommodation that is typically associated with a recovering economy. On the other hand, the expected inflation path is downward sloping, suggesting a higher likelihood of a downturn.16 On net, the large amount of monetary policy accommodation still at play in the U.S. economy outweighs the signal associated with a downward-sloping inflation curve, implying low odds of an incoming recession.
It is worth noting that the current combination of a wide and negative policy gap and downward expected inflation slope has not been observed ahead of any other recession over our sample period that extends back to the early 1960s.17 Figure 2 shows median (the solid lines) and interquartile ranges (the light blue shaded areas) of the current policy gap (left) and the near-term inflation slope (right) one to six quarters ahead of a historical contraction, and compares such realizations with the 2022Q2 estimates of the same two variables (the black dashed lines). The plots highlight that ahead of recessions the ABC estimates of the current policy gap are positive, while the near-term inflation slope tends to decline and, at times, turns negative. As of early June 2022, the ABC model estimates a negative expected inflation slope. However, the estimate of the current policy gap is wide and negative.
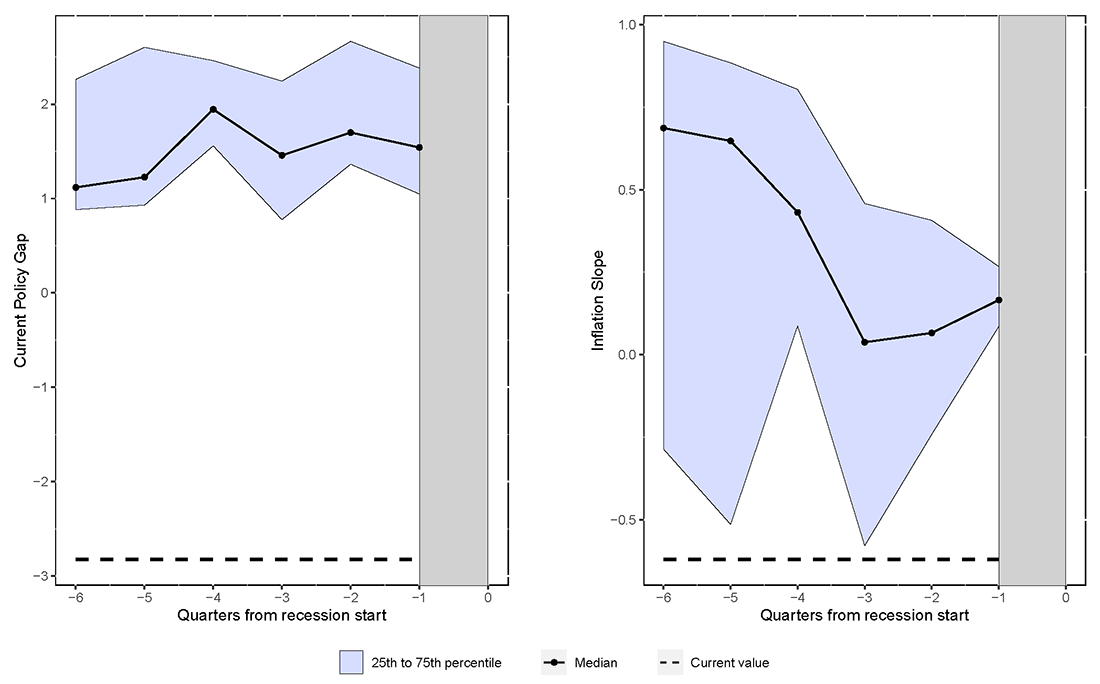
Note: These charts show the evolution of the policy gap and inflation slope leading up to recessions using quarterly data from 1962Q2 to 2022Q2. Shaded bands mark the upper and lower quartiles and the grey vertical bar indicates the beginning of a recession episode. The dashed line shows the current value of each measure for 2022Q2.
Source: Authors' calculations.
Looking forward, the Federal Reserve has signaled the possibility of additional federal funds rate increases; see, e.g., the estimates of the appropriate monetary policy path in the June 2022 Summary of Economic Projections. Consistent with such communications, market participants anticipate further monetary policy tightening in the coming months; for instance, the 2023 consensus forecasts of the federal funds rate in the July 2022 Blue Chip Survey of Financial Indicators are in the 3.4-3.5% range. If these expectations where to materialize, as the policy rate increases the NTFS could decrease or even turn negative, and the Engstrom and Sharpe (2019) model would then point to a much higher recession probability.
In the last part of this note, we turn to the NTFS decomposition to ask how the pace of future monetary policy tightening could influence recession risk and inflation outcomes.
2. What lies ahead as monetary policy continues to tighten?
An intuitive and key insight of our analysis is that the magnitude and sign of the current monetary policy gap has a significant impact on the likelihood of an upcoming recession. In this section, we quantify the impact of possible future monetary policy tightening on downturn risk and inflation outcomes. We simulate 100,000 samples of Treasury yields and inflation rates from the conditional density implied by our estimates of the ABC model, starting from 2022Q2 as our initial condition and going through 2023Q4. Along each of the simulated paths we construct future realizations of the current policy gap and the expected inflation slope and we use them to evaluate the recession probability predicted by our preferred probit model (3). We then compare outcomes across two scenarios: i) the baseline case, which reflects the ABC model forecasts or, equivalently, the average of the 100,000 simulated paths and ii) a tighter-policy scenario, characterized by faster removal of monetary policy accommodation and identified by the average of the simulated paths in which policy becomes restrictive by the end of 2022.18
Figure 3 compares the policy gap, the core inflation gap—defined as the difference between the annual rate of core inflation and its longer-run level expected by the ABC model—and recession probabilities for the baseline case (the blue lines), with the corresponding outcomes that would realize in the tighter-policy scenario (the red dashed lines). In the baseline case, real rates increase over the next year in response to monetary policy tightening and the policy gap shown in the left panel narrows and turns positive in the second quarter of 2023. As the inflation gap, shown in the middle panel, closes, the expected inflation slope (not shown) narrows and remains negative, approaching zero over the next few years. Accordingly, a narrowing policy gap and a persistent negative expected inflation slope increases the probability of recession implied by our preferred probit model (3) from its current near-zero estimate to about 25% percent in 2022Q4, reaching 35% by the end of 2023, as shown in the right panel. These probabilities are comparable to the levels estimated ahead of the 1994 monetary policy tightening that resulted in a soft-landing—i.e., a slowdown in inflation in the absence of an economic recession.
Figure 3. Expected Path of the Policy Gap, Core Inflation and Probability of Recession under Two Scenarios
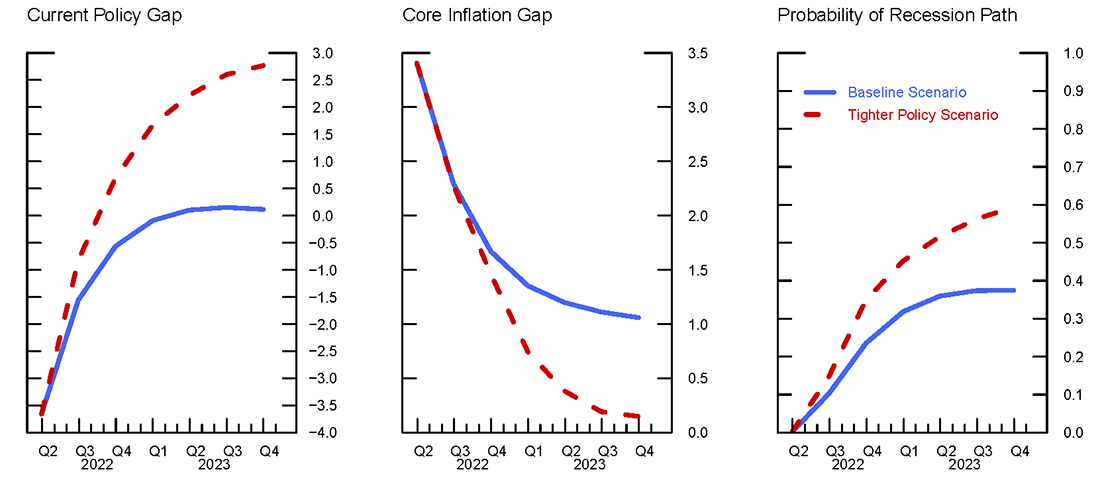
Note: This chart shows the expected paths of the policy gap, core inflation, and recession probabilities in the baseline scenario (blue line) and the tighter scenario in which monetary policy becomes restrictive in 2023 (red line).
Source: Authors' calculations.
By design, the policy gap closes more rapidly in the tighter-policy scenario. A faster removal of monetary policy accommodation leads inflation to decrease more rapidly than in the baseline scenario, and the one-year ahead recession probability increases to 35% by the end of 2022, compared to 25% in the baseline case. In this more restrictive scenario, the policy gap keeps tightening over 2023, and the core inflation gap closes by the end of 2023. By the end of 2023 the probability of recession implied by the model approaches 60% under the tighter-policy scenario, a level that in our historical estimates has generally been followed by a recession.
Conclusion
In this note, we use a dynamic term structure model to show that the current policy gap and the slope of the expected inflation path are the NTFS components that play the main role in predicting recessions. The decomposition helps us to explain why the NTFS does not currently forecast a recession, as shown by Engstrom and Sharpe (2022). We show that at present, the model estimates a wide and negative policy gap. Such high degree of monetary policy accommodation outweighs the signal coming from our estimate of a negative expected inflation slope, which points instead to a more likely contraction.
Going forward, however, the model expects monetary policy to become more restrictive, and thus it estimates a higher likelihood of a downturn. In our baseline case, we forecast increasing real rates, a narrowing policy gap, and a 35% recession probability by the end of 2023. Moreover, we illustrate a second, tighter-policy scenario in which policymakers tighten the stance of monetary policy more rapidly than expected by the model, pushing the real rate above neutral in the first quarter of 2023. In this alternative scenario, inflation declines more rapidly than in the baseline case, at the cost of a higher downside risk for economic activity, as the one-year ahead recession probability approaches 60% by the end of 2023.
Of course, our results hinge on several modeling assumptions. They are robust to many alternative choices that we have examined, but certainly not all. First, we rely on a specific dynamic term structure model to parse the expectations and risk premium NTFS components, and to infer the long-run equilibrium real rate $$r^{\ast}$$. The literature has provided a wide range of alternative $$r^{\ast}$$ estimates that are generally characterized by a high degree of uncertainty. In unreported checks, we verify that our main conclusions are robust to adopting such alternative measures.19 Second, and more importantly, our analysis focuses on the decomposition of the Engstrom and Sharpe (2019) NTFS, rather than long-term yield spreads. We focus on the NTFS because of both its success as a leading indicator of economic activity, and the desire to better understand the link between the short- and medium-term monetary policy stance and recessions. Usually, the information content of the NTFS is qualitatively similar to that of long-term spreads. However, current times are different. The recent decline in the ten- minus two-year spread, which has turned negative, has received considerable attention as it has already started to point toward a significantly higher probability of recession. Part of the signal from the long-term spread comes from the slope of long-term risk premia. For instance, Benzoni, Chyruk, and Kelley (2018) show that the slope in long-term inflation- and real-rate risk premia are significant predictors of incoming downturns. In particular, the ABC model estimates a recent increase in the real rate risk premium, which in Benzoni, Chyruk, and Kelley (2018) is associated with a significant increase in downturn risk.20 This discussion underscores that more work is warranted to better understand the link between the yield curve and the economy. We leave further analysis to future research.
References
Ajello, Andrea, Luca Benzoni, and Olena Chyruk (2020). "Core and 'Crust': Consumer Prices and the Term Structure of Interest Rates," Review of Financial Studies, Vol. 33, No. 8, pp. 3719–3765.
Ang, Andrew, Geert Bekaert, and Min Wei (2008). "The term structure of real rates and expected inflation," Journal of Finance, Vol. 63, No. 2, pp. 797-849
Bauer, Michael D., and Thomas M. Mertens (2018). "Economic forecasts with the yield curve," FRBSF Economic Letter, Federal Reserve Bank of San Francisco, No. 2018-07, March 5.
Bauer, Michael D., and Thomas M. Mertens (2018). "Information in the yield curve about future recessions," FRBSF Economic Letter, Federal Reserve Bank of San Francisco, No. 2018-20, August 27.
Benzoni, Luca, Olena Chyruk, and David Kelley (2018). "Why Does the Yield-Curve Slope Predict Recessions?" Chicago Fed Letter Number 404.
Cooper, Daniel H., Jeffrey C. Fuhrer, and Giovanni P. Olivei (2020). "Predicting Recessions Using the Yield Curve: The Role of the Stance of Monetary Policy," Current Policy Perspectives 87522, Federal Reserve Bank of Boston.
Engstrom, Eric C., and Steven A. Sharpe (2019). "The Near-Term Forward Yield Spread as a Leading Indicator: A Less Distorted Mirror," Financial Analysts Journal, 75:4, 37-49.
Engstrom, Eric C., and Steven A. Sharpe (2022). "(Don't Fear) The Yield Curve, Reprise," FEDS Notes. Washington: Board of Governors of the Federal Reserve System, March 25, 2022
Estrella, Arturo, and Gikas A. Hardouvelis (1991). "The Term Structure as a Predictor of Real Economic Activity," The Journal of Finance 46(2): 555–576.
Estrella, Arturo, and Frederic S. Mishkin (1998). "Predicting U.S. recessions: Financial variables as leading indicators," Review of Economics and Statistics, Vol. 80, No. 1, February, pp. 45–61.
Fama, Eugene F. (1986). "Term premiums and default premiums in money markets," Journal of Financial Economics, Vol. 17, No. 1, pp. 175–196.
Favero, Carlo A., Iryna Kaminska, and Ulf Söderström (2005). "The predictive power of the yield spread: Further evidence and a structural interpretation," working paper, Università Bocconi.
Hamilton, James D., and Dong Heon Kim (2002). "A reexamination of the predictability of economic activity using the yield spread," Journal of Money, Credit and Banking, Vol. 34, No. 2, pp. 340–60.
Harvey, Campbell R. (1988). "The real term structure and consumption growth," Journal of Financial Economics, Vol. 22, No. 2, pp. 305–333.
Harvey, Campbell R. (1989). "Forecasts of Economic Growth from the Bond and Stock Markets," Financial Analysts Journal 45(5): 38–45.
Harvey, Campbell R. (1991). "The term structure and world economic growth," Journal of Fixed Income, Vol. 1, pp. 4–17.
Harvey, Campbell R. (1993). "The term structure forecasts economic growth," Financial Analysts Journal, May/June, pp. 6–8.
Holston, K., Laubach, T., & Williams, J. C. (2017). Measuring the natural rate of interest: International trends and determinants. Journal of International Economics, 108, S59–S75.
Kessel, Reuben A. (1965). "The cyclical behavior of the term structure of interest rates," National Bureau of Economic Research, occasional paper, No. 9.
McKelvey, Richard D., and William Zavoina (1975). "A statistical model for the analysis of ordinal level dependent variables," The Journal of Mathematical Sociology, 4:1, 103-120.
Rudebusch, Glenn D., Brian P. Sack, and Eric T. Swanson (2007). "Macroeconomic implications of changes in the term premium," Federal Reserve Bank of St. Louis, Review, July/August, Vol. 89, No. 4, pp. 241–269.
Rudebusch, Glenn D., and John C. Williams (2009). "Forecasting recessions: The puzzle of the enduring power of the yield curve," Journal of Business & Economic Statistics, Vol. 27, No. 4, pp. 492–503.
Stock, James H., and Mark W. Watson (1989). "New Indices of Coincident and Leading Indicators," in NBER Macroeconomic Annual 4, edited by Olivier J. Blanchard and Stanley Fischer, 351–394. Cambridge, MA: MIT Press
Wright, Jonathan H. (2006). "The yield curve and predicting recessions," Board of Governors of the Federal Reserve System, Finance and Economics Discussion Series, No. 2006-7.
Appendix
The NTFS can be expressed as the difference between the expected one-quarter nominal Treasury yield that markets believe will prevail 6 quarters from now, $$y_{t+6}^{e,1} = E_t[y_{t+6}^1]$$, and the current one-quarter yield, plus the difference in term premium on the six-quarter-ahead forward rate and on the one-quarter Treasury yield, ($$tp_t^{t+6} - tp_t^1$$), where $$ tp_t^1 = 0$$:
$$$${\rm NTFS}_t = y_{t+6}^{e,1} - y_t^1 + tp_t^{t+6}.$$$$
In the short run the Fisher equation holds in approximation, and the nominal short-term rate can be written as the sum of the real rate and expected inflation k-periods ahead, multiplied by a constant $$0 \lt \delta \le 1$$,
$$$$ y_t^1 \approx r_t^1 + \delta\pi_{t+1:t+k}^1.$$$$
Hence, the NTFS can be further decomposed as the sum of the real forward spread, $$(r_{t+6}^{e,1}-r_t^1)$$, the slope of the expected inflation path $$\delta(\pi_{t+7:t+6+k}^e - \pi_{t+1:t+k}^e)$$, and the term premium term, $$tp_t^{t+6}$$. Using an annual expected rate of inflation, with $$k$$= 4, and setting $$\delta$$=1, we obtain
$$$$ {\rm NTFS}_t \approx (r_{t+6}^{e,1} - r_t^1) + (\pi_{t+7:t+10}^e - \pi_{t+1:t+4}^e) + (tp_t^{t+6}).$$$$
Adding and subtracting the natural rate $$r_t^{\ast}$$ on the right-hand side of the previous expression and rearranging terms, we obtain that the NTFS can be decomposed in three terms,
$$$$ {\rm NTFS}_t \approx \left(r_{t+6}^{e,1} - r_t^{\ast}\right) - \left(r_t^1 - r_t^{\ast}\right) + (\pi_{t+7:t+10}^e - \pi_{t+1:t+4}^e) + (tp_t^{t+6}), $$$$
which is equation (1) in the text.
1. Luca Benzoni is with the Federal Reserve Bank of Chicago; Andrea Ajello, Makena Schwinn, Yannick Timmer, and Francisco Vazquez-Grande are with the Board of Governors of the Federal Reserve System. We are grateful to Gene Amromin, Jim Clouse, Rochelle Edge, Eric Engstrom, Giovanni Favara, Spencer Krane, Trevor Reeve, David López-Salido, Steve Sharpe, and Min Wei for many insightful comments. All errors and omissions are our own. The views expressed in this note are solely those of the authors and should not be interpreted as reflecting the views of the Federal Open Market Committee, the Board of Governors of the Federal Reserve System, the Federal Reserve Bank of Chicago, or of anyone else associated with the Federal Reserve System. Return to text
2. Many studies have documented the predictive power of the term structure slope to forecast recessions. Early work by Kessel (1965) was followed by several influential articles, e.g., Fama (1986), Harvey (1988, 1989, 1991, and 1993), Stock and Watson (1989), Estrella and Hardouvelis (1991), Estrella and Mishkin (1998), Rudebusch and Williams (2009). Return to text
3. Data for 2022Q2 includes the CPI release of June 10th and Treasury yields through June 9th. Return to text
4. Ajello, Benzoni, and Chyruk (2020) document that the ABC model outperforms a wide array of statistical models in forecasting core and headline inflation as well as interest rates. Moreover, they show that the ABC prediction errors are systematically lower than those of professional survey forecasts, such as the Survey of Professional Forecasters and the Blue Chip Economic Indicators. Return to text
5. For instance, the consensus forecasts for the 2023 realization of the federal funds rate are in the 3.4-3.5% range in the Blue Chip Survey of Financial Indicators released on July 1, 2022. This forecast is slightly below the 3.6-4.1% central tendency projection for the 2023 federal funds rate associated with the appropriate monetary policy path in the Summary of Economic Projections (SEP) released in June 2022 by the Federal Open Market Committee. Return to text
6. See the Appendix below for more details on how we derive equation (1). Return to text
7. More specifically, we use inflation and Treasury yields data available through June 10, 2022. There is a trade off in the choice of the sample period. On the one hand, including the inflationary episodes of the 1960-70s is beneficial to study the recent, unusually high inflation realizations. On the other hand, this choice forces us to span a sample period characterized by multiple regimes of monetary policy that might be better captured by, e.g., a regime switching model (see, e.g., Ang, Bekaert, and Wei (2008)). Indeed, using data prior to the recent inflation outburst, ABC show that their model has a better out-of-sample performance when estimated on post-1985 data. Return to text
8. We define the natural rate of interest as the real short-term interest rate that would prevail absent transitory disturbances. Our proxy for the natural rate is the short-term real rate expected to prevail in the longer run as all transitory shocks have dissipated. This is different from shorter-run estimates of r* from dynamic general equilibrium models, in which the natural rate is the real rate that would prevail in an efficient equilibrium absent nominal frictions. See Holston, Laubach and Williams (2017) and references therein for more details on the distinction between natural and neutral rates. Return to text
9. This extends previous work by Ang, Piazzesi, and Wei (2006), Bauer and Mertens (2018a and b), Benzoni, Kelley, and Chyruk (2018), Favero, Kaminska, and Söderström (2005), Hamilton and Kim (2002), Rudebusch, Sack, and Swanson (2007), and Wright (2006), who exploit a term‐structure decomposition into its expected nominal rate path and risk premium terms. Return to text
10. We estimate probit models to forecast recession conditioned on whether the U.S. economy is currently in expansion or in recession. The dependent variable is an indicator variable that is equal to 1 if the U.S. economy is in a recession at any time over the next 4 quarters and is 0 otherwise. The dating of recessions follows the National Bureau of Economic Research (NBER) convention. We use the "NBER based Recession Indicators for the United States from the Peak through the Trough" from FRED (Federal Reserve Economic Data).
The recession probability implied by the specification of model (2) takes the following form:
$$$$ P\left({NBER}_{t+1:t+4}=1|{NBER}_t\right) = \Phi \left(\alpha_{NBER_t}+\beta_{NBER_t}^{\pi}(\pi_{t+7:t+11}^e - \pi_{t+1:t+4}^e) + \beta_{NBER_t}^{gap} (r_t^1-r_t^{\ast}) + \beta_{NBER_t}^{gap^e}(r_{t+6}^{e,1}-r_t^{\ast}) + \\\\ + \beta_{NBER_t}^{tp}(tp_t^{t+6}) \right) $$$$
Where $$\Phi$$ represents the cumulative distribution function of a standard normal distribution. The model parameters take two values depending on whether the U.S. economy is assessed to be in an expansion ($$NBER_t=0$$) or in a recession ($$NBER_t=1$$). Table 1 only displays marginal effects and not model parameter estimates.Return to text
11. Indeed, we find that the marginal effect of the near-term inflation slope is even stronger when we estimate the probit model with the NTFS decomposition produced by the ABC model over the post-1985 period. Return to text
12. Ang, Piazzesi, and Wei (2006) also find that the term premium is insignificant in predicting economic activity. Return to text
13. Recent work by Cooper, Fuhrer and Olivei (2020) documents that the stance of monetary policy plays a determinant role in forecasting recessions. While they focus on the forecasting power of the policy gap as a complement to longer-term yield spreads, we document that the policy gap and the expected inflation slope drive the forecasting power of the near-term forward spread. Return to text
14. The unconditional estimate of the recession-transition probability is computed as the fraction of times, measured in quarters, during which the economy was in a recession since 1962. Return to text
15. Consistent with these findings, we document in unreported results that the variables in our NTFS decomposition predict real activity measures such as GDP growth in linear regressions. Return to text
16. Note that if inflation pressures were to decrease for reasons other than a weakening of the economic outlook—e.g., due to a normalization of the supply chain, and a resolution of geopolitical tensions in Europe—a negative expected inflation slope might be less informative about the probability of an upcoming contraction. Return to text
17. Univariate probit models (not shown) fitted to each NTFS component independently show that the negative values of expected inflation slope pointed to high recession probabilities before 1980—and especially in the 1970s. The contribution of the inflation slope predictor appears muted past 1980 when revisions in inflation expectations were less volatile and has started playing a more prominent role in pointing to a future downturn since the end of 2021. Return to text
18. As of June 10, 2022, the baseline ABC model predicts that nominal yields will rise to 2.5% in 2022 and peak at 2.8% in 2023. In the alternative more restrictive scenario, the nominal spot rate path peaks at 5.1% in 2023. (Note that in the June 2022 SEP, the ranges for the federal funds rate at the end of 2022 and 2023 were 3.1 to 3.9% and 2.9 to 4.4%, respectively.) Core CPI inflation in the baseline scenario declines to 3.8% by the end of 2023, and the longer-run core inflation expectation, defined as the 5-year-5-year-forward average core inflation rate, is 2.7%. In the alternative scenario core CPI inflation in 2023 is 3.1% and the longer-run expectation is 3.1%. Return to text
19. In unreported robustness checks, we have also considered $$r^{\ast}$$ estimates obtained from the models of Holston, Laubach and Williams (2017), Johannsen-Mertens (2016), Lewis and Vazquez-Grande (2017), Lubik and Matthes (2015), and Del Negro et al. (2017). We obtain qualitatively the same results for all the right hand-side variables except for the coefficients on the 6-quarter-ahead expected policy gap, which for some models is estimated to be negative and significant. Return to text
20. In probit model (2), the slope of the near-term premium is insignificant, while the risk-premia slopes are significant in Benzoni, Chyruk, and Kelley (2018). There are two reasons for this discrepancy. First, in this article we focus on a decomposition of the NTFS and therefore only consider the effect of the short-term premium, which is smaller and less cyclical than the premia estimated on longer-term yields. Second, Benzoni et al. decompose the term-premium slope into its inflation and real-rate components, which they find to have marginal effects of opposite sign. Return to text
Ajello, Andrea, Luca Benzoni, Makena Schwinn, Yannick Timmer, and Francisco Vazquez-Grande (2022). "Monetary Policy, Inflation Outlook, and Recession Probabilities," FEDS Notes. Washington: Board of Governors of the Federal Reserve System, July 12, 2022, https://doi.org/10.17016/2380-7172.3175.
Disclaimer: FEDS Notes are articles in which Board staff offer their own views and present analysis on a range of topics in economics and finance. These articles are shorter and less technically oriented than FEDS Working Papers and IFDP papers.