FEDS Notes
December 13, 2019
Out-of-Sample Performance of Recession Probability Models
Tyler Pike and Francisco Vazquez-Grande1
In recent months, the inversion of the yield curve—long-term bond yields below short-term interest rates—has sparked fears of an imminent recession risk for the U.S. economy and has reignited the debate on how to best use information from fixed-income markets to predict recession risks. The workhorse statistical model used to estimate the probability of a recession is typically a probit model, with independent variables constructed using data from the Treasury and corporate bond markets. To assess the goodness of fit of these models, it is customary to rely on the in-sample coefficient of determination (R2.) As policymakers take their decisions in real time, however, in-sample R2 can be misleading in gauging the usefulness of a given model.
This note discusses the out-of-sample (OOS) performance of several probit models used to assess the likelihood that the U.S. economy will be in a recession within the following year. We find that bivariate probit models that use a long- or short-term spread and the excess bond premium (EBP) of Gilchrist and Zakrajsek (2012) perform well OOS across estimation and evaluation subsamples. We also find that when estimating the probability of transitioning into a recession—and, therefore, not evaluating model performance when the economy already is in a recession—the OOS performance of models using measures of the term spread and EBP remains high, while the performance of models that use only measures of the term spread or the principal components of the yield curve increases significantly.
Methodology
We use model specifications and predictive variables proposed by Favara and others (2016); Johansson and Meldrum (2018); and Engstrom and Sharpe (2019). The dependent variable is an indicator variable that is equal to 1 if the U.S. economy is in a recession at any time over the next 12 months and is 0 otherwise.2 The independent variables include six commonly used recession predictors from the Treasury and the nonfinancial corporate bond markets: two measures of the slope of the yield curve (the "long-term spread" and the "near-term forward spread" (NTFS)), the first three principal components of the yield curve, and one measure of investor risk sentiment in the corporate bond market (the EBP).
The long-term spread (TS)—the difference between the 10-year and 3-month Treasury yields—is commonly regarded as the best signal of impending recessions (Estrella and Mishkin, 1998; Ang, Piazzesi, and Wei, 2006; Rudebusch and Williams, 2009). The NTFS of Engstrom and Sharpe (2019)—the difference between the three-month forward rate six quarters ahead and the yield on the three-month T-bill—is a measure of market expectation for the near-term direction of monetary policy. The first three principal components of the term structure of Treasury yields summarize almost all of the information in Treasury yields of different maturities without having to take a stand on which maturity spreads contain the most information. The EBP of Gilchrist and Zakrajsek (2012)—the component of corporate bond spreads in excess of an estimate of the compensation for expected losses from corporate defaults—is a measure of investor sentiment in the corporate bond market.
The sample period goes from February 1973 until September 2019. Our OOS methodology consists of re-estimating the models every month, adding one monthly observation at the time.3 We do so to reproduce, as much as possible, the information available to policymakers at each point in time.4 We estimate six probit regression models using monthly data: three univariate models with the TS, NTFS, and EBP as the only recession predictors; two bivariate models with the following pairs of variables, TS and EBP and NTFS and EBP; and one model with the first three principal components of the term structure of Treasury yields.
One can use the model estimates to predict whether the economy will find itself in a recession at some point in the next 12 months or whether it will be in an expansion for the next 12 months. This dichotomy leads us to evaluate the performance of the models as binary classifiers. For this purpose, we use the receiver operating characteristic (ROC) curve introduced in the 1950s in the field of radar signal detection theory. The ROC is the locus of true positive rate and false positive rate implied by each of the possible binary classifiers constructed from the model estimate. A commonly used measure of the tradeoffs contained in the ROC curve is the area under the ROC curve (AUROC), where a perfect classifier has AUROC = 1, whereas a coin-toss classifier has AUROC = 0.5. The AUROC has recently been applied in economics to recession dating and forecasting by Berge and Jordà (2011); Christiansen, Nygaard Eriksen, and Vinther Møller (2014); Liu and Moench (2016); and Miller (2019).5
Results
Table 1 provides the OOS performance comparison of the six models, as measured by the AUROC, and provides confidence intervals for this summary statistic. As shown, a bivariate model with both a measure of term spreads (either TS or NTFS) and the EBP as explanatory variables has the highest OOS forecasting power. The table also shows that a univariate model with the EBP as the only predictor significantly outperforms univariate probit models that use either the long- or the short-term spreads as explanatory variables.
Table 1: Out-of-Sample performance of recession probability probit models for the U.S. economy being in a recession in the next 12 months
| Model | Out-of-Sample AUROC |
|---|---|
| TS | 0.70 [0.63, 0.76] |
| NTFS | 0.73 [0.67, 0.79] |
| EBP | 0.78 [0.72, 0.83] |
| TS + EBP | 0.88 [0.84, 0.93] |
| NTFS + EBP | 0.88 [0.84, 0.92] |
| Tsy 3PC | 0.59 [0.52, 0.65] |
Note: The AUROC is the area under the receiver operating characteristic curve, which measures the tradeoff between true and false positives in a classification problem. An AUROC of one denotes a perfect classifier. Brackets show 95 percent confidence intervals. Data start 1973:02, forecasts start 1978:03 and run through 2018:08. Data are monthly. Predictors include the near-term forward spread (NTFS) of Engstrom and Sharpe (2019), excess bond premium (EBP) of Gilchrist and Zakrajsek (2012), 10-year minus 3-month Treasury Spread (TS), and the first three principal components of the Treasury yield curve (Tsy 3PC), as in Johansson and Meldrum (2018).
Figure 1 plots the full ROC curves for univariate and bivariate models. These charts visualize the tradeoffs between true and false positives implied by the models, while table 1 merely reports the integrals of these charts. The top panel plots the ROC for three univariate models with EBP, TS, and NTFS as predictors; it shows that the model with the EBP dominates the term spread models. The bottom panel displays the ROC for two bivariate models with term spreads and the EBP as predictors and suggests there is no significant difference in terms of OOS performance between these two models.
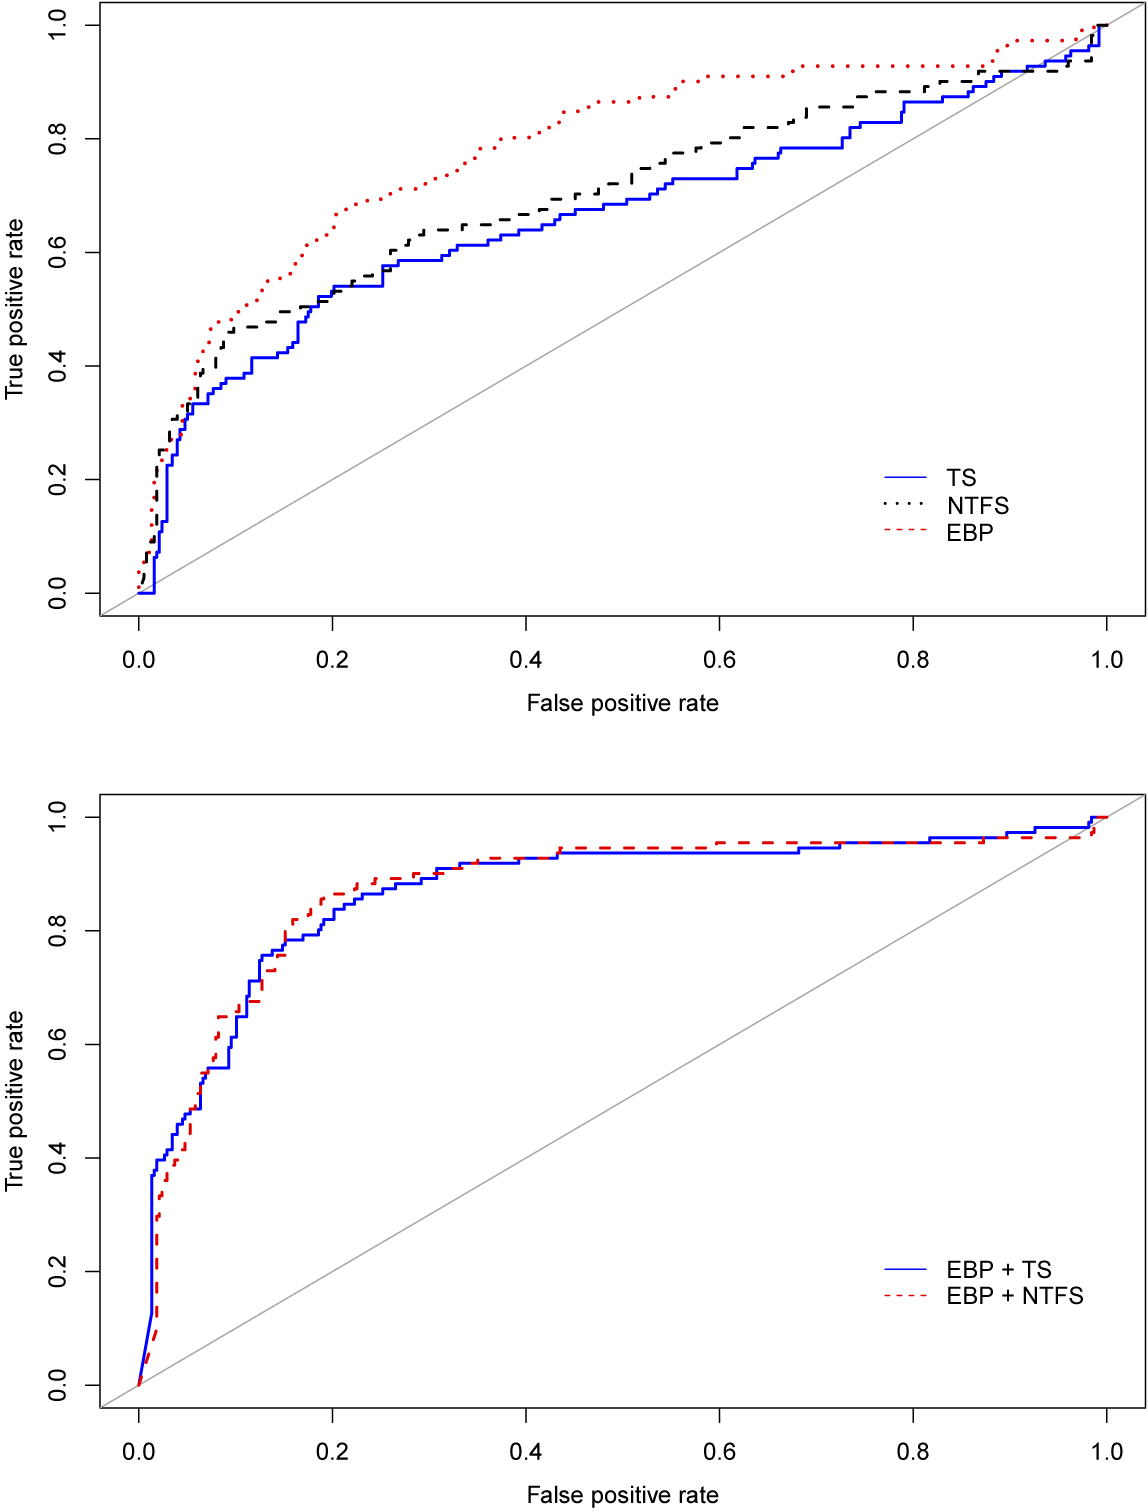
Note: The top panel shows the receiver operating characteristic (ROC) curve for the univariate probit models with term spread (TS), excess bond premium (EBP), and near-term forward spread (NTFS) as independent variables. The bottom panel shows ROC curves for the bivariate probit models with EBP and TS, and EBP and NTFS as independent variables. The ROC curve measures the ratio of true to false positives given possible cutoff values to assign observations to different classes.
We also estimate the models to calculate the probability of transitioning into a recession, rather than simply being in a recession, at some point in the next 12 months. To do so, we re-estimate the models in a restricted sample that excludes recession observations following the first recessionary month.6 As shown in table 2, the OOS performance of the EBP model decreases significantly when the recession observations are excluded from the estimation sample. This result suggests that part of the forecasting power of EBP comes from periods when the economy already is in recession. Meanwhile, models containing term spreads, and the three principal components of Treasury yields, see their performance significantly improved. The bivariate models including either term spread or the EBP continue to perform well OOS.
Table 2: Out-of-Sample performance of recession probability probit models for the U.S. economy transitioning into a recession in the next 12 months
| Model | Out-of-Sample AUROC |
|---|---|
| TS | 0.93 [0.91, 0.96] |
| NTFS | 0.92 [0.89, 0.95] |
| EBP | 0.59 [0.52, 0.66] |
| TS + EBP | 0.93 [0.90, 0.95] |
| NTFS + EBP | 0.92 [0.90, 0.95] |
| Tsy 3PC | 0.51 [0.42, 0.60] |
Note: The AUROC is the area under the receiver operating characteristic curve, which measures the tradeoff between true and false positives in a classification problem. An AUROC of one denotes a perfect classifier. Brackets show 95 percent confidence intervals. Data start 1973:02, forecasts start 1978:03 and run through 2018:08, excluding observations for which the economy was already in a recession during the previous month. Predictors include the near-term forward spread (NTFS) of Engstrom and Sharpe (2019), excess bond premium (EBP) of Gilchrist and Zakrajsek (2012), 10-year minus 3-month Treasury Spread (TS), and the first three principal components of the Treasury yield curve (Tsy 3PC), as in Johansson and Meldrum (2018).
Conclusion
This note discusses the OOS performance of several probit models used to assess the likelihood that the U.S. economy will be in, or transition into, a recession within the following 12 months. We find that bivariate probit models that use a long- or short-term spread and the EBP perform well OOS, especially when compared with other simple specifications.
References
Ang, Andrew, Monika Piazzesi, and Min Wei (2006). "What Does the Yield Curve Tell Us about GDP Growth?" Journal of Econometrics, vol. 131 (1–2), pp. 359–403, https://EconPapers.repec.org/RePEc:eee:econom:v:131:y:2006:i:1-2:p:359-403.
Berge, Travis J., and Òscar Jordà (2011). "Evaluating the Classification of Economic Activity into Recessions and Expansions," American Economic Journal: Macroeconomics, vol. 3 (2), pp. 246–77.
Christiansen, Charlotte, Jonas Nygaard Eriksen, and Stig Vinther Møller (2014). "Forecasting US Recessions: The Role of Sentiment," Journal of Banking & Finance, vol. 49 (December), pp. 459–68, https://doi.org/10.1016/j.jbankfin.2014.06.017.
Engstrom, Eric C., and Steven A. Sharpe (2019). "The Near-Term Forward Yield Spread as a Leading Indicator: A Less Distorted Mirror," Financial Analysts Journal, https://doi.org/10.1080/0015198X.2019.1625617.
Estrella, Arturo, and Frederic S. Mishkin (1998). "Predicting U.S. Recessions: Financial Variables As Leading Indicators," The Review of Economics and Statistics, MIT Press, vol. 80 (February), pp. 45–61.
Favara, Giovanni, Simon Gilchrist, Kurt F. Lewis, and Egon Zakrajsek (2016). "Recession Risk and the Excess Bond Premium," FEDS Notes (Washington: Board of Governors of the Federal Reserve System, April 8), http://dx.doi.org/10.17016/2380-7172.1739.
Gilchrist, Simon, and Egon Zakrajsek (2012). "Credit Spreads and Business Cycle Fluctuations," American Economic Review, vol. 102 (June), pp. 1692–720.
Johansson, Peter, and Andrew Meldrum (2018). "Predicting Recession Probabilities Using the Slope of the Yield Curve," FEDS Notes (Washington: Board of Governors of the Federal Reserve System, March 1), https://doi.org/10.17016/2380-7172.2146.
Liu, Weiling, and Emanuel Moench (2016). "What Predicts US Recessions?" International Journal of Forecasting, vol. 32 (4), pp. 1138–50, https://doi.org/10.1016/j.ijforecast.2016.02.007.
Miller, David S. (2019). "There Is No Single Best Predictor of Recessions," FEDS Notes (Washington: Board of Governors of the Federal Reserve System, May 21), https://doi.org/10.17016/2380-7172.2367.
Rudebusch, Glenn, and John Williams (2009). "Forecasting Recessions: The Puzzle of the Enduring Power of the Yield Curve," Journal of Business & Economic Statistics, vol. 27 (4), pp. 492–503.
1. At the time of writing, both authors worked at the Federal Reserve Board. We thank Giovanni Favara and Min Wei for comments and suggestions. All errors and omissions are our own responsibility. The views expressed in this note are solely the responsibility of the authors and should not be interpreted as reflecting the views of the Board of Governors of the Federal Reserve System or of anyone else associated with the Federal Reserve System. Return to text
2. The dating of recessions follows the National Bureau of Economic Research (NBER) convention. We use the "NBER based Recession Indicators for the United States from the Peak through the Trough" from FRED (Federal Reserve Economic Data). Return to text
3. The sample used for the first estimation runs from February 1973 to February 1978. Return to text
4. Our analysis uses NBER recession dates from the start of the sample to one year before the beginning of the forecast, assuming revisions are limited to the last 12 months at each point in time. Return to text
5. Other measures of forecasting accuracy, such as the root mean squared error, the mean absolute error, or the log probability score, are available for binary classification. However, these alternative measures depend on a forecast loss function. The main advantage of the ROC curve is that it is a direct plot of the entire space of tradeoffs for a given classification problem, and it is not tied to a specific loss function. Return to text
6. This exclusion is similar to the approach used by Engstrom and Sharpe (2019) to estimate the probability of transitioning into a recession. The difference is that we also include for estimation the period when monetary policy is constrained at the zero lower bound. Excluding this period does not qualitatively change the results. Return to text
Pike, Tyler, and Francisco Vazquez-Grande (2019). "Out-of-Sample Performance of Recession Probability Models," FEDS Notes. Washington: Board of Governors of the Federal Reserve System, December 13, 2019, https://doi.org/10.17016/2380-7172.2454.
Disclaimer: FEDS Notes are articles in which Board staff offer their own views and present analysis on a range of topics in economics and finance. These articles are shorter and less technically oriented than FEDS Working Papers and IFDP papers.