FEDS Notes
February 26, 2020
The Liquidity Coverage Ratio and Corporate Liquidity Management
This note examines the changes in the liquidity management at banks and nonbank financial firms in the United States that occurred following the proposal of the liquidity coverage ratio (LCR) requirement in 2010 and its finalization in 2014. While banks increased their liquid assets to meet the new regulatory liquidity requirements, nonbank financial institutions–such as insurance companies, finance companies, real estate investment trusts, pension funds, asset managers, mutual funds, and others –decreased their liquid assets and increased their reliance on bank credit lines to manage their liquidity risks. This shift in liquidity management at nonbanks presents a puzzle because the post-crisis regulatory framework imposes much higher capital and liquidity requirements on undrawn credit lines to nonbanks. Therefore, all else equal, the supply of credit lines to nonbanks would have been expected to decrease after the introduction of the LCR.
I argue that to understand those trends one needs to take a functional perspective of the financial system.2 What distinguishes banks from nonbank financial institutions is their access to public liquidity backstops such as the discount window with the Federal Reserve and deposit insurance. Those government programs give banks the absolute and comparative advantage over other nonbank financial institutions in the provision of credit lines to the rest of the corporate sector including to other financial corporations.3 Although the LCR required banks to hold a liquid asset buffer against credit lines, it did not alter the comparative advantage of banks as providers of corporate liquidity. Factors related to migration of riskier credit from banks to nonbanks and the increasing opportunity cost of holding liquid assets relative to maintaining bank credit lines are likely explanations for the resulting shifts in liquidity management at nonbank financial institutions and their increasing demand for bank credit lines.
Trends in liquidity management at nonbanks
Banks' credit exposure to nonbank financial firms grew rapidly in the post-crisis period. It doubled since 2013 and exceeded $1.4 trillion as of the first quarter of 2019 with about half of this amount in the form of off-balance sheet undrawn credit lines (Figure 1A).4 In comparison, the cumulative growth in credit lines to nonfinancial firms was about 40 percent over the same period.5 The overall amount of undrawn credit lines to the nonbank financial sector also represents a sizeable exposure when measured as a percent of banks' total assets. Although all bank groups have increased their credit line exposures to nonbanks, the bulk of the undrawn credit lines is concentrated at the largest banks subject to the standard LCR (Figure 1B).
Figure 1A: Cumulative growth in credit lines to the corporate sector Figure 1B: Unused credit commitments to nonbank financial institutions as percent of total assets
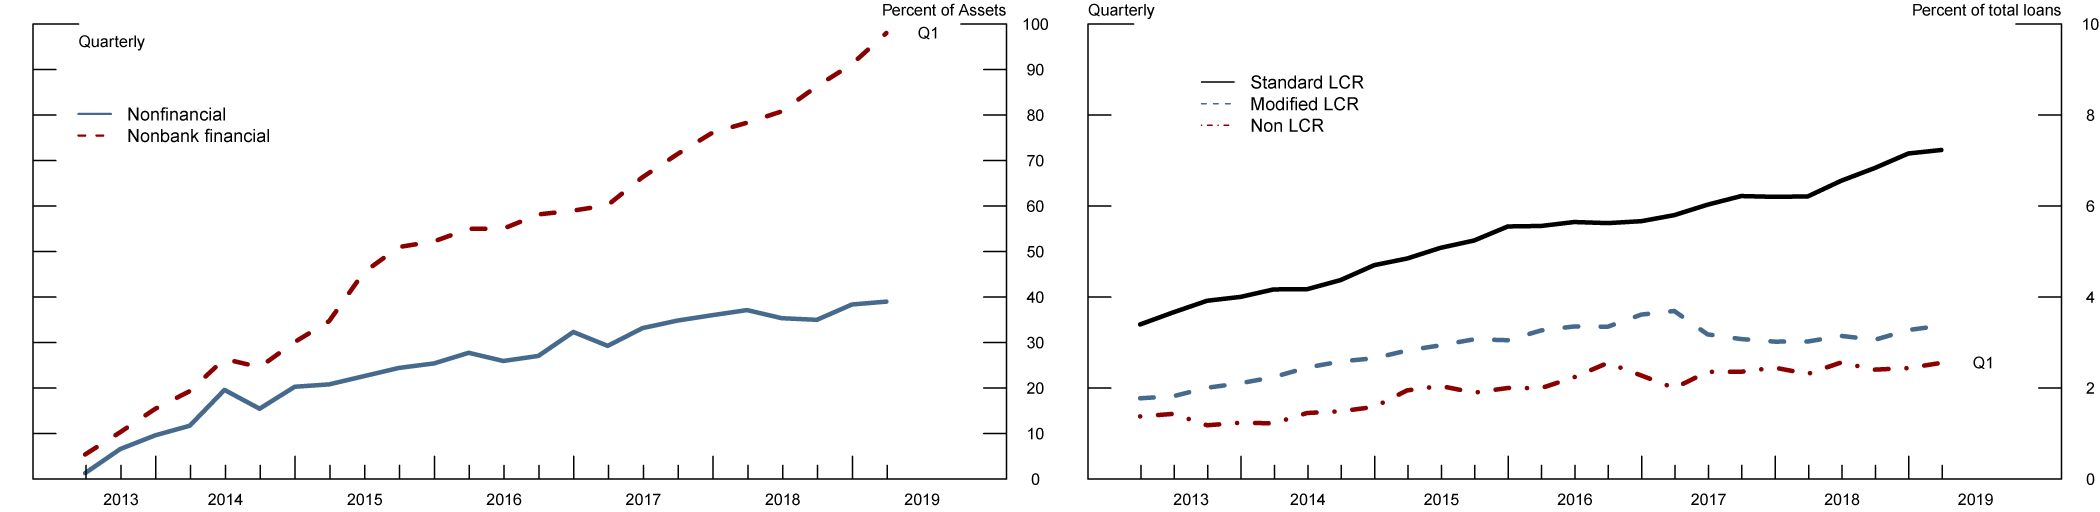
Note: Panel A includes bank holding companies with total consolidated assets exceeding $50 billion subject to the standard or modified LCR. Panel B includes all bank holding companies that file consolidated FR Y-9C reports. Standard LCR banks are those with total assets exceeding $250 billion and modified LCR are banks with total assets between $50 and $250 billion. Source: FR Y-14 and FR Y-9C.
There are at least two potential factors behind the increasing reliance on credit lines by nonbanks. The first factor has to do with the migration of credit from banks to nonbank financial firms in the post-crisis period. In part, such migration is driven by financial innovation and sweeping changes in financial regulation to address vulnerabilities that contributed to the financial crisis. Nonbanks filled in for banks but in turn obtained bank credit lines to partly finance this credit provision.6 The second factor is related to the increasing use of credit lines as a liquidity management tool by nonbanks which coincides with an overall shift of liquidity in these two sectors. Figure (2A) shows the divergent trends in the liquidity positions of publicly traded banks and nonbank financial institutions over the post-crisis period. Banks doubled their holdings of liquid assets from around 8 percent to more than 16 percent of total assets over this period. In contrast, holdings of cash and cash equivalents by public nonbank financial firms declined from around 12 percent of total assets to less than 8 percent by the end of 2018. The reductions in the share of liquid assets at nonbank financials were offset by increases in the reliance of those firms on bank credit lines. As shown in Figure (2B), the share of total committed amounts of credit lines to the sum of committed credit lines and liquid assets at nonbank financial firms increased from around 27 percent in 2009 to more than 55 percent in 2018.
Figure 2A: The ratio of liquid assets to total assets Figure 2B: Total credit lines as a percent of liquid assets and credit lines
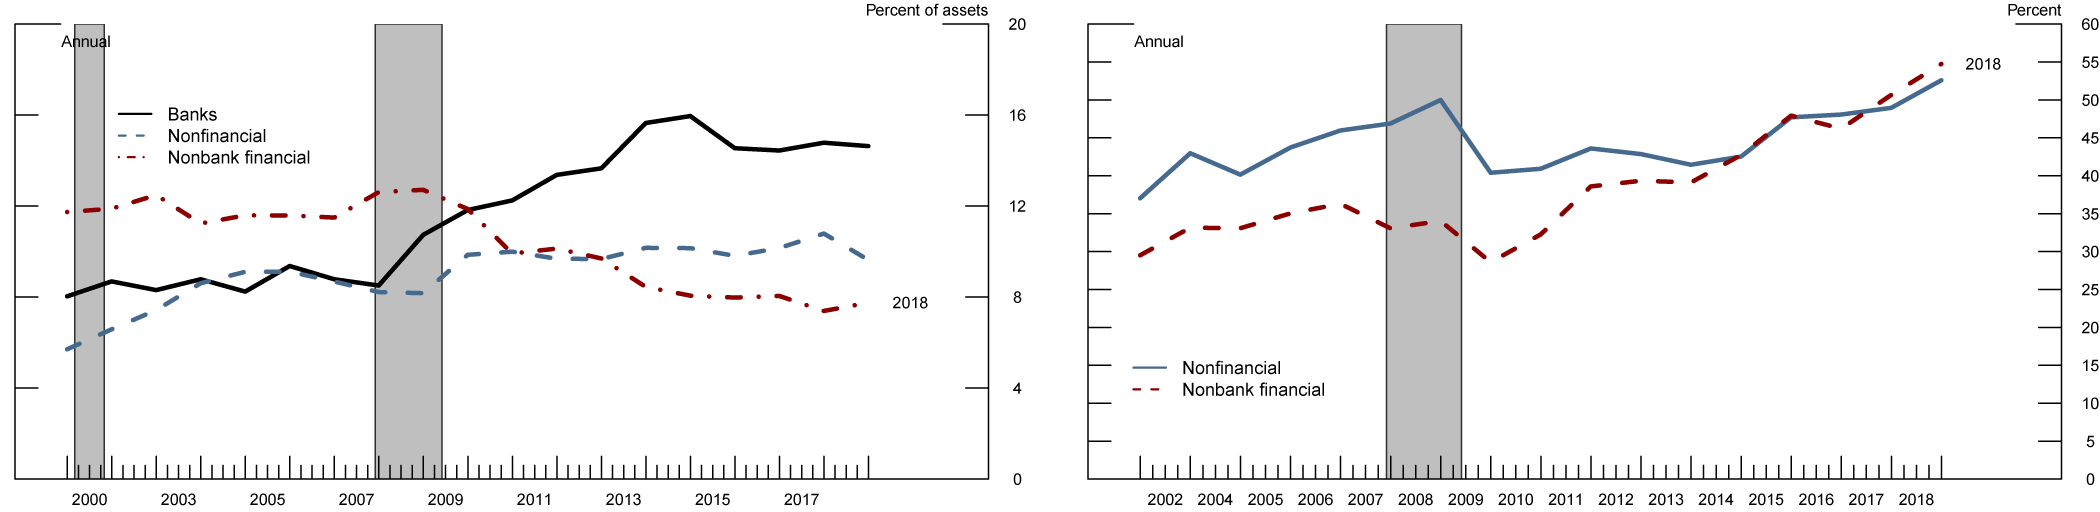
Note: Liquid assets are defined as cash and cash equivalents. Includes all U.S. domiciled publicly traded companies. Banks and nonbank financial institutions are identified using industry classifications based on NAICs codes. Source: S&P Global, Compustat; S&P Global, CapitalIQ. The shaded bars indicate periods of business recession as defined by the National Bureau of Economic Research: March 2001–November 2001, and December 2007–June 2009.
This shift in liquidity risk management is consequential for financial stability. Any corporate firm is exposed to the potential problems of securing financing when spot debt and equity markets are in turmoil. When a firm is unable to roll over its debt, it may need to seek more expensive sources of financing, postpone investments, or even liquidate its assets at firesale prices that could lead to significant losses or insolvency. Those problems are exacerbated at financial firms whose business models often rely on the use of short-term debt to finance long-term and illiquid assets. For instance, disruptions in the functioning of the financial system during the 2007-2009 financial crisis prompted the establishment of government-backed liquidity facilities to support nonbank financial firms such as the AMLF program that stabilized the asset-backed commercial paper (ABCP) market and stopped the outflow of funds from money market funds.7
The higher reliance on credit lines and reduced liquidity positions implies that nonbanks would be more likely to draw on their credit lines in a market turmoil. I next examine how the LCR treats corporate credit lines and how much liquidity there is on banks' balance sheets to meet such drawdowns.
The LCR treatment of corporate credit lines
Prior to the 2007-2008 financial crisis, bank regulation did not have explicit quantitative liquidity requirements on banks.8 In December 2010, Basel III introduced such a requirement in the form of the LCR, and U.S. regulators proposed a U.S. version of the LCR in 2013 that was finalized in 2014. 9 The LCR imposes a minimum requirement on the amount of unencumbered high-quality liquid assets (HQLA) that would allow banks to survive a supervisory 30-day liquidity stress scenario.10 The LCR requires that the amount of unencumbered HQLA be at least as large as the net outflow of funds under the 30-day stress scenario
$$$$ \text{LCR} = \frac{\text{HQLA}}{\text{Net outflow}} \ge 1.$$$$
Off-balance sheet positions such as undrawn committed credit lines enter the net outflow in the denominator of the ratio as an outflow rate times the undrawn amount on the credit lines. The outflow rates on credit lines to nonfinancial and nonbank financial firms are shown in Table (1).
Table 1: LCR outflow rates on undrawn credit and liquidity facilities to the corporate sector
| Nonfinancial firms | Nonbank financial firms | |
|---|---|---|
| Credit facilities | 10% | 40% |
| Liquidity facilities | 30% | 100% |
Calibrated to historical outflow experience under stress, the LCR assumes higher outflow rates for the undrawn credit lines to nonbank financial firms than to nonfinancial firms. Furthermore, the LCR distinguishes between two types of credit lines—credit facilities and liquidity facilities. Credit facilities are used for general corporate purposes such as funding working capital or investment expenditures. The LCR requires that every dollar of unused credit facility be backed with 10 cents of HQLA for nonfinancial firms and 40 cents for nonbank financial firms. Liquidity facilities are contractually designed to serve primarily as a liquidity management tool, such as to back-up issuances of commercial paper or other market debt. The LCR imposes a 100 percent outflow assumption on such liquidity facilities to nonbank financials, whereas liquidity facilities to nonfinancial firms require only 30 cents of HQLA for every dollar of undrawn credit line.
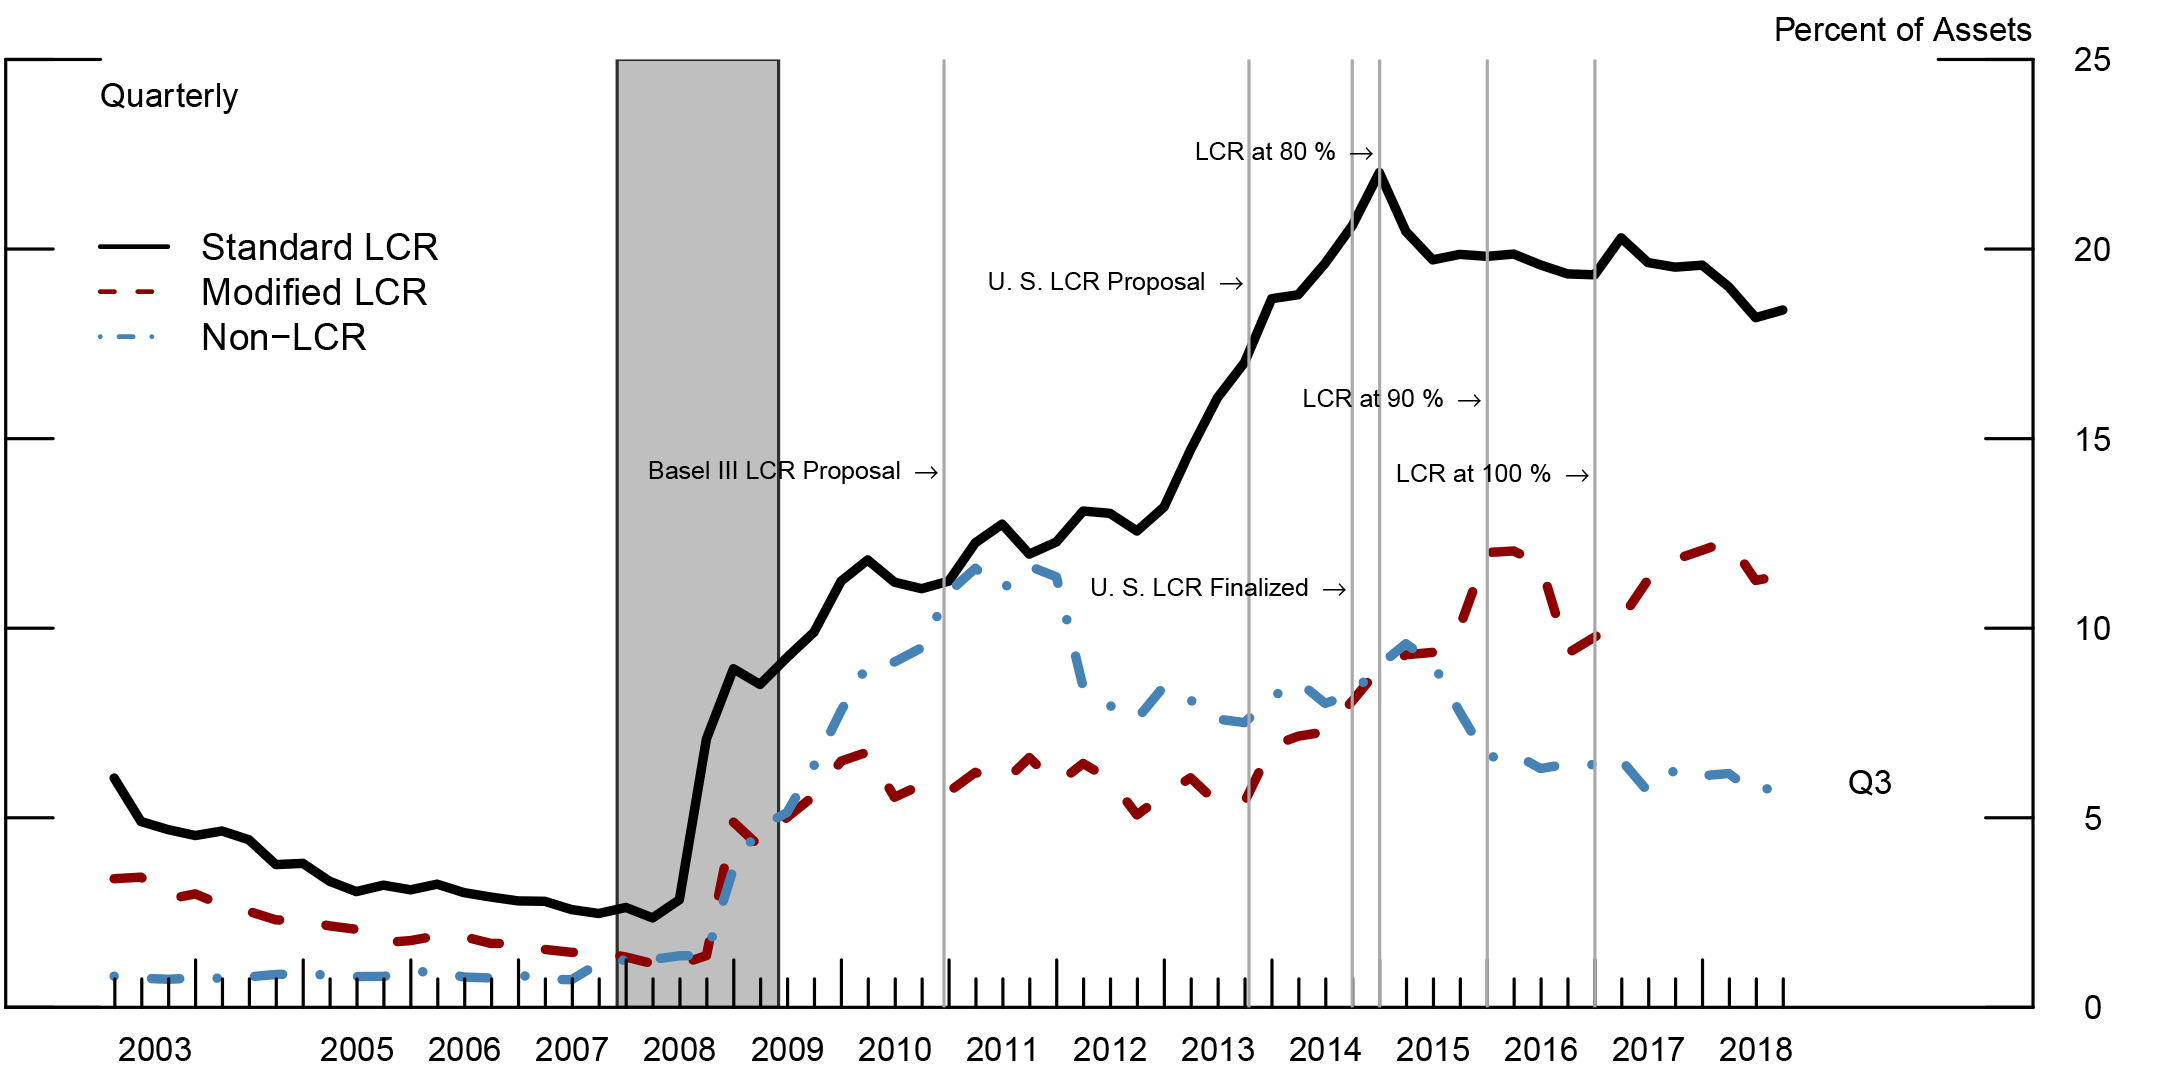
Note: An estimate of the regulatory high quality liquid assets (HQLA) is constructed as reserves plus estimates of securities that qualify as high-quality liquid assets as defined by the LCR. Level 1 assets, and haircuts and restrictions on Level 2 assets, are incorporated into the estimate. Vertical lines indicate different stages of the LCR implementation. Standard LCR banks are those with total consolidated assets above $250 billion. Modified LCR banks are all bank holding companies with assets between $50 and $250 billion. Non-LCR banks are banks with total assets below $50 billion. The shaded area spans the 2008-2009 recession based on NBER dates. Source: FR Y-9C
During the crisis period of 2007-2009 and immediately after, banks began to accumulate liquid assets (Figure (3)). The initial accumulation is certainly not explained primarily by the pending liquidity regulation, as a number of other factors were also at play. For example, banks reported tightening lending standards on most loan categories as well as subdued loan demand.11 In addition, there were significant inflows of deposits, including nonoperational corporate deposits, most of which were invested as excess reserves with the Federal Reserve.12 Prior to the crisis, in 2006, the largest banks that would become subject to the standard LCR held less than 4 percent of their total assets in liquid assets that could have qualified for HQLA under LCR.13 By 2010, HQLA represented more than 10 percent of total assets at those banks. Meanwhile, at the medium-sized banks with assets between $50 and $250 billion, which would become subject to the less stringent modified LCR, HQLA increased after 2006 as well but at a much slower pace, and those banks held only about 5 percent of total assets by 2010. With the Basel III LCR proposal in December 2010 and the U.S. LCR proposal in October 2013, banks subject to the LCR began to transition to full compliance with the new regulation. The standard LCR banks nearly doubled their liquid assets between January 2010 and January 2015 to 20 percent, which is more than 5 times the corresponding ratio in 2006. Modified LCR banks stepped up their accumulation of liquid assets as well, and achieved 12 percent HQLA-to-asset ratio by 2016. In contrast, banks that are not subject to the LCR have been running down their liquid assets through most of the post-crisis period.
In the cross-section, the HQLA holdings of banks subject to the LCR became much more aligned with the magnitudes of their undrawn credit lines than they had been previously. Figure (4) shows the relationship between the HQLA-to-assets positions at the largest banks subject to the LCR and their undrawn amounts on credit lines to nonbank financial firms scaled by assets for two dates—September 2013 in panel A, and December 2017 in panel B. The relationship between banks' liquidity and undrawn credit lines to nonbank financials changes dramatically from being slightly negative just prior to the release of the U.S. LCR proposal to becoming positive in the post-LCR period.
Figure 4: Relationship between HQLA-to-assets ratio and undrawn credit lines to nonbank financials.
Panel A: September 31, 2013Panel B: December 31, 2017
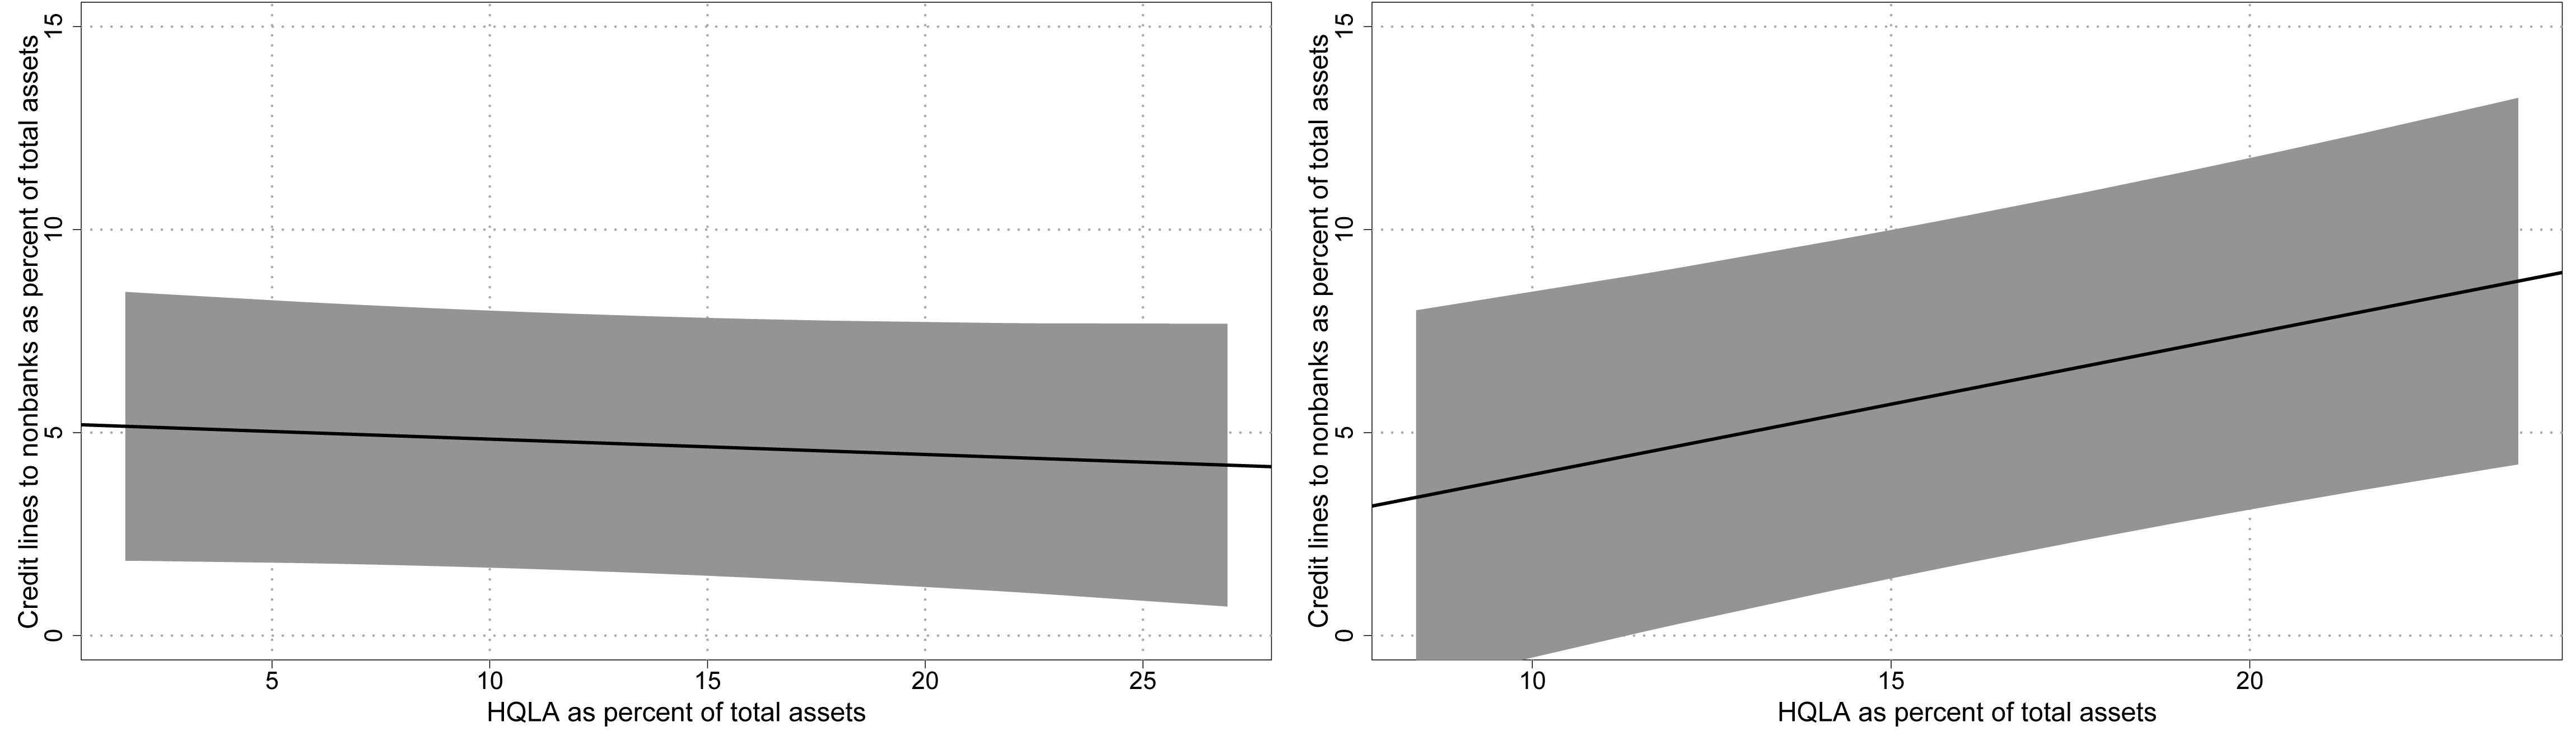
Note: Includes bank holding companies with total consolidated assets exceeding $50 billion. The figure shows the predicted value of a linear univariate regression of HQLA-to-assets ratio and the ratio of total credit lines to nonbank financials as percent of total assets. In panel A, the coefficient estimate is statistically insignificant at -0.03 and the R-squared is virtually zero. In panel B, the coefficient estimate is statistically significant at 0.34 and the R-squared is 15 percent. The shaded areas show the interquartile standard error bands. Source: FR Y-14 and FR Y9C
The maintenance of large amounts of HQLA incurs an opportunity cost in the form of forgone income from higher yielding and riskier investments such as term loans or non-HQLA securities. The effect of the opportunity cost of holding liquid assets can be inferred from the behavior of non-LCR banks, which have reduced their liquidity ratios since 2012. Further evidence for the effect of the opportunity cost of holding liquid assets is in Figure (5). Banks responded to the 100 percent outflow assumption on liquidity facilities to nonbank financial firms by reducing the supply of such facilities or by converting those facilities to credit facilities, which receive the lower outflow rate. In contrast, liquidity facilities to nonfinancial firms remained largely unchanged.14
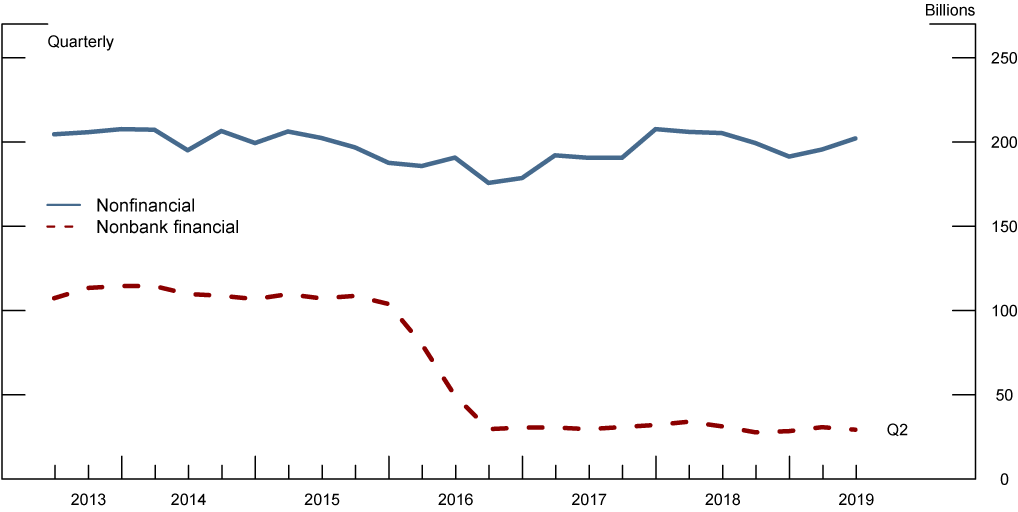
Note: Total committed amounts of liquidity facilities to back-up commercial paper and corporate bond issuance by sector in billions of dollars. Source: FR Y-14
All in all, the evidence in figures 3, 4, and 5 supports the conclusion that the LCR was a binding constraint for banks. It forced LCR banks to increase dramatically their liquidity positions and align their liquidity to their off-balance sheet exposures to the corporate sector and, in particular, to the nonbank financial sector whose demand for credit lines has increased in the post-crisis period.
Conclusion
The introduction of the LCR liquidity requirement has had a profound effect on banks' liquidity positions. Large banks subject to the LCR increased dramatically their holdings of high-quality liquid assets to match their liquidity risks including those that stem from providing credit lines to the business sector. In contrast, smaller banks not subject to the LCR have decreased liquid asset holdings in the post-crisis period even though they also have been increasing their exposure to nonbank financial firms. This note has documented that in parallel with these shifts in liquidity positions of banks, publicly traded nonbank financial firms decreased their liquid asset holdings and increased their reliance on bank credit lines. One potential explanation is the increasing opportunitiy cost of holding liquid assets in the post-crisis period. If the relative cost of holding liquid assets exceeded the cost of obtaining and maintaining credit lines with banks, then nonbank financials would reduce their own liquidity and increase their reliance on bank credit lines. I have provided indirect evidence consistent with this mechnism. It is interesting to note that a similar substitution did not occur for the nonfinancial sector implying that nonfinancial firms faced different trade-offs when managing their liquidity risks.
The role of the banking system as a provider of corporate liquidity through credit lines has increased after the introduction of the LCR requirement and other post-crisis regulations. From a financial stability perspective, those post-crisis regulations have increased resilience. Banks' historically large liquidity positions ensure that drawdowns on the credit lines would be supported by higher levels of liquidity in the next debt market collapse. Furthermore, the Federal Reserve's stress testing regime and the U.S. implementation of the Basel III standardized approach require banks to account for undrawn credit lines in their capital planning in ways that did not exist before the crisis. Finally, to the extent that there are economies of scale of concentrating liquid assets at large banks and pooling liquidity risks of the corporate sector, the provision of liquidity insurance through credit lines to the rest of the corporate sector would be more efficient than in the pre-crisis period. That said, significant financial stability risks remain. The unused committed credit lines to the corporate sector will likely be drawn in a highly correlated manner during a period of debt market distress materializing as on-balance sheet bank loans, and they will absorb a significant part of banks' liquidity and capital buffers. Moreover, to the extent that nonbanks financials lend to riskier borrowers that are more likely to default in a downturn, the higher credit risk of nonbanks' loan portfolios would be transferred to banks when those nonbanks draw their credit lines.15
References
Acharya, Viral V., Philipp Schnabl, and Gustavo Suarez. 2013. "Securitization without Risk Transfer." Journal of Financial Economics 107, no. 3: 515–36.
Carlson, M., Duygan-Bump, B., & Nelson, W. (2015). Why Do We Need Both Liquidity Regulations and a Lender of Last Resort? A Perspective from Federal Reserve Lending During the 2007-09 U.S. Financial Crisis. Social Science Research Network, 2015(11), 1-37.
Chernenko, S., Erel, I., & Prilmeier, R. (2019). Nonbank Lending. National Bureau of Economic Research.
Cornett, M., McNutt, J., Strahan, P., & Tehranian, H. (2011). Liquidity Risk Management and Credit Supply in the Financial Crisis. Journal of Financial Economics, 101(2), 297-312.
Covitz, D., Liang, N., & Suarez, G. (2012). The Evolution of a Financial Crisis: Collapse of the Asset-Backed Commercial Paper Market. Journal of Finance, 68(3), 815-848.
Duygan‐Bump, B., Parkinson, P., Rosengren, E., Suarez, G. A., & Willen, P. (2013). How effective were the Federal Reserve emergency liquidity facilities? Evidence from the asset‐backed commercial paper money market mutual fund liquidity facility. The Journal of Finance, 68(2), 715-737.
Gatev, E., & Strahan, P. (2003). Banks' Advantage in Hedging Liquidity Risk: Theory and Evidence from the Commercial Paper Market. Journal of Finance, 61(2), 867-892.
Holmström, B., & Tirole, J. (1998). Private and public supply of liquidity. Journal of Political Economy, 106(1), 1-40.
Ihrig, J., Kim, E., Kumbhat, A., Vojtech, C., & Weinbach, G. (2017). How Have Banks Been Managing the Composition of High-Quality Liquid Assets? Social Science Research Network, 2017(92), 1-27.
Ivashina, V., & Scharfstein, D. (2010). Bank Lending During the Financial Crisis of 2008. Journal of Financial Economics, 97(3), 319-338.
Kashyap, A., Rajan, R., & Stein, J. (1999). Banks as Liquidity Providers: An Explanation for the Coexistence of Lending and Deposit-Taking. Journal of Finance, 57(1), 33-73.
Kim, You Suk, Laufer, Steven, Pence, Karen, Stanton, Richard, & Wallace, Nancy "Liquidity Crises in the Mortgage Market." Social Science Research Network, vol. 2018, no. 16, 2018.
Merton, Robert C. "A Functional Perspective of Financial Intermediation." Financial Management, vol. 24, no. 2, 1995, p. 23.
Pennacchi, G. (2006). Deposit insurance, bank regulation, and financial system risks. Journal of Monetary Economics, 53(1), 1-30.
1. Acknowledgements: I am grateful to Kevin Kiernan and Noah Leatham for excellent research assistance. I am thankful to Bill Bassett, Jose Berrospide, Andrew Cohen, Galina Hale, Skander Van den Heuvel, Beth Klee, Mike Kiley, Cindy Vojtech, Teng Wang, and Filip Zikes for helpful discussions. All remaining errors and omissions are the author's. This work does not reflect the official position of the Federal Reserve Board of Governors or the Federal Reserve System. Return to text
2. The financial system performs a set of stable functions such as intermediation of funds from savers to borrowers, pooling and diversification of risks, and liquidity and maturity transformation that supports provision of liquidity to households and businesses. Although the functions of the financial system remain stable over time, financial innovation and new regulation change the set of financial institutions and markets that can perform those functions at the lowest cost. Return to text
3. This comparative advantage of banks in the provision of corporate liquidity is a subject of a number of studies. Kashyap, Rajan, and Stein (1999) show theoretically and empirically that demandable bank deposits and credit line provision to firms are synergetic bank activities that exploit the economies of scale of the use of bank liquid assets. Gatev and Strahan (2003) document that the flight-to-safety inflows of deposits during periods of market turmoil allow banks to offer a liquidity hedge against disruptions in credit markets. Pennacchi (2006) provides evidence that such synergies and the ability of banks to hedge aggregate liquidity risks are the result of the introduction of deposit insurance in 1934. Return to text
4. See the November 2019, Financial Stability Report (PDF) Return to text
5. At $4 trillion in committed amounts of which over $2 trillion in the form of undrawn credit lines, lending to the nonfinancial corporate sector still forms the bulk of bank corporate lending. Return to text
6. For example, Kim, Laufer, Pence, Stanton, Wallace (2018) document that more than half of all mortgage originations in 2016 were made by nonbank financial firms. The authors attribute the increasing share of nonbanks to several factors among which are higher regulatory capital requirements on banks and financial innovations by FinTech firms, such as Quicken loans, that introduced algorithmic underwriting with significant cost reductions in mortgage underwriting. However, as the authors document, those nonbanks do not have the stable sources of funding of banks and, as a result, those nonbanks rely extensively on credit lines to manage the liquidity risks of their inventory of mortgage originations before they get sold to the GSEs. Return to text
7. Covitz, Liang, and Suarez (2012) document runs on the asset-backed commercial paper (ABCP) vehicles in 2007. Carlson, Duygan-Bump, and Nelson, (2015) for an overview of the liquidity support the government provided to banks and nonbank financial institutions during the 2007-09 financial crisis. Dyugan-Bump, Parkinson, Rosengren, Suarez, and Willen (2013) evaluate the effectiveness of the AMLF program. Return to text
8. The only liquidity requirement during this period was required reserves on certain deposits and supervisory expectations around internal liquidity risk management. Return to text
9. In addition, to the LCR requirement, Basel III introduced a second liquidity requirement. The Net Stable Funding Ration (NSFR) requirement compares the available stable funding to the required stable funding for a bank to withstand liquidity outflows over a one-year horizon. The NSFR aims to create incentives for banks to use more stable funding such as insured retail deposits and equity, and to reduce reliance on runnable short-term wholesale funding. The U.S. NSFR was proposed on June 1, 2016 and, as of the publication date, the rule has not been finalized or implemented. Return to text
10. The LCR rule defines three categories of liquid assets that are eligible as HQLA. Level 1 assets includes excess reserves with the Federal Reserve, Treasury bonds, government agency debt and MBS, and sovereign debt that carries zero risk-weights in the calculation risk-based capital. The amount of level 1 assets needs to be at least 60 percent of the HQLA asset composition. Level 2A assets receive a 15 percent haircut and includes GSE debt, GSE MBS and sovereign debt with risk weights between zero and 20 percent. Level 2B assets receive a 50 percent haircut and are capped at 15 percent of the overall HQLA composition. Level 2B assets include investment grade nonfinancial corporate debt, equities, and investment grade municipal bonds. See Ihrig, Kim, Kumbhat, Vojtech, & Weinbach, 2017 for more details on the changing composition of HQLA since the beginning of the LCR implementation Return to text
11. See for example the November 2009 Senior Loan Office Opinion Survey Return to text
12. The LCR and assigns a higher outflow assumption to nonoperational corporate deposits as such funding is considered less stable than for example insured retail deposits. Return to text
13. The LCR defined two liquidity standards. The standard LCR requirement was applied to the largest bank holding companies with total consolidated assets exceeding $250 billion whereas a less stringent modified LCR requirement was applied to bank holding companies with total consolidated assets between $50 billion and $250 billion in consolidated assets. Smaller banking organizations with assets below $50 billion were exempt from liquidity regulation. The U.S. version of the LCR was proposed in October 2013 and was finalized in September 2014. On January 1, 2015, standard LCR banks were required to meet the standard at 80 percent, then, on January 1, 2016, all LCR banks had to meet the requirement at 90 percent. Finally, on January 1, 2017, the LCR requirement was fully phased in. The largest globally systemically important banks (G-SIBs) began public disclosure of their LCR ratios in April 2017. Return to text
14. The reductions in liquidity facilities coincides with the implementation of the MMMF reform which resulted in prime money market funds converting to government funds. As a result of the conversion, more than $1 trillion in assets under management in prime funds that could hold financial commercial paper were transferred to government funds that only invest in treasuries and agency debt. As a result, the decline in liquidity facilities could also be driven by demand factors related to changes in the commercial paper issuance at nonbank financials. However, the MMMF reform may not be the full story as it would have equally impacted nonfinancial firm commercial paper and the liquidity facilities to nonfinancial firms remained largely unchanged. Return to text
15. For example, Chernenko, Erel, & Prilmeier (2019) document that nonbank corporate lenders originate loans to riskier corporate borrowers. This is consistent with evidence provided by Kim, Plosser, & Santos (2018) who show that the supervisory leveraged guidance on banks reduced bank lending to leveraged corporate borrowers. These highly leveraged and risky borrowers obtained credit from nonbanks who in turn funded their operations through bank loans. Such risk transfer from nonbanks to banks occurred in 2007 with the collapse of ABCP vehicles as shown by Acharya, Schnabl, and Suarez (2013). Return to text
Yankov, Vladimir (2020). "The Liquidity Coverage Ratio and Coporate Liquidity Management," FEDS Notes. Washington: Board of Governors of the Federal Reserve System, February 26, 2020, https://doi.org/10.17016/2380-7172.2509.
Disclaimer: FEDS Notes are articles in which Board staff offer their own views and present analysis on a range of topics in economics and finance. These articles are shorter and less technically oriented than FEDS Working Papers and IFDP papers.