FEDS Notes
June 17, 2022
The post-COVID stock listing boom
Christine Dobridge, Rebecca John, Berardino Palazzo
Introduction
In the aftermath of the Covid-19 pandemic, the U.S. equity markets have witnessed a surge in the number of publicly listed companies. Using data for the three major U.S. stock exchanges (AMEX, NYSE, and NASDAQ), we find that the number of publicly traded companies went from 4,144 at the end of August 2020 to 5,301 at the end of December 2021, a staggering increase of about 28 percent.1
Figure 1 reports the trend in the number of public companies since 1973, two years after the NASDAQ started its operations. The number of publicly traded firms peaked in 1997, reaching 7,842 at the end of November, and has since steadily declined through 2012, after which it remained nearly flat until about the first half of 2020.2
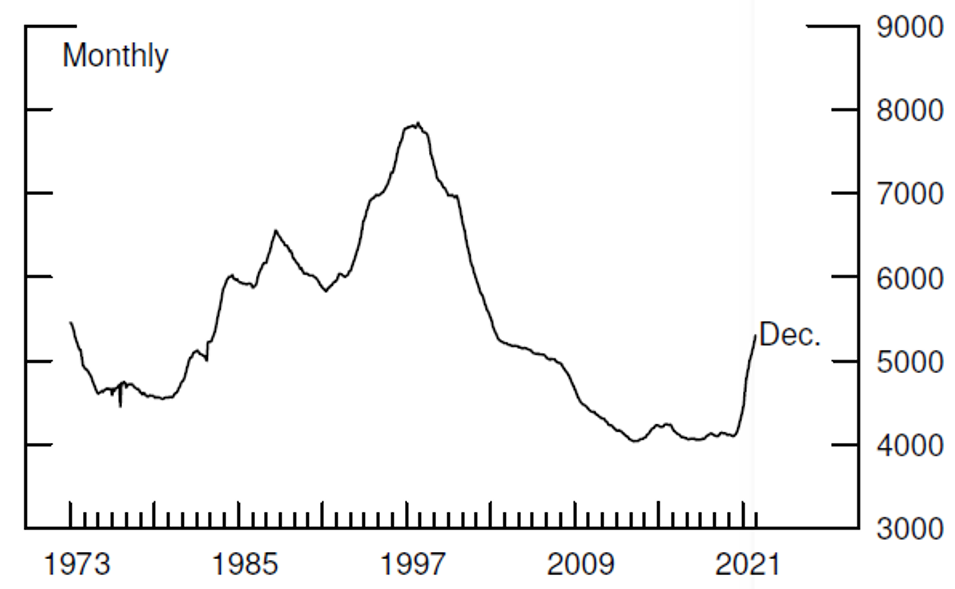
Note: Data represent all companies in NASDAQ, NYSE and AMEX exchanges.
Source: Center for Research In Security Prices, CRSP 1925 US Stock Database, Wharton Research Data Services. http://www.whartonwrds.com/datasets/crsp/.
The small net change in the number of publicly listed companies in the last 50 years is the by-product of (1) an early period during which the number of publicly traded firms steadily increased at an average annualized monthly rate of about 1.5% (January 1973 to November 1997), (2) a subsequent period during which the number of publicly traded firms steadily decreased at an average annualized monthly rate of about -2.8% (from November 1997 to August 2020), and (3) a recent period that has witnessed a sharp increase in the number of listed firms (from August 2020 to December 2021). During this latter period, the average annualized growth rate has been an astonishing 20%.
Figure 2 reports the 12-month moving average of the monthly growth rate for the NASDAQ and NYSE+AMEX, respectively. As the figure shows, the recent increase in the number of companies is a phenomenon that is equally important for firms traded in the NASDAQ and firms traded in the NYSE and AMEX platforms.
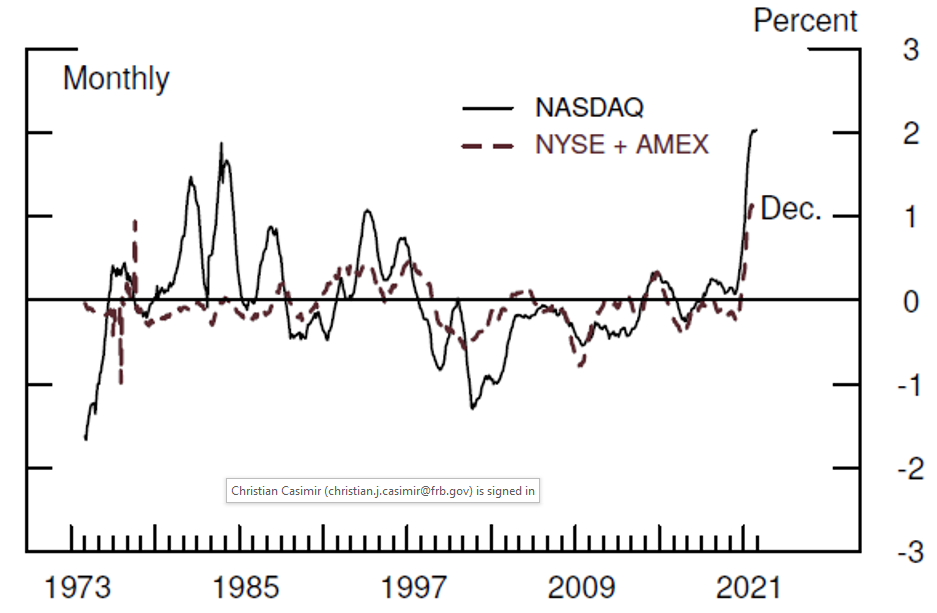
Note: Monthly percent change represents the 12-month moving average of the monthly percent change in number of traded companies in the stated exchange.
Source: Center for Research in Security Prices, CRSP 1925 US Stock Database, Wharton Research Data Services. http://www.whartonwrds.com/datasets/crsp/.
In the section that follows, we provide a description of the newly listed stocks that have entered during the post-COVID-19 listing boom and analyze their effect on the composition of U.S. equity markets.
What is responsible for the recent listing boom?
The obvious answer to the above question is the huge popularity of investing in Special Purpose Acquisition Companies (SPACs). Starting in the second half of 2020, U.S. equity markets have witnessed an explosion in the number of so-called blank check companies' (or SPACs') stocks. These companies are effectively holding cash to acquire private companies and take them public, bypassing the traditional IPO process.3
Given the importance of the SPAC phenomenon, we manually classify the newly listed companies into SPACs and non-SPACs, that is, companies that go public with a traditional IPO process, and report in Figure 3 the number of newly listed firms in each category.4 During the period from the end of August 2020 to December 2021, there were 736 newly listed firms classified as SPACs and 646 newly listed non-SPAC firms; that is, SPACs accounted for about 53% of total newly listed firms. The number of newly listed SPACs took off in the second half of 2020 and peaked in the months of March and April 2021.5
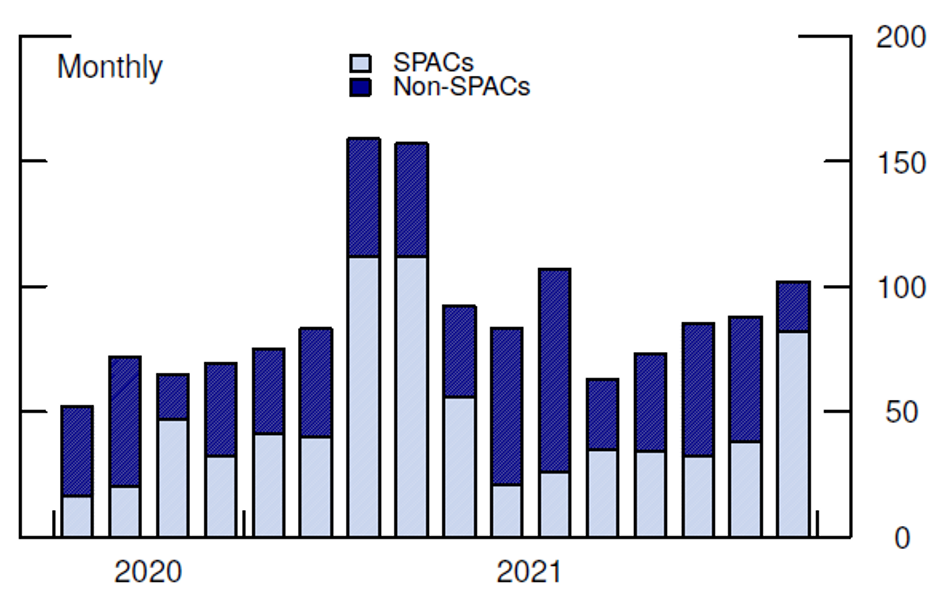
Note: We used the NASDAQ IPO Calendar and spacresearch.com to manually classify newly listed firms into SPACs and non-SPACs.
Source: Center for Research in Security Prices, CRSP 1925 US Stock Database, Wharton Research Data Services. http://www.whartonwrds.com/datasets/crsp/; NASDAQ IPO Calendar, spacresearch.com.
In addition to highlighting the prominence of SPACs in driving newly listed firms, Figure 3 also makes clear that even without the surge in SPACs, we would have seen a historically large increase in the number of publicly traded companies. If we exclude all SPACs from the sample and calculate the counterfactual growth rate generated by the entry of non-SPAC companies, the number of publicly traded companies would have grown at an annualized average growth rate of about 7.5% over the period August 2020 to December 2021, a substantially larger growth rate than the one recorded over the period November 1997-August 2020 (-2.8% at an annual rate). In short, the U.S. economy would have witnessed a post-COVID-19 listing boom even without the SPAC frenzy.6
Newly listed firms during the post-Covid listing boom: Some stylized facts
In what follows, we compare the characteristics of the about 1,400 newly publicly listed companies that entered the U.S. equity markets during the SPAC listing boom, between the end of August 2020 and December 2021, with the approximately same number of newly publicly listed companies that entered over the period December 2014 to August 2020.
Table 1 shows that companies that entered during the SPAC listing boom tended to have the same size distribution of the companies that had entered since the end of 2014; that is, about 30% of newly listed firms are small in terms of their market capitalization.7 However, Table 1 highlights that there is a significant difference in the size distribution of SPACs versus non-SPACs, with the former tending to be significantly smaller: out of 10 newly listed SPACs, 9 belong to the small size category.
Table 1. Entrants’ size distribution
| Aug 2020 - Dec 2021 | Dec 2014 - Aug 2020 | ||||||
|---|---|---|---|---|---|---|---|
| All entrants | Non-SPAC entrants | SPAC entrants | All entrants | ||||
| Small | Non-small | Small | Non-small | Small | Non-small | Small | Non-small |
| 72% | 28% | 49% | 51% | 91% | 9% | 68% | 32% |
Note: Small firms belong to the bottom quintile of the market capitalization distribution. Market capitalization quintiles are calculated each month using only companies traded on the New York Stock Exchange. We used the NASDAQ IPO Calendar and spacresearch.com to manually classify newly listed firms into SPACs and non-SPACs. All calculations are done with respect to the end of the months indicated. Source: Center for Research in Security Prices, CRSP 1925 US Stock Database, Wharton Research Data Services, http://www.whartonwrds.com/datasets/crsp; NASDAQ IPO Calendar; spacresearch.com.
In this note, we consider ordinary common shares of both domestically and foreign incorporated companies. Table 2 shows that the more recent wave of entrants is more likely to be incorporated abroad (34%) than newly listed companies in the period December 2014 to August 2020 (about 21%). The difference is entirely due to newly listed SPACs, which are much more likely to be incorporated abroad (about 44%) than non-SPAC firms (about 24%).8
Table 2. Entrants’ incorporation location distribution
| Aug 2020 - Dec 2021 | Dec 2014 - Aug 2020 | ||||||
|---|---|---|---|---|---|---|---|
| All entrants | Non-SPAC entrants | SPAC entrants | All entrants | ||||
| Domestic | Foreign | Domestic | Foreign | Domestic | Foreign | Domestic | Foreign |
| 67% | 33% | 77% | 23% | 58% | 42% | 80% | 20% |
Note: Foreign firms are defined by a CRSP share code of 12. We used the NASDAQ IPO Calendar and spacresearch.com to manually classify newly listed firms into SPACs and non-SPACs. All calculations are done with respect to the end of the months indicated. Source: CRSP; NASDAQ IPO Calendar; spacresearch.com.
We also use NAICS codes at the 4-digit level (i.e., NAICS industries) to examine the industry distribution of newly listed firms during the SPAC boom. Table 3 shows that the industry distribution of non-SPAC firms is broadly similar to the industry distribution in the preceding period. For example, in both periods, the fraction of newly listed firms belonging to the Pharmaceutical and Medicine Manufacturing sector and to the Scientific Research and Development Services industry is very similar. Not surprisingly, the industry composition of newly entered SPACs is heavily tilted toward the financial services industry, with about 84% of SPACs belonging to the Other Financial Investment Activities industry.
Table 3. Entrants’ industry distribution
| Non-SPAC entrants | SPAC entrants | ||||
|---|---|---|---|---|---|
| Aug 2020-Dec 2021 | Dec 2014-Aug 2020 | Aug 2020 - Dec 2021 | |||
| Industry | % | Industry | % | Industry | % |
| Pharmaceutical and Medicine Manufacturing | 12.3 | Pharmaceutical and Medicine Manufacturing | 13.06 | Other Financial Investment Activities | 84.26 |
| Scientific Research and Development Services | 7.9 | Scientific Research and Development Services | 9 | Business Support Services | 13.09 |
| Business Support Services | 7.1 | Depository Credit Intermediation | 5.82 | Other | 2.65 |
| Medical Equipment and Supplies Manufacturing | 4.2 | Other Financial Investment Activities | 4.94 | n.a. | |
| Support Activities for Mining | 3.4 | Computer Systems Design and Related Services | 3.07 | n.a. | |
| Management of Companies and Enterprises | 3.1 | Business Support Services | 2.74 | n.a. | |
| Other Financial Investment Activities | 2.8 | Drugs and Druggists' Sundries Merchant Wholesalers | 2.41 | n.a. | |
| Depository Credit Intermediation | 1.9 | Medical Equipment and Supplies Manufacturing | 2.2 | n.a. | |
| Advertising, Public Relations, and Related Services | 1.6 | Support Activities for Mining | 2.09 | n.a. | |
| Other | 55.6 | Other Investment Pools and Funds | 0.33 | n.a. | |
| n.a. | Other | 54.34 | n.a. | ||
Note: We used the NASDAQ IPO Calendar and spacresearch.com to manually classify newly listed rms into SPACs and non-SPACs. All calculations are done with respect to the end of the months indicated. Source: Center for Research in Security Prices, CRSP 1925 US Stock Database, Wharton Research Data Services, http://www.whartonwrds.com/datasets/crsp; NASDAQ IPO Calendar; spacresearch.com.
We conclude this note by highlighting an important difference in equity price dynamics between newly listed SPACS and more traditional newly listed companies. SPACs enter capital markets before performing a merger or an acquisition, hence we can identify three distinct stages in a SPAC lifecycle: the period from entering capital markets to the first day a deal announcement is made, the subsequent period from the deal announcement day to the day the SPAC becomes a regular operating company (an event known as De-SPAC), and the final period that follows the De-SPAC.
Table 4 reports daily equity returns statistics for all the companies that entered U.S. equity markets in the period between September 2020 and December 2021. For SPACs, we calculate daily returns statistics for each of the three subperiods described above. Before a SPAC becomes an operating company, its daily returns show a much smaller variability, as illustrated by the lower volatility and the (much) smaller values for interdecile range (the difference between the top and bottom 10 percent of the equity returns distribution). Additionally, the market beta is close to zero for the pre-announcement period and about 0.6 after the announcement but before De-SPAC. After the SPAC becomes an operating company, both the equity returns variability and the stock market beta are comparable to the ones of non-SPAC companies that entered over the same period.
Table 4. Entrants’ daily equity return statistics
| SPACs | Non-SPACs | |||
|---|---|---|---|---|
| All entrants | Before Announcement | After Announcement & Before De-SPAC | After De-SPAC | |
| Mean | 0.01% | 0.02% | -0.19% | -0.07% |
| Vol | 2.28% | 2.93% | 6.35% | 7.18% |
| p10 | -0.52% | -1.36% | -5.98% | -5.43% |
| p50 | 0.00% | 0.00% | -0.41% | -0.19% |
| p90 | 0.51% | 0.97% | 5.61% | 5.12% |
| Beta | 0.12 | 0.56 | 1.2 | 1.28 |
| N | 96,150 | 17,752 | 12,835 | 108,075 |
Note: We used the NASDAQ IPO Calendar and spacresearch.com to manually classify newly listed firms into SPACs and non-SPACs. Announcement and de-SPAC dates come from spacresearch.com. Table reports statistics for all companies that entered equity markets between the end of August 2020 and the end of December 2021.
Source: Center for Research in Security Prices, CRSP 1925 US Stock Database, Wharton Research Data Services, http://www.whartonwrds.com/datasets/crsp; NASDAQ IPO Calendar; spacresearch.com.
Table 4 also highlights that SPAC stocks are more volatile after the announcement (but before De-SPAC). Figure 4 helps us understand why this is the case. We consider only the subset of SPACs that entered between the end of August 2020 and December 2021, have become an operating company, and depict some of the quantities reported in Table 4 around the period that goes from 60 days prior to 180 days after the day of the deal announcement. The shaded area is the interdecile range, the solid blue line is the median daily return, and the red dashed line is the fraction of SPACs that have become an operating company.
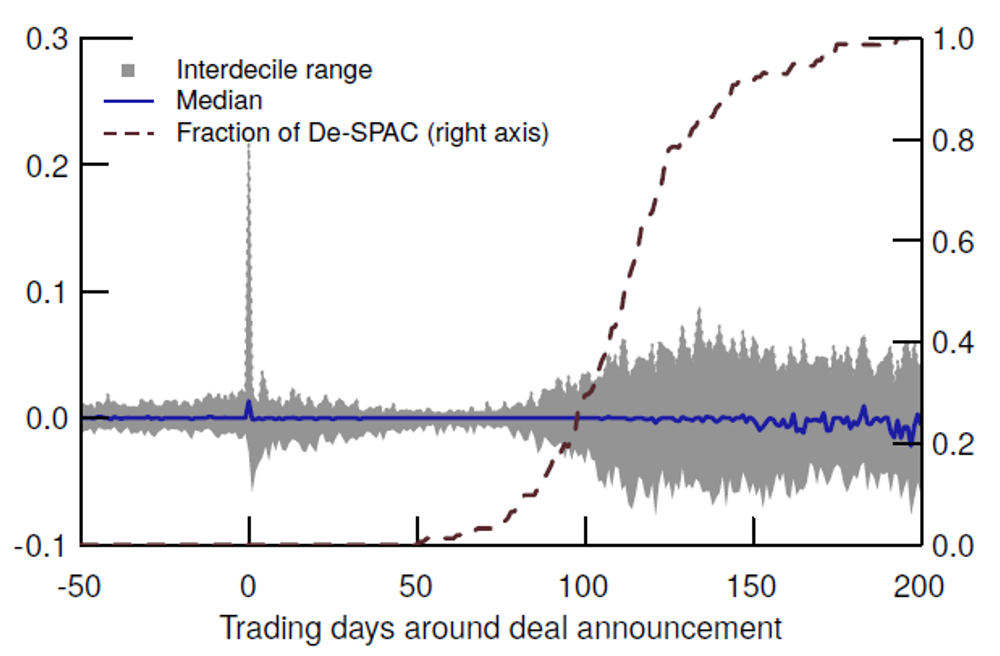
Note: We used the NASDAQ IPO Calendar and spacresearch.com to manually classify newly listed firms into SPACs and non-SPACs. Announcement and de-SPAC dates come from spacresearch.com.
Source: Center for Research in Security Prices, CRSP 1925 US Stock Database, Wharton Research Data Services. http://www.whartonwrds.com/datasets/crsp/; NASDAQ IPO Calendar, spacresearch.com.
Some interesting facts emerge by looking at the relatively short life-cycle of a publicly traded SPAC. First, stock returns have very little volatility in the days preceding a deal announcement, as the narrow interdecile range shows. On the announcement day, the volatility of returns spikes up significantly and then slowly declines to the pre-announcement level. This happens because after the announcement it takes time for SPACs to become operating companies. As the fraction of De-SPACs increase, stock returns volatility also goes up, and the interdecile range converges toward the values of the interdecile range of non-SPAC stocks (see also Table 4).
Concluding remarks
The number of publicly listed firms in the three major U.S. stock exchanges increased by about 1,100 in the period August 2020 to December 2021. This surge has been driven both by an unprecedented increase in the number of SPAC listings and by a large inflow of more traditional companies, thus suggesting that the post-COVID financial market environment has been particularly favorable for new IPOs amid low interest rates and ample market liquidity.
We document that the entry of SPACs has significantly modified the composition of U.S. equity markets over the period from August 2020 to the end of 2021. First, the fraction of small size stocks classified as SPACs had increased from about 8% to about 28%. Second, the fraction of ordinary common shares of foreign-incorporated companies has jumped from about 14 percent to about 18 percent. Third, at the end of 2021, companies in the Other Financial Investment Activities industry (4-digit NAICS code 5239) represented 15 percent of listed companies, up from about 4 percent in August 2020.
These compositional changes are very likely to be temporary since most SPACs are required to enter into a merger usually within 2 years from the IPO (or the SPAC must return shareholders' investments). As a consequence, we expect the fraction of firms in the Other Financial Investment Activities industry sector to decline as SPACs merge with companies operating in different industries. At the same time, we expect the fraction of ordinary common shares of foreign-incorporated companies to decline as more SPACs will become operating companies incorporated in the United States.
The fraction of SPACs in the small size stock category will also decrease. However, in the near future, having a large fraction of SPACs in small size portfolios might have implications for cross-sectional asset pricing given the peculiar properties of SPACs' returns before these investment vehicles become operating companies.9
References
Bulley, David and Dean Bennet (2020)," The use of Cayman Islands Structures for SPAC IPOS," webpage: https://www.applebyglobal.com/publications/the-use-of-cayman-islands-structures-for-spac-ipos/.
Doidge, Craig G., Andrew Karolyi, and René M. Stulz (2017), "The U.S. listing gap," Journal of Financial Economics https://www.sciencedirect.com/journal/journal-of-financial-economics, vol. 123 (3), pp. 464-487. https://doi.org/10.1016/j.jfineco.2016.12.002
Doidge, Craig G., Andrew Karolyi, and René M. Stulz (2004), "New lists: Fundamentals and survival rates," Journal of Financial Economics https://www.sciencedirect.com/journal/journal-of-financial-economics, vol. 73 (2), pp. 229-269. https://doi.org/10.1016/j.jfineco.2003.04.001
Gahng, Minmo, Jay R. Ritter, and Donghang Zhang (2021), "SPACs." Available at SSRN: https://ssrn.com/abstract=3775847.
1. We measure the number of traded firms as the number of unique PERMCOs in the CRSP database with a non-missing value for price and number of shares outstanding. We only consider ordinary common shares of companies incorporated in the U.S. and outside the U.S. (share codes in CRSP equal to 10, 11, and 12) and traded in the three major U.S. stock exchanges: NYSE, AMEX, and NASDAQ (exchange codes in CRSP equal to 1, 2, and 3, respectively). If a SPAC changes its PERMCO after an acquisition, we do not consider the new PERMCO to be a new traded entity. Return to text
2. Fama and French (2004) suggest that the increase in the number of publicly listed firms in the period 1980-2001 is due to a decline in the cost of equity that has prompted smaller and more financially fragile firms to go public. Doidge, Karolyi, and Stulz (2017) calculate that about 46% of the decline in the number of publicly traded firms from 1996 through 2012 was due to delisting, while the remaining fraction was due to a lower listing rate. Return to text
3. Santilli, Peter and Amrith Ramkumar (2021), "SPACs Are the Stock Market's Hottest Trend. Here's How They Work," The Wall Street Journal, March 29, https://www.wsj.com/articles/spacs-are-the-stock-markets-hottest-trend-heres-how-they-work-11617010202. With the total number of publicly listed firms increasing by 1,157 from the end of August 2020 to the end of December 2021 and 1,382 new entrants over the period, we estimate that 225 firms delisted over the period. Return to text
4. We used the NASDAQ IPO calendar to manually classify newly listed firms into SPACs and non-SPACs (https://www.nasdaq.com/market-activity/ipos). We also use data from the website spacresearch.com (https://www.spacresearch.com/) to identify SPACs that have finalized an acquisition by the end of February 2022. In this note, we focus on the first time a SPAC appears on one of the three major U.S. stock exchanges. Return to text
5. Gahng, Ritter, and Zhang (2021) provide one of the first analysis of SPACs in U.S. equity markets. Their sample of SPACs ends in December 2019, prior to the recent SPAC listing boom. Return to text
6. Specifically, the number of non-SPAC firms increased from 3,952 in August 2020 to 4,377 in December 2021, an increase of about 11 percent. Return to text
7. We measure size using market capitalization at the end of the first month of trade. Small firms belong to the bottom quintile of the market capitalization distribution. Market capitalization quintiles are calculated each month using only companies traded on the New York Stock Exchange. Return to text
8. Many SPACs choose to incorporate in the Cayman Islands to take advantage of their more favorable statutory merger regime (Bulley and Bennet, 2020). Return to text
9. Excluding SPACs from portfolio formation before they become an operating company could be a potential solution to mitigate their effect on the return properties of small size portfolios. Return to text
Dobridge, Christine L., Rebecca John, and Berardino Palazzo (2022). "The post-COVID stock listing boom," FEDS Notes. Washington: Board of Governors of the Federal Reserve System, June 17, 2022, https://doi.org/10.17016/2380-7172.3125.
Disclaimer: FEDS Notes are articles in which Board staff offer their own views and present analysis on a range of topics in economics and finance. These articles are shorter and less technically oriented than FEDS Working Papers and IFDP papers.