FEDS Notes
February 13, 2020
What Happened to Foreign Direct Investment in the United States?
Introduction
Official statistics show a drop in foreign direct investment in the United States (FDIUS) in 2017 and 2018 from especially robust levels in 2015 and 2016. Some analysts have attributed this drop to the United States becoming a less attractive destination for foreign investment. I argue against this hypothesis. This note demonstrates that the slowdown in FDIUS can be explained by two special factors: 1) a handful of corporate restructurings that are purely tax- and regulation-driven and affect the equity portion of direct investment flows, and 2) a reversal in intercompany debt flows that are often the result of corporate tax planning. After controlling for these special factors, I find that equity flows, the more meaningful portion of direct investment flows, were little changed in 2017 compared to the peak years of 2015-2016, and climbed to a record high in 2018.2 I construct the estimates using various data sources, as transactions associated with corporate restructurings are not separately identifiable in the official direct investment statistics. I also analyze the sharp drop in U.S. direct investment abroad (USDIA) in 2018 and find it to be similarly unique and a direct result of the 2017 Tax Cuts and Jobs Act (TCJA).
- Foreign direct investment in the United States (FDIUS)
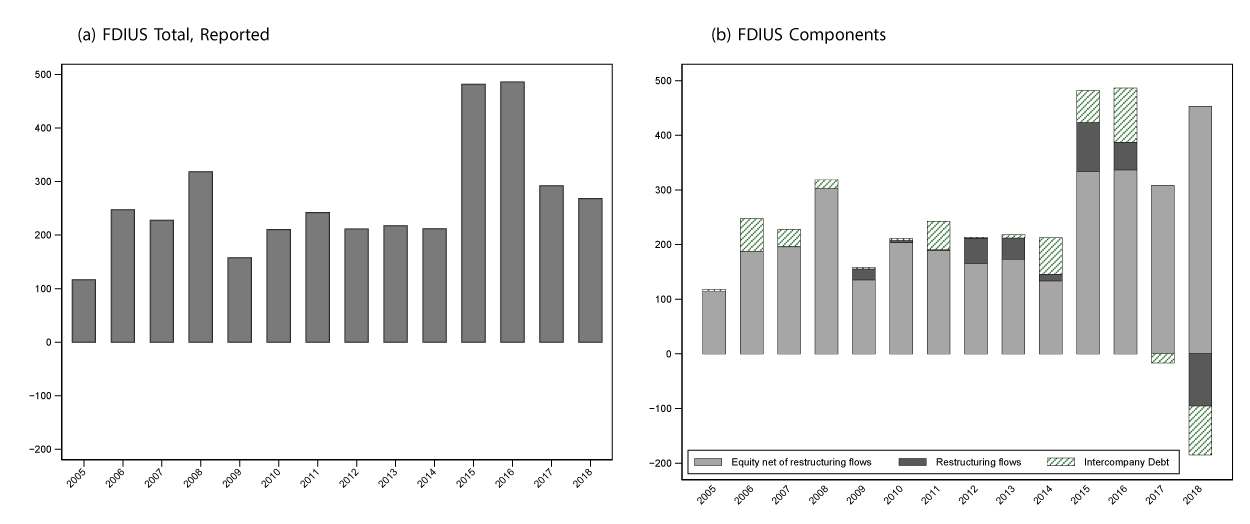
FDIUS fell in 2018 for a second consecutive year (figure 1(a)). This drop has garnered a lot of attention in policy circles and the media, and some analysts have attributed it to trade tensions and economic uncertainty that they see as having made the United States less attractive for foreign investment.3 While direct investment is usually associated with new investment, a lesser known feature of the data is that corporate restructurings that do not lead to any new investments can significantly affect direct investment statistics.4 Below I discuss the major corporate restructurings, such as inversions and re-incorporations, and other factors, such as intercompany loans, that distort the true direct investment picture in recent years.5
Source: Author's calculations using data from Bureau of Economic Analysis; Bloomberg BNA; S&P Global, Compustat; Securities and Exchange Commission, 10-K filings.
Special factor #1: Corporate Restructurings
Corporate inversions 2007-2016
The statistics of FDIUS include transactions resulting from corporate inversions. In an inversion, a U.S. company takes steps to become foreign-owned, usually for tax purposes. Inversions of U.S. companies lead to an increase in FDIUS: with an inversion, the original U.S. company becomes foreign-owned and it is then included in the BEA's FDIUS statistics, leading to an increase in FDIUS by roughly the market capitalization of the inverting company.6 Using all inverting companies' market capitalization from the year prior to the inversion, figure 1(b) shows the portion of FDIUS that I estimate is attributable to transactions resulting from corporate inversions (black bars). My estimate shows that corporate inversions are a major factor behind the increase in FDIUS in the peak years of 2015 and 2016. (I discuss 2018 in the next paragraph).7
The 2018 reincorporation of Broadcom
The year 2018 is a prime example of the role corporate restructurings play in the U.S. direct investment statistics. Broadcom, originally a high-tech firm founded in California, was purchased by Singaporean company Avago in 2016. In April 2018, Broadcom reincorporated from Singapore back to the United States and re-established its sole headquarters in California. Reincorporating as a U.S. company would facilitate its expansion via mergers and acquisitions of U.S. firms because domestic acquisitions are not subject to review by the Committee on Foreign Investment in the United States (CFIUS), a high-level government committee that investigates proposed acquisitions of U.S. companies by foreign buyers on national security and intellectual property grounds.8
Corporate reincorporations are the mirror image of inversions: in a reincorporation a foreign company that largely operates in the United States moves its legal address to the United States. Before the restructuring, the owner of the U.S. affiliate is a foreign parent and the transactions associated with such a direct investment relationship are recorded as FDIUS. After the restructuring, a newly formed U.S. parent becomes the ultimate owner and the previous direct investment relationship ceases to exist, leading to a reduction in FDIUS by roughly the market capitalization of the reincorporating company. I estimate that this single corporate event of the reincorporation of Broadcom reduced FDIUS in 2018 by $95 billion, a third of the total recorded FDIUS for that year, and is, therefore, a major factor behind the decline of total FDIUS in 2018 relative to the previous couple of years. Absent this reincorporation, I estimate that FDIUS in 2018 would have been roughly $360 billion, rather than the reported $270 billion.9
Special factor #2: Intercompany debt flows
Direct investment consists of two types of cross-border flows: equity flows and intercompany debt flows (loans between affiliated entities of the same company). The equity component is usually the more meaningful indicator of direct investment activity as it reflects new investment flows, such as mergers and acquisitions and greenfield investment, while intercompany loans are volatile and difficult to interpret (see OECD, 2019) and are often used for tax planning purposes to influence a company's taxable income.10 The green bars in figure 1(b) show the portion of total FDIUS that is accounted for by intercompany debt flows. The increase in intercompany debt flows is an important factor behind the rise in FDIUS in the peak years of 2015-2016, while the subsequent decline in debt liabilities of U.S. resident companies in 2018 is a major factor behind the decline in FDIUS in 2018. With the changes to the corporate tax law from the TCJA, the practice of using debt to influence taxable income may have been curtailed, leading to less intercompany borrowing by U.S. resident entities in 2017-2018.11
FDIUS net of special factors
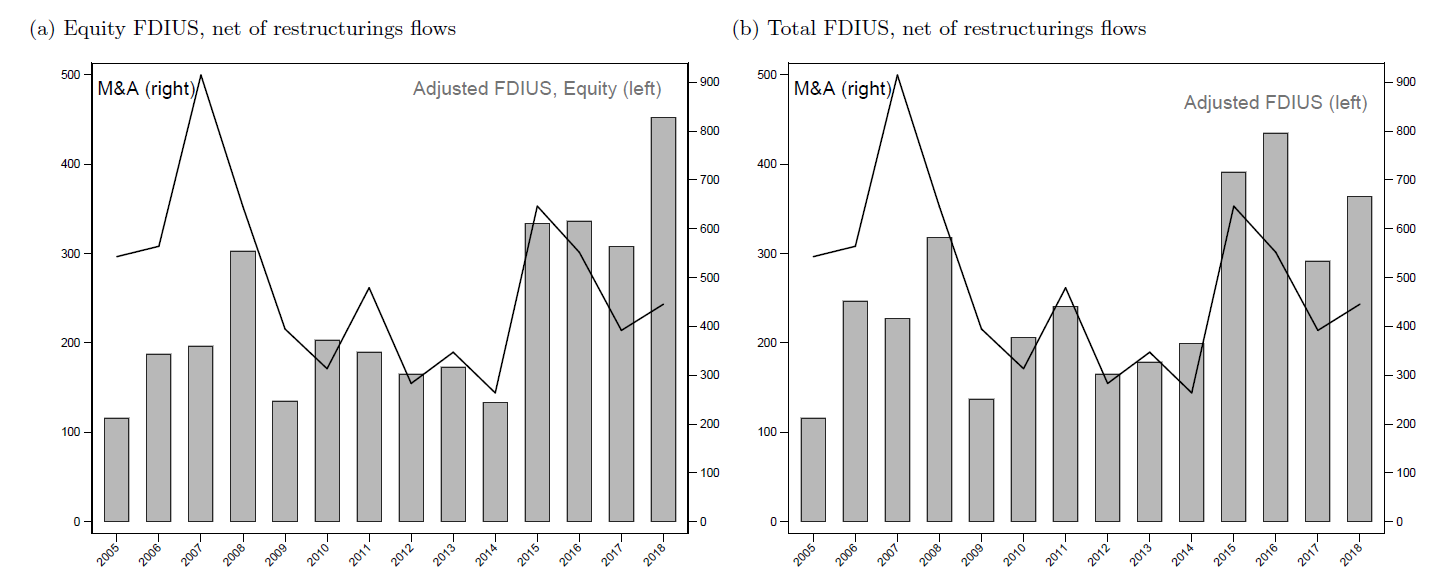
Figure 2 shows the FDIUS picture after adjusting for corporate restructurings and intercompany debt flows. In figure 2(a) I show FDIUS equity flows, the more meaningful part of total FDIUS, adjusted for inversions and re-incorporations (gray bars).12 My estimate shows that equity direct investment, net of flows associated with corporate restructurings, actually reached a peak in 2018, increasing substantially relative to the previous peak years of 2015-2016. Along with the adjusted equity flows, figure 2(a) plots foreign merger and acquisition (M&A) transactions that do not involve a U.S. company (the black line), i.e. transactions that capture foreign investment in the rest of the world (note the different scale). The equity flows series correlate with foreign investment in the rest of the world, suggesting that the pick-up in equity flows in the United States in the past four years is part of a global trend.
Figure 2: Adjusted Foreign Direct Investment in the United States (FDIUS). Directional Basis, Billions USD
Source: Author's calculations using data from Bureau of Economic Analysis; Refinitiv, ThomsonOne; Bloomberg BNA; S&P Global, Compustat; Securities and Exchange Commission, 10-K filings.
As a reference, figure 2(b) plots total FDIUS flows (thus including intercompany debt flows) adjusted only for flows associated with corporate restructurings, and shows foreign direct investment into the United States in 2018 was only slightly lower than the peak years of 2015 and 2016.
In addition to the FDIUS transactions statistics that I use for this analysis, the BEA also publishes statistics on expenditures for new foreign direct investment in the United States that capture only transactions related to new investments. While the new investment statistics exclude purchases of additional equity and intercompany debt transactions that are related to ongoing operations, they still include transactions related to corporate restructurings.13 While these statistics on new investment expenditures overlap only partially with my estimates of FDIUS net of special factors, they still show no drop in investment in 2018.14
- U.S direct investment abroad
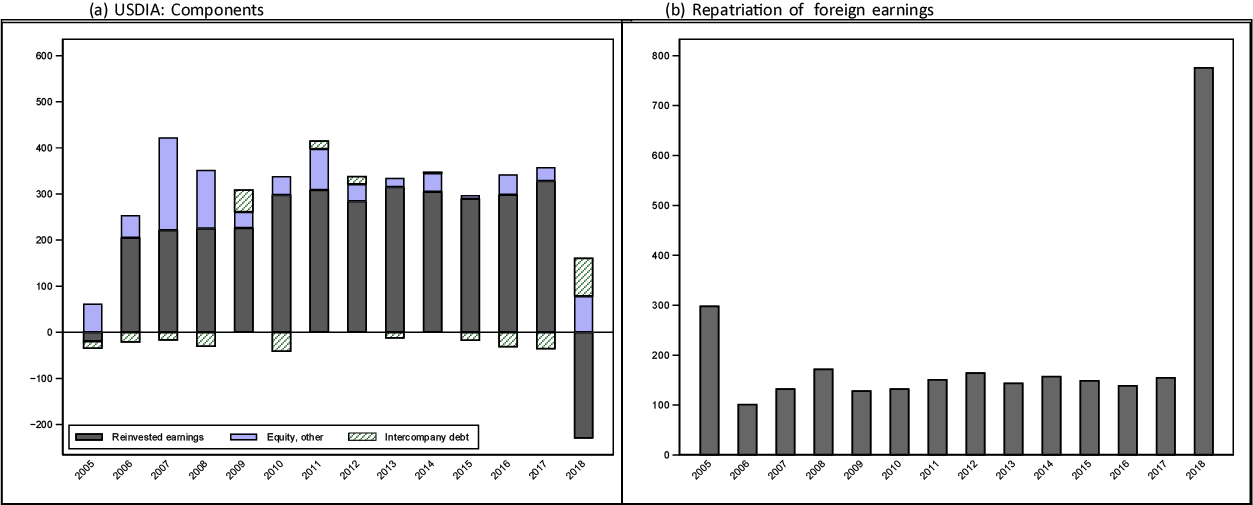
The significant drop in U.S. direct investment abroad (USDIA) in 2018 (figure 3(a)) is similarly unique, although the explanation in this case is more straightforward, as it is related to the repatriation of foreign earnings associated with the TCJA. Given the prominence of reinvested earnings in total equity flows, in figure 3(a) I show the components of direct investment split into reinvested earnings (black bars), other equity transactions not associated with reinvested earnings (blue bars), and intercompany debt (green bars).15 For most of the period prior to 2018, reinvested earnings accounted for the majority of USDIA flows. The drop in USDIA in 2018 is driven by the drop in reinvested earnings as a result of the 2017 TCJA that eliminated the tax incentive to keep earnings abroad and led to U.S. companies repatriating a large part of their accumulated earnings abroad. The drop in USDIA in 2018 is therefore driven purely by the change in tax treatment of offshore profits.16 As repatriation reflects the transfer of funds to the United States in purely accounting terms, i.e. funds previously held by a foreign affiliate are now held by the U.S. parent, it does not reflect a sell-off of foreign operations by U.S. companies. In fact, as shown in figure 3(a), equity investment other than reinvested earnings (blue bars) was strong compared to previous years.
Source: Bureau of Economic Analysis.
1. Board of Governors of the Federal Reserve System. I thank Daniel Beltran, Carol Bertaut, Beth Anne Wilson, Shaghil Ahmed for comments and suggestions. The views in this note do not necessarily reflect those of the Federal Reserve System, its Board of Governors, or staff. Return to text
2. I focus on FDI measured on a directional basis. The results are similar when using direct investment measured on an asset/liability basis. Return to text
3. See for example: UNCTAD World Investment Report 2019: https://unctad.org/en/PublicationsLibrary/wir2019_en.pdf; WSJ https://www.wsj.com/articles/for-foreign-investment-the-west-is-losing-its-appeal-11560358800; blog posts by Menzie Chinn http://econbrowser.com/archives/2018/11/inward-us-bound-fdi; Adam Posen https://www.piie.com/blogs/trade-investment-policy-watch/cost-trumps-economic-nationalism-loss-foreign-investment-united Return to text
4. While the BEA also publishes statistics on expenditures for new foreign direct investment in the United States, these statistics also include transactions related to corporate restructurings. Return to text
5. The BEA does not collect data on corporate restructurings, but does mention their role in the news releases accompanying balance of payments (BOP) data releases. See, for example the news release for 2015Q1 BOP data https://www.bea.gov/news/2015/us-international-transactions-1st-quarter-2015-and-annual-revisions. Return to text
6. On how corporate inversions affect the BEA's international statistics, see Hanson et al (2015). "The Effects of Corporate Inversions on the International and National Economic Accounts" BEA Briefing, February 2015. Return to text
7. Source for inversion events: Bloomberg. Estimates for FDIUS flows attributable to corporate restructurings reflect the companies' market capitalization for the year prior to the corporate event, using data from Compustat and company 10-K filings from SEC. Return to text
8. Broadcom's attempt to acquire U.S. chipmaker Qualcomm in early 2018 was blocked by an executive order from President Trump issued on March 12, 2018, citing a review by the Committee on Foreign Investment in the United States: https://www.whitehouse.gov/presidential-actions/presidential-order-regarding-proposed-takeover-qualcomm-incorporated-broadcom-limited/. Return to text
9. The 2018 adjusted FDIUS reflects only the reincorporation of Broadcom as no other corporate restructuring or inversions took place in 2018. Return to text
10. It is a common practice for an affiliate in a high-tax jurisdiction to borrow significantly from other parts of the multinational corporation. This increases interest expenses for that affiliate and thereby reducing their tax liability. Return to text
11. In particular, the base erosion and anti-abuse tax (BEAT) provision of the TCJA targets multinational companies that make deductible payments, such as interest payments, to related foreign entities. Return to text
12. The bars in figure 2(a) correspond to the gray bars in figure 1(b). Return to text
13. The statistics on new investment by foreign direct investors are based on the annual Survey of New Foreign Direct Investment in the United States conducted by the BEA. For more details, see BEA (2016). "New Foreign Direct Investment in the United States in 2015". Data are not available for the period 2008-2013. Return to text
14. Anderson (2019). "New Foreign Direct Investment in the United States in 2018". Survey of Current Business, U.S. Bureau of Economic Analysis. Return to text
15. The bars sum to total USDIA. Return to text
16. See BEA on the effect of the 2017 TCJA on the U.S. international transactions accounts: https://www.bea.gov/news/2019/us-international-transactions-first-quarter-2019-and-annual-update#TCJA. For a summary of the implications of the repatriation, see https://www.federalreserve.gov/econres/notes/feds-notes/us-corporations-repatriation-of-offshore-profits-20190806.htm. Return to text
Tabova, Alexandra M. (2020). "What Happened to Foreign Direct Investment in the United States?," FEDS Notes. Washington: Board of Governors of the Federal Reserve System, February 13, 2020, https://doi.org/10.17016/2380-7172.2499.
Disclaimer: FEDS Notes are articles in which Board staff offer their own views and present analysis on a range of topics in economics and finance. These articles are shorter and less technically oriented than FEDS Working Papers and IFDP papers.