FEDS Notes
February 14, 2020
What Happened to U.S. Business Dynamism?1
Ufuk Akcigit and Sina T. Ates
The U.S. economy has witnessed a number of striking trends that indicate a rising market concentration and a slowdown in business dynamism in recent decades. We attempt to understand potential common forces behind these empirical regularities through the lens of a micro-founded general equilibrium model of endogenous firm dynamics. Our results highlight the dominant role of a decline in the intensity of knowledge diffusion from the frontier firms to the laggard ones in explaining the observed shifts. We also present new evidence on higher concentration of patenting in the hands of firms with the largest stock and a changing nature of patents that corroborates a declining knowledge diffusion in the economy.
The loss of business dynamism—the perpetual process of new firms forming, growing, shrinking, and dying, which is a fundamental source of reallocation of factors to more productive units—in the U.S. economy since the 1980s and, even more strikingly, since the 2000s manifests itself in a number of empirical regularities. The entry rate of new businesses (Figure 1a), the job reallocation rate, and the labor share have all been decreasing (Decker et al., 2016; Karabarbounis and Neiman, 2013; Barkai, 2017, among others), yet the profit share, market concentration, and markups (Figure 1b) have all been rising (Autor et al., 2017a,b; De Loecker and Eeckhout, 2017; Gutiérrez and Philippon, 2016, 2017; Eggertsson et al., 2018; Farhi and Gourio, 2018, among others). These trends have drawn notable attention from academic as well as policy circles. Indeed, the Federal Trade Commission has recently held "Hearings on Competition and Consumer Protection in the 21st Century" with special attention to competition and market concentration. While suggestions for the potential drivers of these structural shifts are abundant, there is little consensus in the literature on the underlying cause(s) that could jointly account for these potentially related developments. In two complementary recent papers, we contribute to this important, and predominantly empirical, debate by offering a new micro-founded macro model—which provides a unifying theoretical framework that can speak to all those symptoms—conducting a quantitative investigation of alternative mechanisms that could have led to these dynamics, and presenting some new facts on the rise of patenting concentration.
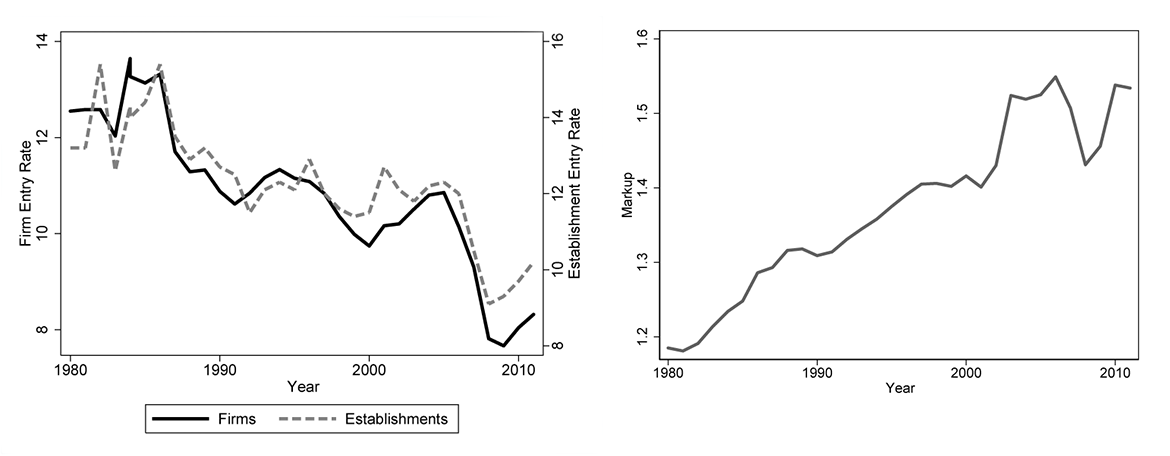
Notes: Panel A is based on authors' calculations from Business Dynamics Statistics database. Panel B is taken from De Loecker and Eeckhout (2017). The figures show the decline in firm and establishment enry rates in the United States along with an increase in the average markup of large publicly traded firms since 1980s, suggesting a rise in the market power of large firms as business dynamism declines.
In Akcigit and Ates (2019a), we review the findings of the literature and focus on the following prominent regularities:
- Market concentration has risen.
- Average markups have increased.
- The profit share of GDP has increased.
- The labor share of output has gone down.
- The rise in market concentration and the fall in labor share are positively associated.
- Productivity dispersion of firms has risen. Similarly, the labor productivity gap between frontier and laggard firms has widened.
- Firm entry rate has declined.
- The share of young firms in economic activity has declined.
- Job reallocation has slowed down.
- The dispersion of firm growth has decreased.
Our review of these trends and various changes in the economy that might have led to these trends directs our attention to a certain class of models. Accordingly, we build a theoretical model that accounts for, in particular, endogenous market power and strategic competition among incumbents and entrants, reflecting ''best versus the rest" dynamics.
In Akcigit and Ates (2019b), we extend and calibrate this model to the U.S. economy. Importantly, our quantitative analysis replicates the transitional dynamics of the U.S. economy in the past three decades. Our decomposition exercises demonstrate decisively that distortions to the diffusion of knowledge across firms in the economy are the likely culprit behind declining U.S. business dynamism. The remainder of this note provides a description of the extended model as well as a summary and implications of the main quantitative results in Akcigit and Ates (2019b).
Model description
Our theoretical framework centers on an economy that consists of many sectors. In each sector, two incumbent firms, which can also be interpreted as the best and the rest, compete à la Bertrand for market leadership. In this competitive structure, the firm with higher productivity becomes the market leader, and the price it charges for the good it produces depends positively on the productivity difference between the two competitors. As a result, the markups are a function of the technology gap between firms. These markups evolve endogenously, as firms engage in research and development activities to improve their productivity level with new inventions. Market leaders try to innovate in order to open up the lead and increase their markups and profits. Follower firms try to innovate with the hope of eventually leapfrogging the market leader and gaining market power. In this race, knowledge diffusion, which occurs at an exogenous rate, allows followers to learn from the market leaders and quickly catch up with them. Likewise, new firms attempt to enter the economy with the hope of becoming a market leader someday.
A very important aspect of the model is the strategic investment on innovation by the firms: Intense competition among firms, especially when the competitors are in a neck-and-neck position in terms of their productivity levels, induces more aggressive innovation investment and more business dynamism. Yet when the leaders open up their technological lead, followers lose their hope of leapfrogging the leader and lower their innovation effort. Likewise, entrants get discouraged when the markets are overwhelmingly dominated by the market leader, and the entry rate decreases.
Our structural model allows us to analyze several important margins that shape the competition dynamics: corporate taxes, R&D subsidies, entry costs, knowledge diffusion, a decline in the interest rates, a fall in research productivity, and a decrease in workers' market power relative to employers/firms.
Quantitative findings
We calibrate the model using data prior to early 1980s such that the balanced growth path (BGP) of the model reflects the state of the U.S. economy in early 1980s, after when we observe most of the aforementioned empirical trends. Then, we analyze the transitional dynamics of the model economy and assess the ability of alternative channels mentioned earlier to generate trends in the model that match the ones we have observed in the data since the 1980s. We introduce shocks to each channel one at a time (in a way disciplined by the data) and compare the model-generated responses of each variable over the transition path. Table 1 compares the directions of model-based responses to changes in each mechanism with those of their empirical counterparts. The findings emphasize the differential ability of the knowledge diffusion channel for accounting for the observed trends, as can be seen by comparing column 5 with column 1, lower knowledge diffusion can explain, qualitatively at least, all of the trends observed in the data. By themselves individually, other explanations can account for only a subset of the trends in the data.
Table 1. Qualitative experiment results for alternative mechanisms
| Data (1) |
Lower corporate tax (2) |
Higher R&D subsidies (3) |
Higher entry cost (4) |
Lower knowledge diffusion (5) |
Declining interest rate (6) |
Ideas getting harder (7) |
Weaker power of workers (8) |
|
|---|---|---|---|---|---|---|---|---|
| Concentration | ↑ | ←→ | ←→ | ←→ | ↑ | ←→ | ↓ | ←→ |
| Markups | ↑ | ←→ | ←→ | ←→ | ↑ | ←→ | ↓ | ↑ |
| Profit share | ↑ | ←→ | ↓ | ←→ | ↑ | ↓ | ↓ | ↑ |
| Labor share | ↓ | ←→ | ↑ | ←→ | ↓ | ↑ | ↑ | ↓ |
| Frontier vs. laggard gap | ↑ | ←→ | ←→ | ←→ | ↑ | ←→ | ←→ | ↑ |
| Entry | ↓ | ↑ | ←→ | ↓ | ↓ | ↑ | ↓ | ↑ |
| Young firms' empl. share | ↓ | ←→ | ↓ | ↓ | ↓ | ←→ | ↓ | ←→ |
| Gross job reallocation | ↓ | ↑ | ↑ | ←→ | ↓ | ↑ | ↓ | ↑ |
| Dispersion of firm growth | ↓ | ↓ | ↓ | ↑ | ↓ | ↓ | ↑ | ↓ |
Notes: The columns summarize the change over three decades in each variable listed in the table rows in response to the shock path introduced to the BGP of the model economy through the channel listed in each column. ↑ Upward arrows indicate an increase in the variable of interest, ↓ downward arrows indicate a decline, and ←→ flat arrows indicate no or negligible change. If the absolute magnitude of the response of a variable is less than 20 percent of the actual change in the data, we denote it by a flat arrow.
In another exercise, we also replicate the transitional dynamics of the U.S. economy in the post-1980 period matching the changes in key aspects of the economy such as the decline in firm entry. The transition is driven by the calibrated changes in four margins: changes in corporate tax rates, R&D subsidies, entry barriers, and knowledge diffusion. We then decompose the contribution of changes along these margins to the model-generated path of each variable listed in Table 1 (Here, we show the results for a subset of variables, see Table 2). We find that the decline in knowledge diffusion accounts for more than 70 percent of most symptoms of declining business dynamism and at least 50 percent of all observed trends. The other factors rarely account for more than 10 percent of the changes.
Table 2. Quantitative experiment results
| Lower corporate tax | Higher R&D subsidies | Higher entry cost | Lower knowledge diffusion | |
|---|---|---|---|---|
| Entry | -8.2% | -0.4% | 17.9% | 50.6% |
| Labor | 9.0% | -7.7% | 3.6% | 78.7% |
| Markup | 7.6% | 10.8% | 3.6% | 84.2% |
| Profit | -9.0% | -7.7% | 3.6% | 78.7% |
| Concentration | 4.3% | 7.1% | -7.2% | 96.2% |
| Young firms | -13.2% | -7.7% | -1.3% | 71.2% |
Notes: Percentage values measure the share of the contribution from the specific channel to the total model-generated deviation between 1980 and 2010. If the change in a variable in the calibrated transition is x percent, and it declines to x/2 percent in the counterfactual where the parameter governing channel i is assumed to remain in its BGP level, then we say channel i accounts for 50 percent of the change in that variable. Negative values mean that adding the specific channel moves the model-generated variable in the opposite of the empirical counterpart. The label "Young firms" refer to the employment share of firms younger than 5 years in the economy.
To understand why knowledge diffusion matters, consider a market where it is largely absent. In that case, market leaders are shielded from being copied, which helps them establish stronger market power. When market leaders have a bigger lead over their rivals, the followers get discouraged; hence, they slow down. The productivity gap between leaders and followers opens up. The first implication of this widening is that market composition shifts to more concentrated sectors. Second, limit pricing allows stronger leaders (leaders further ahead) to charge higher markups, which also increases the profit share and decreases the labor share of gross domestic product (GDP). Since entrants are forward looking, they observe the strengthening of incumbents and get discouraged; therefore, entry goes down. Discouraged followers and entrants lower the competitive pressure on the market leader: When they face less threat, market leaders relax, and they experiment less. Hence, overall dynamism and experimentation decrease in the economy.
How U.S. patenting data reflects the decline in knowledge diffusion
Based on our findings, a natural follow-up question is, what caused a decline in knowledge diffusion? To elaborate on this question, we present new evidence on the use (or abuse) of patents in the United States. Patent and reassignment data from the U.S. Patent and Trademark Office (USPTO) provide a fertile ground for investigating patterns of knowledge diffusion, as firms rely heavily on patent protection to shield themselves from imitators.2 A decline in imitators' ability to copy and learn from market leaders' technology due to heavier, and especially strategic, use of patents by the leaders would limit the flow of knowledge between firms and lead to a reduction in the intensity of knowledge diffusion. Therefore, we now turn our attention to the changes in the use of patents in the U.S. economy across time.
Figure 2a looks at the share of patents registered by the top 1 percent of innovating firms with the largest patent stocks. The ratio exhibits a dramatic increase. In addition, the share of patents registered by new entrants (firms that patent for the first time) exhibits the opposite trend, notwithstanding the small pickup in the early 1980s (Figure 2b).
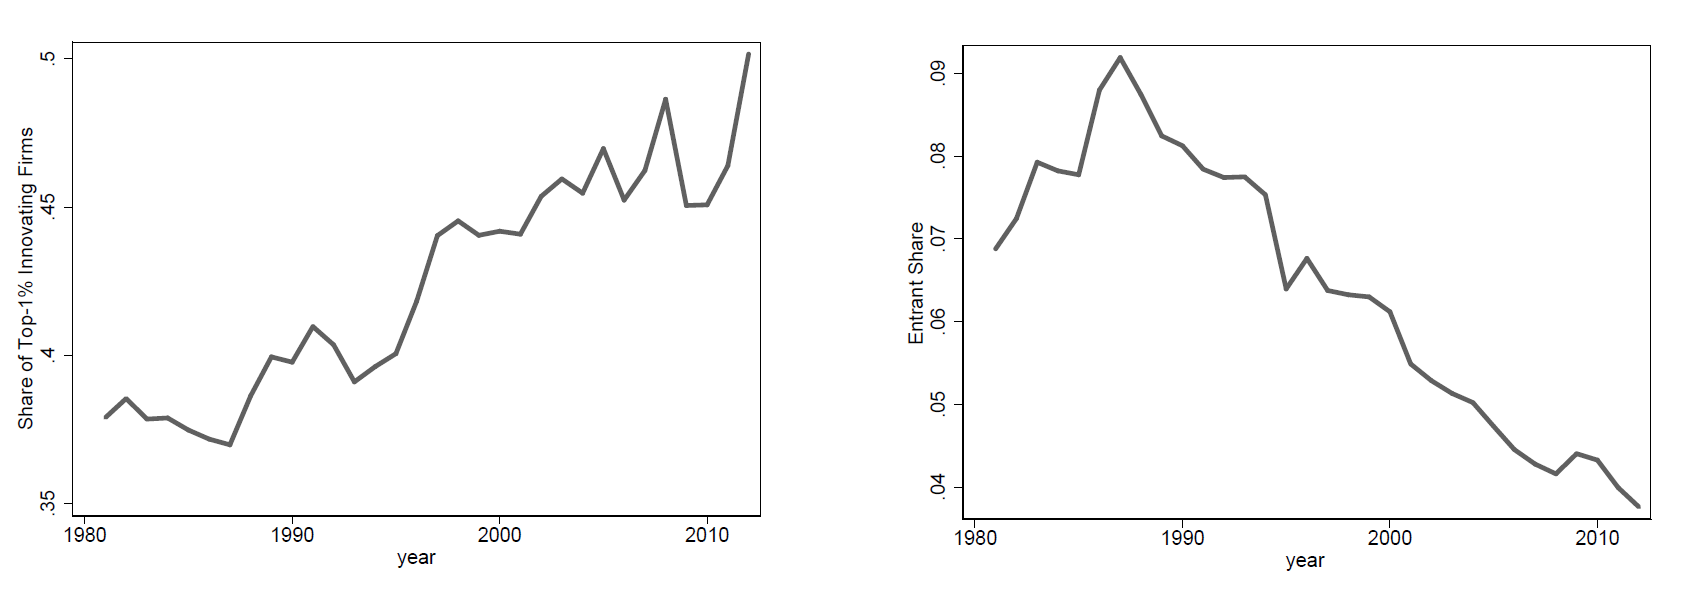
Notes: Based on authors' calculations from U.S. Patent and Trademark Office data. Panel A shows the the notable increase in the share of patent applications registered by top 1 percent of firms with the largest patent stocks in total applications made since the late 1980s. Reciprocally, Panel B shows the declien in the share of applications registered by entrant firms, i.e., firms that patent for the first time, over the same time period. These figures inidcate a concentration of the patenting and likely innovative activity in firms that own already the largest patent stock.
As in patent registries, we observe stark trends in patent reassignments since the 1980s. Figure 3a focuses on the purchasing trends of the top 1 percent of firms with the largest patent portfolios. The figure reveals that while 30 percent of the transacted patents were reassigned to the firms with the largest patent stocks in the 1980s, the share went up to 55 percent by 2010. This drastic increase has crowded out small players in the market, as illustrated in Figure 3b. The figure shows the likelihood of a patent to be assigned to a small firm, conditional on that patent being transacted from another small firm and recorded. In the past two decades, the fraction of transacted patents that are reassigned to small firms has dropped dramatically, implying a shift of ownership from the hands of small firms to large ones. These figures reveal that concentration in patent production and reassignment has surged, and firms with the largest patent (knowledge) stock have further expanded their intellectual property arsenals. Given that patents are exclusively used to prevent competitors from using the patent holders' technology, these trends can imply that the heavy use of patents by market leaders might have caused the decline in knowledge diffusion from the best to the rest.
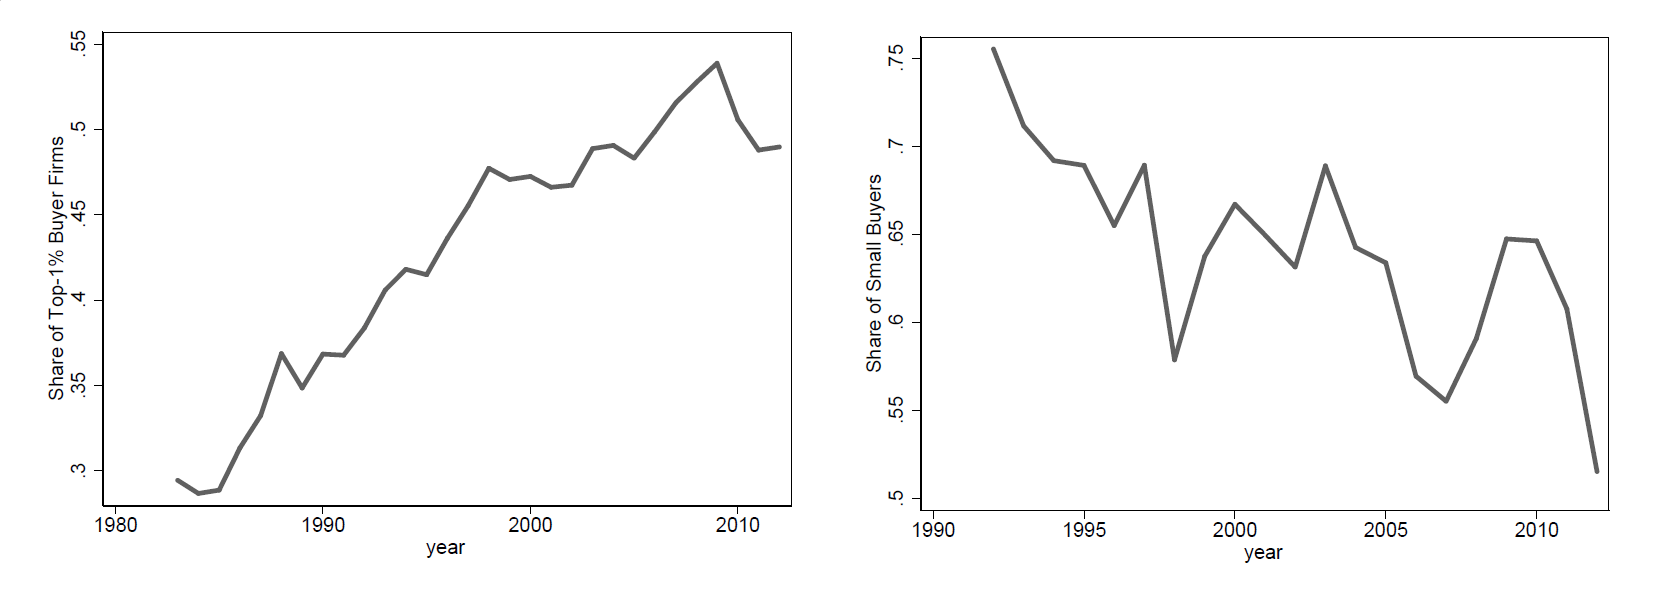
Notes: Based on authors' calculations from U.S. Patent and Trademark Office data. Panel A shows the dramatic increase the share of patents reassigned to top 1 percent of firms with the largest patent stocks among all reassigned patents since the 1980s. Reciprocally, Panel B shows the steady decline in the share of patent reassignments registered to small buyers over the same time period. These figures indicate that patents are accumulated in the firms that own the largest patent stocks also via reassignments of patents.
Of course, the above analysis only highlights the potential abuse of patents, or, in general, intellectual property rights, which could bring about the aforementioned adverse effects on knowledge diffusion. But that is, of course, not to say that patents only serve as a means of establishing outsized market power for some firms. Patents have significant benefits as well—first and foremost, they allow inventors reap some of the return to their ideas, thus generating pecuniary incentives for innovative activity. Therefore, our analysis implies that the above discussed costs have to be weighed against these benefits when designing optimal policies for intellectual property protection.
References
Akcigit, Ufuk and Sina T. Ates, "Ten Facts on Declining Business Dynamism and Lessons from Endogenous Growth Theory," 2019. National Bureau of Economic Research Working Paper 25755.
Akcigit, Ufuk and Sina T. Ates, "What Happened to U.S. Business Dynamism?," 2019. National Bureau of Economic Research Working Paper 25756.
Autor, David, David Dorn, Lawrence F. Katz, Christina Patterson, and John Van Reenen, "Concentrating on the Fall of the Labor Share," American Economic Review, 2017, 107 (5), 180–85.
Autor, David, David Dorn, Lawrence F. Katz, Christina Patterson, and John Van Reenen, "The Fall of the Labor Share and the Rise of Superstar Firms," 2017. National Bureau of Economic Research Working Paper 23396.
Barkai, Simcha, "Declining Labor and Capital Shares," 2017. University of Chicago, mimeo.
Decker, Ryan A., John C. Haltiwanger, Ron S. Jarmin, and Javier Miranda, "Declining Business Dynamism: What We Know and the Way Forward," American Economic Review: Papers & Proceedings, 2016, 106 (5), 203–07.
De Loecker, Jan and Jan Eeckhout, "The Rise of Market Power and The Macroeconomic Implications," 2017. National Bureau of Economic Research Working Paper 23687.
Eggertsson, Gauti B., Jacob A. Robbins, and Ella Getz Wold, "Kaldor and Piketty's Facts: The Rise of Monopoly Power in the United States," 2018. National Bureau of Economic Research Working Paper 24287.
Farhi, Emmanuel and François Gourio, "Accounting for Macro-Finance Trends: Market Power, Intangibles, and Risk Premia," 2018. National Bureau of Economic Research Working Paper 25282.
Gutiérrez, Germán and Thomas Philippon, "Investment-less Growth: An Empirical Investigation," 2016. National Bureau of Economic Research Working Paper 22897.
Gutiérrez, Germán and Thomas Philippon, "Declining Competition and Investment in the U.S.," 2017. National Bureau of Economic Research Working Paper 23583.
1. Ufuk Akcigit ([email protected]) is a Professor of economics at the University of Chicago, and Sina T. Ates ([email protected]) is a Senior Economist in the Division of International Finance of the Federal Reserve Board of Governors. We thank Shaghil Ahmed for his comments. The views expressed are solely the responsibility of the authors and should not be interpreted as reflecting the views of the Board of Governors of the Federal Reserve System or of any other person associated with the Federal Reserve System. Return to text
2. Patent reassignment data provide information on the change of ownership of patents. A patent's ownership can change because of several reasons such as sales, mergers, license grants, etc. In the analysis, we focus on sales of patents between firms. Return to text
Akcigit, Ufuk, and Sina T. Ates (2020). "What Happened to U.S. Business Dynamism?," FEDS Notes. Washington: Board of Governors of the Federal Reserve System, February 14, 2020, https://doi.org/10.17016/2380-7172.2497.
Disclaimer: FEDS Notes are articles in which Board staff offer their own views and present analysis on a range of topics in economics and finance. These articles are shorter and less technically oriented than FEDS Working Papers and IFDP papers.