Celebrating 100 Years of the Industrial Production Index
A Brief History of the Index of Industrial Production1
Ever since the Federal Reserve was founded in 1913, understanding current business conditions has been a central focus in pursuing its mission of a stable and secure financial system. Less than a year after the first Board members took their oaths of office, the organization issued the inaugural monthly Federal Reserve Bulletin, which included narrative summaries of general business conditions in each of the 12 Federal Reserve Districts.
Over the next few years, the monthly reports from the Federal Reserve Districts became more statistically oriented. At the same time, private industry was in the process of reorganizing to supply the country’s effort in World War I and would soon thereafter transition to a postwar economy. In order to track the changes that were taking place, the Board in 1919 began publishing monthly tables containing data on the production of different goods, such as iron and steel, cotton and wool, and pulp and paper.2
By early 1922, the tables on the physical volume of trade had expanded to show a large number of items. To present this information in a "more compact and better coordinated form," the Board developed three indexes of industrial activity: manufacturing, mining, and agriculture.3 These monthly indexes were published back to 1919, and they used the average of monthly activity in that year as a base. By the end of 1922, a second set of indexes—narrower in coverage but based on more refined methodology—was introduced.4 These new measures were made available by the 25th day following the reference month.
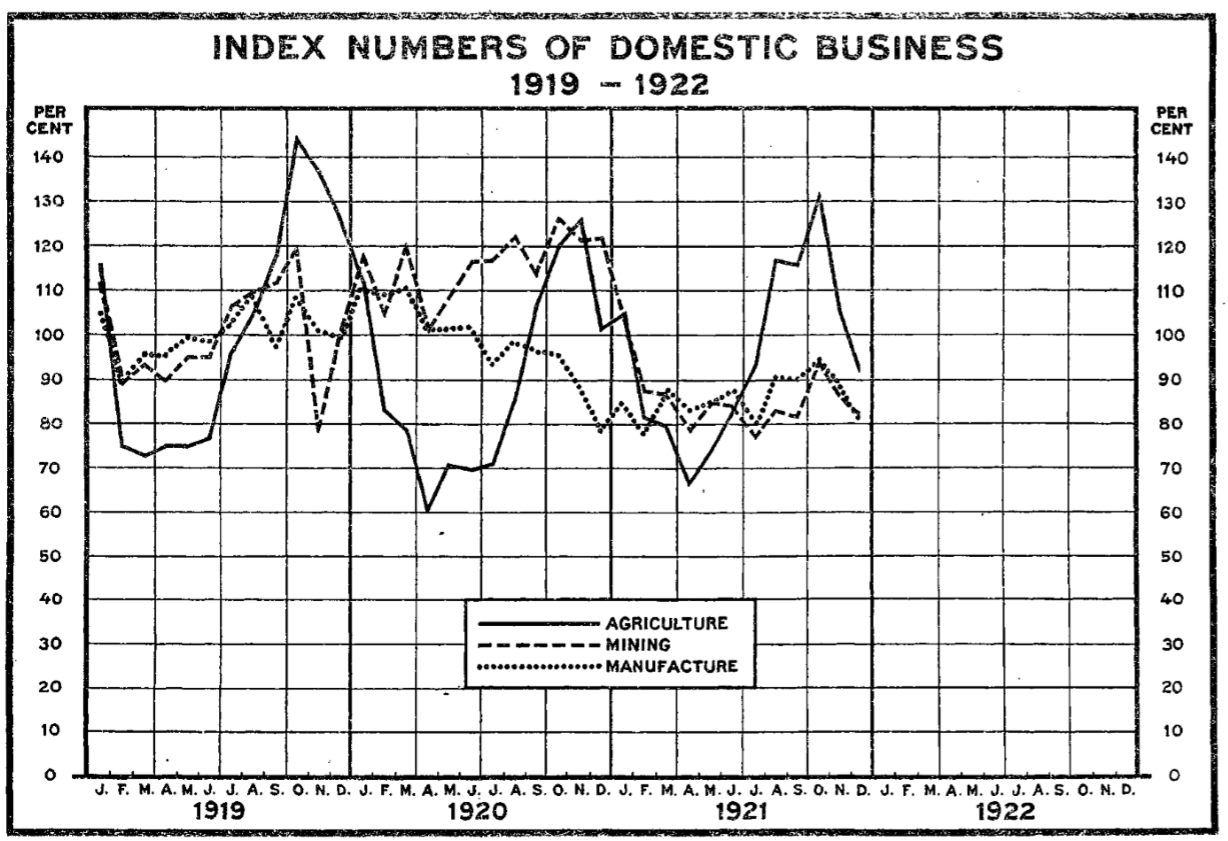
Source: Board of Governors of the Federal Reserve System (1922), "Indexes of Trade and Production," Federal Reserve Bulletin, vol. 8 (March), pp. 292–96, https://fraser.stlouisfed.org/title/62/item/20534.
Accessible Version
The production indexes introduced in 1922 provide a picture of the industrial composition of the time. Pig iron made up 18 percent of the weight of the total index, and cotton fabric represented 15 percent. Using weights for 2018, pig iron is less than 0.1 percent of the total index and cotton fabric is less than 0.05 percent.
During the 1930s, the index of industrial production achieved prominence as an important indicator of macroeconomic trends. There were few methodological developments during this period, however, as members of the small staff who worked on the index were swept up in a number of projects related to the financial collapse, the Great Depression, and the New Deal.
As the economy improved and the pressure of other work demands eased, Federal Reserve staff members were able to refocus on the production indexes and, in 1940, published a major revision to the index. The revision was the first to include all industries in manufacturing, and it introduced a more detailed coverage of new and growing industries like machinery; it also introduced the use of production worker hours to measure the output of industries, such as chemicals and furniture, for which data on physical production were unavailable.
Economic activity in the early 1940s was dominated by the country’s involvement in World War II. Measuring production was especially challenging during this period of marked shifts in the composition of output. The activities of whole industries changed dramatically to support the war effort, and some industry names became misleading. The "auto and freight car" industry, for example, produced large numbers of planes and tanks. Furthermore, the typical seasonal variations of output for some industries evaporated during the war.
After the war, the number of individual series that compose the total index rose substantially, from 100 in 1943, to 175 in 1953, to 207 in 1959, to 300 today. This increased detail allowed for more appropriate weighting of the components and for a better allocation of series to "market groups." The market group presentation of output, which was introduced in 1943 and refined in subsequent years, allowed data users to track production by the sector of the economy that consumed the goods; it was offered in addition to the standard "industry group" presentation that organized output by types of goods being produced.
In 1956, the index of industrial production expanded to include the output of electric and gas utilities along with the measures for manufacturing and mining. These three sectors continue to be the main components of the index today.
In the late 1950s, Federal Reserve staff began to use computers for many of the calculations required to construct the index. As data processing became faster and easier in subsequent years, the methodological work on the index included numerous refinements to methods for adjusting and aggregating the component indexes.
In recent years, upgrades to the index have also been aimed at improving output measures for specific industries. For example, new data and methods were needed to keep pace with the rapid evolution of products in high-technology industries such as computers, communications equipment, and semiconductors.

Accessible Version
Footnotes
1. This summary is derived largely from the chapter on the history of the industrial production statistics as published in Board of Governors of the Federal Reserve System (1986), Industrial Production: 1986 Edition (Washington: Board of Governors) Return to text
2. Board of Governors of the Federal Reserve System (1918), "Indexes of Business Conditions," Federal Reserve Bulletin, vol. 4 (June), p. 491, https://fraser.stlouisfed.org/title/62/item/21107; Board of Governors of the Federal Reserve System (1919), "Physical Volume of Trade," Federal Reserve Bulletin, vol. 5 (January), pp. 77–82, https://fraser.stlouisfed.org/title/62/item/20585. Return to text
3. Board of Governors of the Federal Reserve System (1922), "Indexes of Trade and Production," Federal Reserve Bulletin, vol. 8 (March), pp. 292–96, https://fraser.stlouisfed.org/title/62/item/20534. Return to text
4. Board of Governors of the Federal Reserve System (1922), "Index of Production in Selected Basic Industries," Federal Reserve Bulletin, vol. 8 (December), pp. 1414-21, https://fraser.stlouisfed.org/title/62/item/20543. Return to text