FEDS Notes
October 12, 2018
Accounting for Reinsurance Transactions in the Financial Accounts of the United States
Executive Summary
Reinsurance is often described as insurance for insurance companies. Beginning with the 2018:Q2 release, we now document reinsurance transactions in the Financial Accounts of the United States (Financial Accounts). First, we now highlight how insurers depend upon each other through different forms reinsurance. Second, we explicitly account for reinsurance transactions, whereas in previous releases balances were reported net of reinsurance. In addition to shedding light on these relationships, the new treatment captures parts of the industry that were missing from the Financial Accounts due to reinsurance in jurisdictions with limited disclosure requirements (such as captive and foreign reinsurers).
In principle, these changes increase both assets and liabilities of the insurance sectors, but have no effect on their equity. In practice, as of year-end 2017 they have a modest negative effect on insurance equity of $37 billion (almost entirely life insurance) due to the less stringent reserve requirements that apply to certain reinsurers. Several other sectors are also affected. The net worth of households and nonprofit organizations grows by $249 billion to reflect the value of policies that were previously missing from the Financial Accounts. Businesses also capture $81 billion from previously missing policies. The rest of the world (ROW) sector loses $130 billion on net because they are the reinsurer for many of the policies that are newly recorded. Note, these effects are net of reallocating certain other financial assets from households to the insurance sectors, and of other outstanding balances between insurers and reinsurers that we now record as trade credit. This note describes these changes and their associated effects in more detail.
Introduction
The insurance industry consists of direct insurers, which sell insurance policies directly to consumers, and reinsurers, which charge a fee to assume the risk of the policies sold by direct insurers.1 Reinsurance is commonly used to share risk across firms and manage capital requirements. Importantly, while purchasing reinsurance indemnifies the direct insurer, it does not remove their legal obligation to pay policyholders when claims occur. Therefore, the financial condition, and potentially the solvency of an insurer relies upon the ability of its reinsurers to meet their obligations. Further, a reinsurer can cede the policies it assumes to another reinsurer ("retrocession"), creating chain of interdependence.
Before the 2018:Q2 release, the Financial Accounts of the United States (Financial Accounts) only reported insurers' net liability to policyholders, and did not explicitly account for reinsurance transactions among insurers. Beginning with the 2018:Q2 release, the Financial Accounts incorporates reinsurance transactions between U.S. direct insurers and both domestic and foreign reinsurers. The new treatment of reinsurance will allow users of the Financial Accounts to study how insurers depend upon each other through reinsurance, both within the United States and across borders. It is also consistent with the guidance for representing reinsurance that has been set forth in the System of National Accounts (SNA). In addition, this new treatment allows us to correct a substantial undercounting of insurance liabilities and a misallocation of other financial instruments that occurred because U.S. insurers often use reinsurers in jurisdictions with limited disclosure requirements.2 The remainder of this FEDS note describes updates to the Financial Accounts to document these transactions.
Data Sources
The primary data sources for the insurance sector in the Financial Accounts are insurers' regulatory filings submitted to state insurance regulators and compiled by the National Association of Insurance Commissioners (NAIC). We access them through S&P Global Market Intelligence. Most of insurers' liabilities are obligations for future payments to policyholders. In the Financial Accounts, these are called life insurance reserves, pension entitlements (reserves for annuities), accident and health insurance reserves, and policy payables (reserves for property and casualty policies). The amounts insurers report on their regulatory balance sheets are net of reinsurance, which means that the liability is only held by the ultimate reinsurer of policy, as opposed to also being recorded by the direct insurer or any intermediate reinsurers. Thus, total obligations to policyholders can be calculated by summing those reported by individual firms (except in certain cases discussed below). However, this approach does not allow users of the Financial Accounts to identify insurers' use of reinsurance. Starting with the 2018:Q2 release, we now utilize detailed data on reinsurance transactions from Schedule S (life insurance) and Schedule F (property and casualty insurance) to appropriately record these transactions. The data include the degree to which reported policyholder liabilities have been affected by reinsurance ("reserve credit"), as well as other balances owed between the direct insurer and reinsurer. The data in the Financial Accounts are available beginning in 1999 Q4.3
Summary of Reinsurance Activity
Tables 115 and 116 now show memo items designed to highlight key aspects of reinsurance activity. First, we show the total obligation to U.S. policyholders, calculated as the balance sheet total reported by U.S. insurers, plus amounts ceded to insurers that do not report to the NAIC, less amounts assumed from non-U.S. insurers. Of the total obligation, we then show how much is reinsured with U.S. and non-U.S. reinsurers. Finally, we show the amount assumed by U.S. reinsurers from non-U.S. insurers. We construct each line from a set of subseries to allow users to further break down the data by relationship between the insurer and reinsurer, and by broad class of reinsurance.
Figure 1 uses this data to show a breakdown of the different types of reinsurance used by U.S. life insurers for the policies they sell to U.S. consumers. The foreign affiliated category includes both foreign captives of U.S. insurers, and U.S. insurers with foreign reinsurers that are not captive but do share a parent.4 Overall, life insurers have nearly tripled their use of reinsurance over this period, from 6% of their obligations to U.S. policyholders in 1999 to 16% in 2017. This increase has occurred almost entirely within categories of reinsurance that allow insurers to benefit from less stringent capital and disclosure requirements without transferring risk outside of the organization (U.S. captives and foreign affiliated reinsurers). In 1999, these types accounted for 14% of life reinsurance, but as of 2017 they account for 57%.
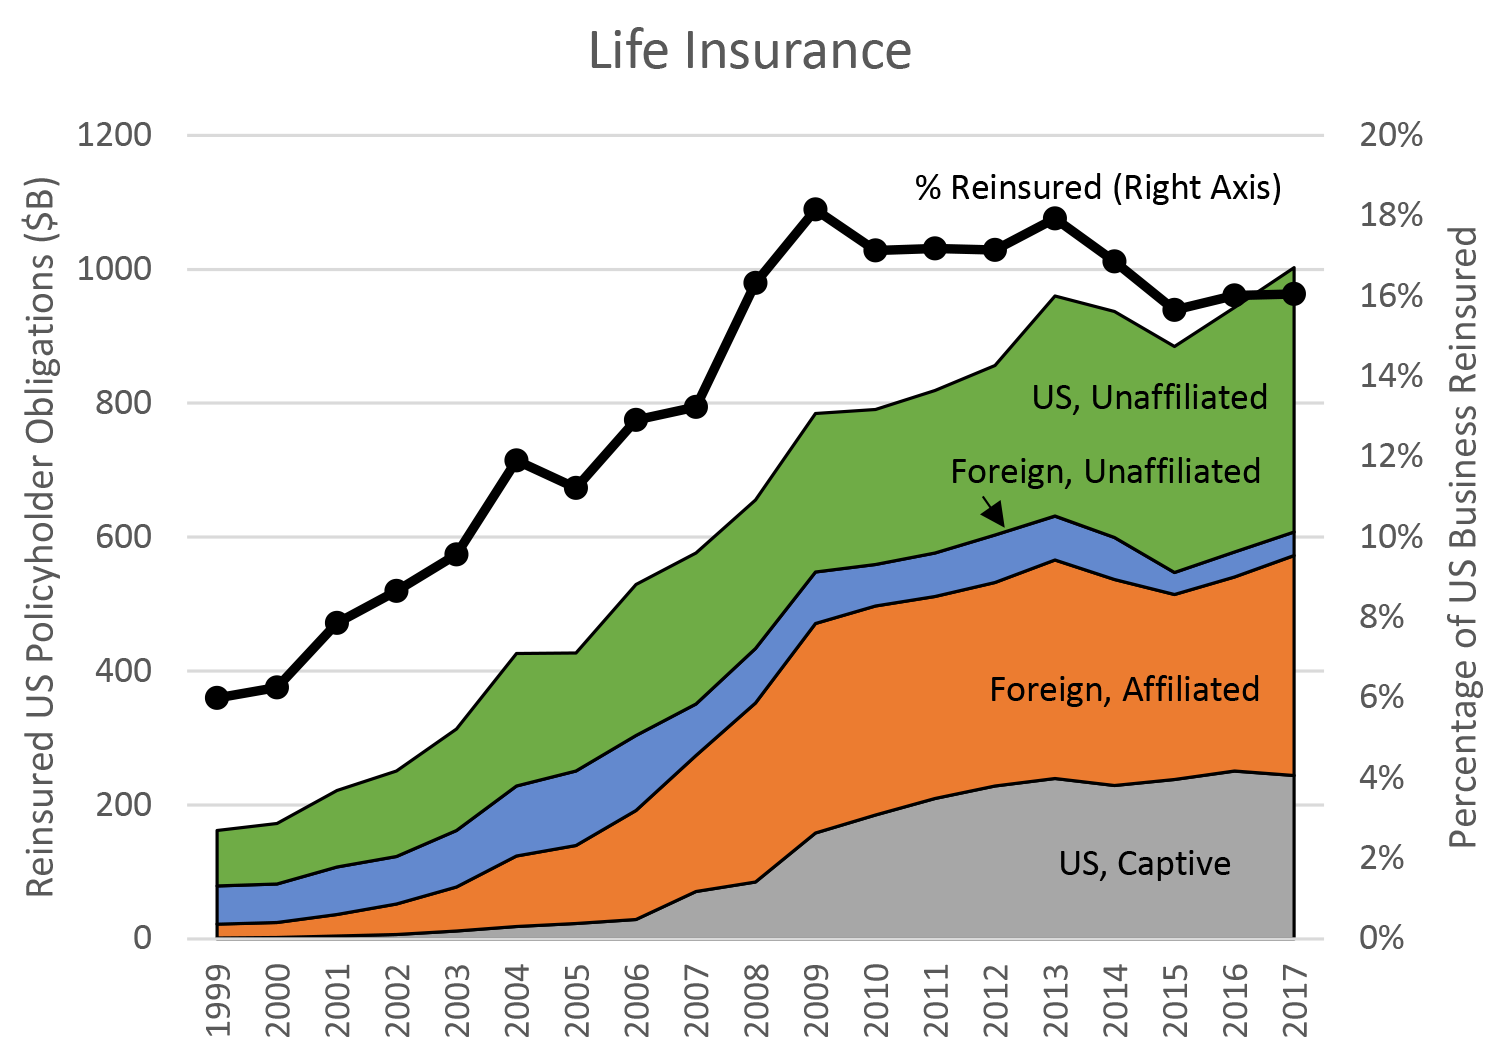
Source: Financial Accounts of the United States.
Figure 2 shows the breakdown for property and casualty insurers. Property and casualty reinsurance initially grew, but then fell after Hurricane Katrina generated large losses which caused some reinsurers to reduce capacity or pull out of the market entirely, and thus prices to increase. In more recent years, property and casualty reinsurance has faced increased competition from alternative forms of risk-sharing such as catastrophe bonds or other insurance-linked securities.5 In a catastrophe bond, a property and casualty insurer issues debt where the principal repayment falls should an indicator related to insurance losses reach a specified trigger.
Like life insurance, property and casualty has also experienced growth in foreign reinsurance. This growth has been concentrated in affiliated companies, which have gone from 16% to 32% of total reinsurance. Still, the fraction of property and casualty reinsurance that does transfer risk across insurance groups remains significantly higher than life reinsurance, at 68% compared to 43%.6
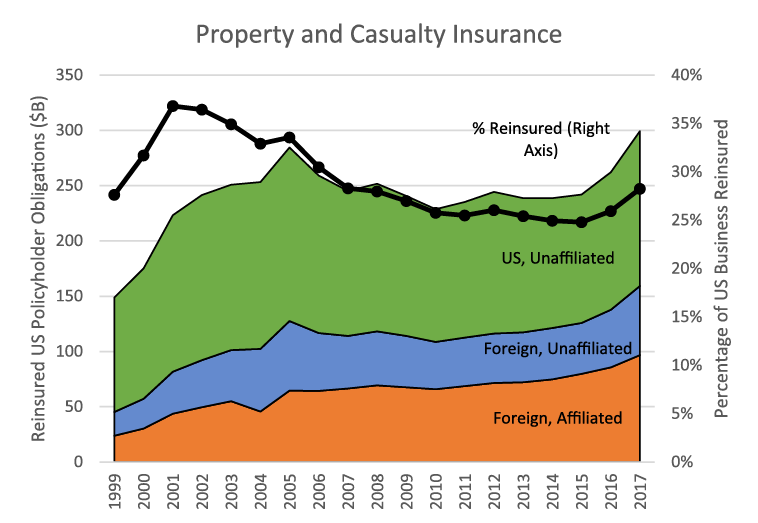
Source: Financial Accounts of the United States.
Reinsurance in the Financial Accounts
In addition to the memo items that focus on reinsurance activity itself, incorporating reinsurance has broad effects across the Financial Accounts. Our guiding principal is to report the insurance sectors' financial assets and liabilities gross of reinsurance. In principle, this means that the direct insurer always maintains a liability for payment on the policy, which in turn is an asset of the policyholder.7 When the direct insurer obtains reinsurance, the reinsurer will also record the liability, and the direct insurer will record a corresponding asset. See Appendix A for a more detailed description of our treatment of several types of reinsurance.
A direct insurer in the U.S. can purchase reinsurance from another U.S. domiciled insurer or from an insurer domiciled outside the U.S. Therefore, reinsurance transactions can occur within one of the two U.S. insurance sectors, or between a U.S. insurance sector and the Rest of the World (ROW). As a result, all three sectors now show insurance reserves on both sides of the balance sheet.8 It is more common for U.S. direct insurers to cede policies to foreign reinsurers, but the reverse does occur. As with other instruments, insurance transactions with the ROW are only reflected in the Financial Accounts to the degree they involve U.S. entities.
We implement these changes through a revised structure of insurance liabilities. Each of the insurance liability series shown on tables 115, 116g, 116s, and 116 is now a sum of the amount reported on insurers' balance sheets (the previously published total) and the amounts ceded to reinsurers. The amounts ceded to reinsurers are split by how the reinsurer is related to the insurer, and whether or not the reinsurer is domiciled in the U.S. Insurers now also hold a corresponding asset for each insurance liability to represent the amount they have reinsured, again broken down by the type of reinsurer. Thus, both assets and liabilities of U.S. insurers have increased to reflect the amount of reinsurance outstanding. The ROW sector now holds insurance liabilities for amounts non-U.S. reinsurers have assumed from U.S. insurers, and insurance assets for the amounts non-U.S. insurers have ceded to U.S. reinsurers.
We also now identify the other balances outstanding between direct insurers and reinsurers. Insurers record receivable assets for claims they have paid to the policyholder, but on which they are waiting for reimbursement from the reinsurer. In addition, rather than passing premiums from the policyholder to the reinsurer, insurers sometimes invest the funds themselves and record an IOU liability to the reinsurer ("funds withheld"). We have included these amounts as appropriate in the trade payable and trade receivable instruments of the insurance and ROW sectors.
Note, insurers can use reinsurance to transfer liabilities and manage capital across different operating insurance entities within the same insurance group. These transactions leave the overall risk profile of the insurance group unchanged. In the Financial Accounts, we capture reinsurance transactions that are across group or across border, leaving the transactions that are both within-group and within the U.S. reported net of reinsurance.9 This reflects our goal of portraying how different organizations are interdependent, and is consistent with our approach for other instruments such as cross-ownership of equity within a group.
Insurance Policies Previously Missing from the Financial Accounts
When the direct insurer and reinsurer are both domiciled in the U.S., and both file public regulatory financial statements, the net liability to policyholders is unaffected by reinsurance. The assets and liabilities that are transferred from the direct insurer are accounted for on the balance sheet of the reinsurer. However, failure to account for certain types of reinsurance has resulted in an undercounting of insurance assets held by U.S. policyholders, and an over counting of other financial assets held by U.S. households. U.S. insurers often find it advantageous to purchase reinsurance from firms that either are not regulated by the states (non-U.S. firms), or for whom financial statements are kept confidential by the insurance department of the state of domicile (U.S. captive reinsurers).10 The primary benefits are looser capital requirements11 and favorable tax treatment.12 Due to their opaque nature and failure to transfer risk, captive reinsurers (both U.S. and foreign) are sometimes called "shadow insurance" in academia13 and the press.14 Our slightly more broad definition of "non-NAIC reinsurance" also includes two other types that are missing from our NAIC data universe: 1) foreign reinsurers that are not affiliated with the U.S. direct insurer; 2) U.S. residual market entities, which are public or quasi-public organizations created by states to either subsidize various segments of their property and casualty insurance markets, or allow firms that operate within them to pool risk.15 Prominent examples of residual market entities are the Florida Hurricane Catastrophe Fund, which was created to backstop the exposure of private firms after large losses in 1992 and the early 2000s, and the Michigan Catastrophic Claims Association, which reinsures risk from the state's mandated unlimited medical liability for auto claims.
Figure 3 shows how U.S. insurers have increased their use of non-NAIC reinsurance since 1999. The total is nearly $600 billion as of YE 2017, compared to less than $100 billion at the start of the period. In fact, non-NAIC reinsurance is now responsible for 58% of the increase in insurer liabilities when reporting them gross of reinsurance rather than net, compared to 38% in 1999. The pronounced increase from life insurers has been driven by their use of shadow insurance to blunt the impact of more stringent reserve requirements adopted at various points starting in the year 2000.16 Specifically, shadow insurance now accounts for nearly $340 billion of the $360 billion in non-NAIC life reinsurance.
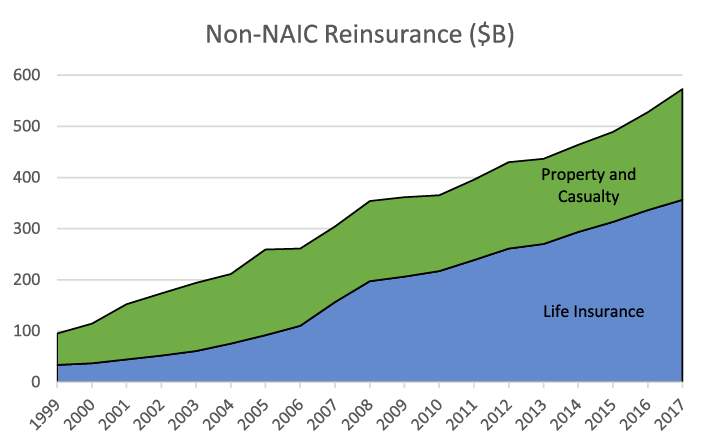
Note: Reserve credit taken for business ceded to captive reinsurers, non-U.S. reinsurers, and residual market entities.
Source: Financial Accounts of the United States.
These transactions are problematic for the Financial Accounts because the liabilities that disappear from the balance sheets of the U.S. insurers do not reappear on the balance sheets of other entities covered by our insurance data, leaving total obligations to policyholders undercounted. Further, the entire balance sheets of U.S. captive insurers and residual market entities are hidden, so the financial investments they make using the fees paid by direct insurers are incorrectly allocated to the residual household sector. Note that although we continue to report transactions with U.S. captives net of reinsurance, incorporating them still affects the Financial Accounts because it corrects these issues. While the totals are shown on the tables, we now break down insurers' holdings of each financial instrument into those held by insurers that report to the NAIC, and those that do not (captives for life insurance, residual market for property and casualty).17
Summary of Effects
Transitioning from net to gross accounting for reinsurance has a substantial and growing effect on policyholder obligations. As shown in Figure 4 Panel A, it increases policyholder liabilities of the two U.S. insurance sectors by over $1 trillion as of the end 2017, $668 billion of which is from life insurance, and the remaining $357 billion is from property and casualty. This increase includes the $573 billion in non-NAIC reinsurance shown in Figure 3, plus an additional $447 billion in reinsurance from US insurers to US reinsurers that do report financial statements to the NAIC. Total policyholder obligations for the US insurance sectors increase by nearly 17% as of 2017, compared 9% at the beginning of our reinsurance data sample in 1999. These increases in insurance liabilities are largely offset by the increases in insurance assets that represent expected reimbursements from both domestic and foreign reinsurers, and financial assets held by U.S. captive reinsurers and residual market entities. The net effect for life insurance is negative $36 billion, which is our estimate of the capital relief from using U.S. captive reinsurers. There is essentially no net effect for property and casualty insurers. This produces an increase in financial leverage (which we define as financial assets divided by the difference between financial assets and liabilities) from 12.1 to 14 for life insurance, and from 2.6 to 3 for property and casualty.
Note, the difference between the $668 billion increase in life insurance policyholder obligations shown here and the $1,002 billion in life reinsurance described in Figure 1 is $334 billion is modified coinsurance.18 We exclude modified coinsurance from the main table because the direct insurer still owns the assets and liabilities, but we include it in the memo items to provide a more complete picture of interdependence. For property and casualty, the difference between the $357 billion increase in policyholder obligations and the $299 billion of property and casualty reinsurance shown in Figure 2 is the $58 in residual market reinsurance. This amount is counted twice in the former total (once each on the balance sheets of the insurer and reinsurer where neither were captured in our prior treatment), but only once for the breakdown of reinsurance.
Panel B shows the new total insurance assets and liabilities of the ROW sector (both were zero under net reinsurance accounting). U.S. reliance on foreign reinsurance has grown rapidly, from $78 billion in 1999 to $296 billion in 2017. Reinsurance in the opposite direction remains less common, but has also grown quickly. When we also account for trade credit with the U.S. insurance sectors, the equity of the ROW falls by $132 billion on net.
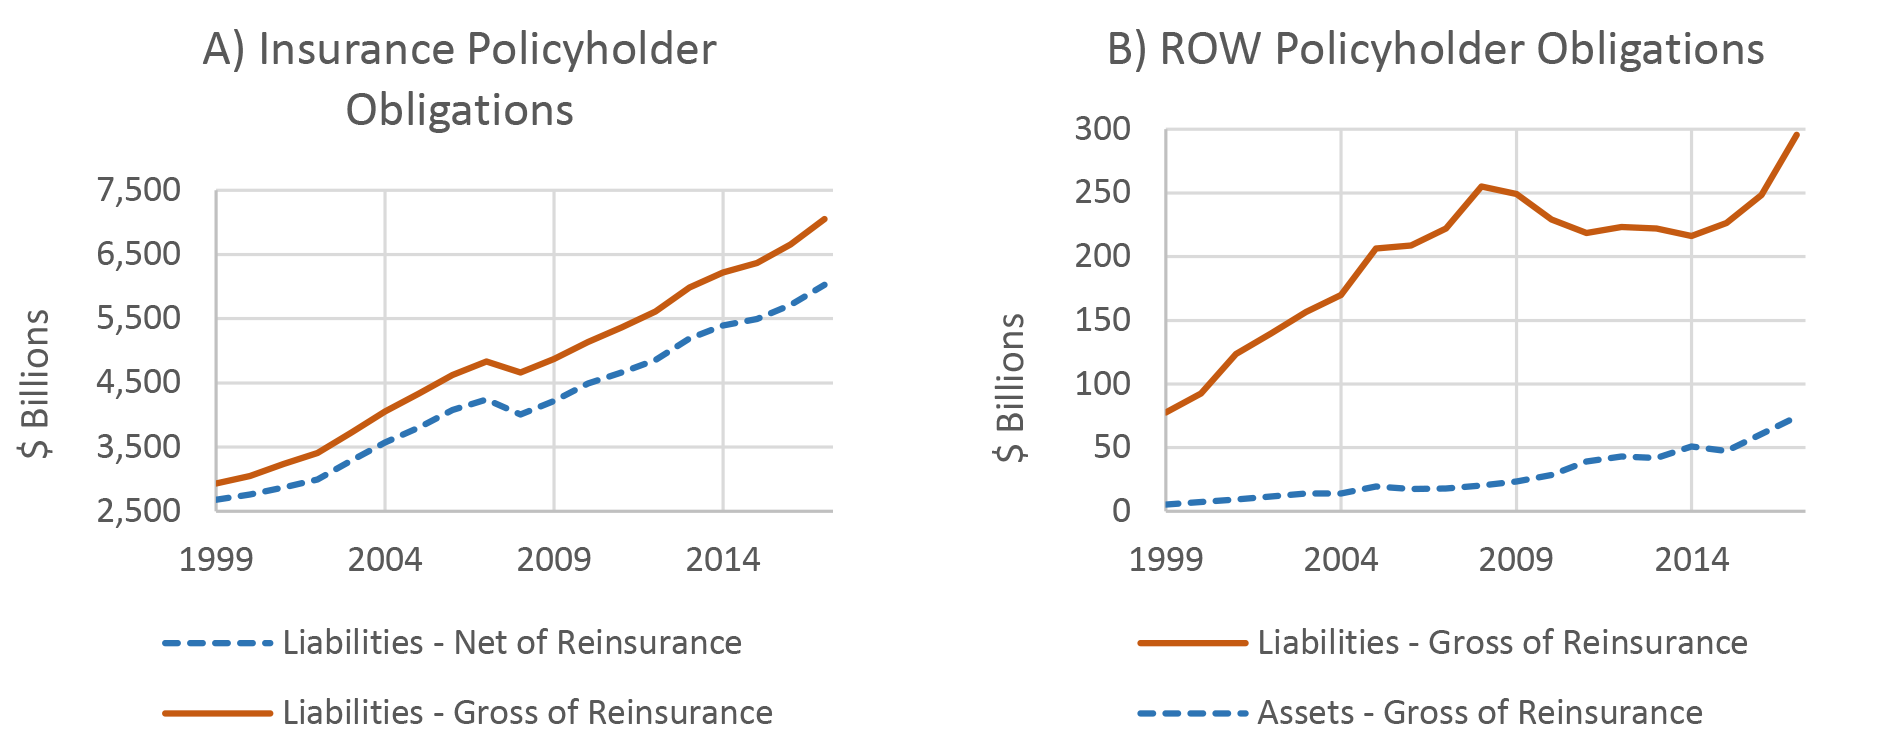
Policyholder obligations include life insurance reserve, pension entitlements, accident and health insurance reserves, and policy payables. Panel A shows liabilities for the combined life and property and casualty insurance sectors before and after incorporating reinsurance. Panel B shows assets and liabilities of the ROW sector after reinsurance (both were zero before reinsurance). Source: Financial Accounts of the United States.
If it weren't for non-NAIC reinsurance, transitioning to gross reinsurance reporting would only affect the balance sheets of direct insurers and reinsurers. Instead, incorporating non-NAIC also results in substantial effects for policyholders. The primary policyholders are households and nonprofit organizations. As of 2017:Q4, their household holdings of insurance assets are $417 billion higher, and holdings of other financial assets are $168 billion lower, producing a net increase of $249 billion in household net worth. Figure 3 shows the effects on household insurance assets, other financial assets, and net worth from 1999 through 2017. These effects have grown rapidly over the period, largely due to the growth in life insurers' use of shadow insurance, and to a lesser degree by the increase in property and casualty insurers' use of foreign reinsurance and residual market entities.
Figure 5: Changes in Household Holdings of Policyholder Obligations and Other Financial Assets due to incorporating non-NAIC Reinsurance into the Financial Accounts
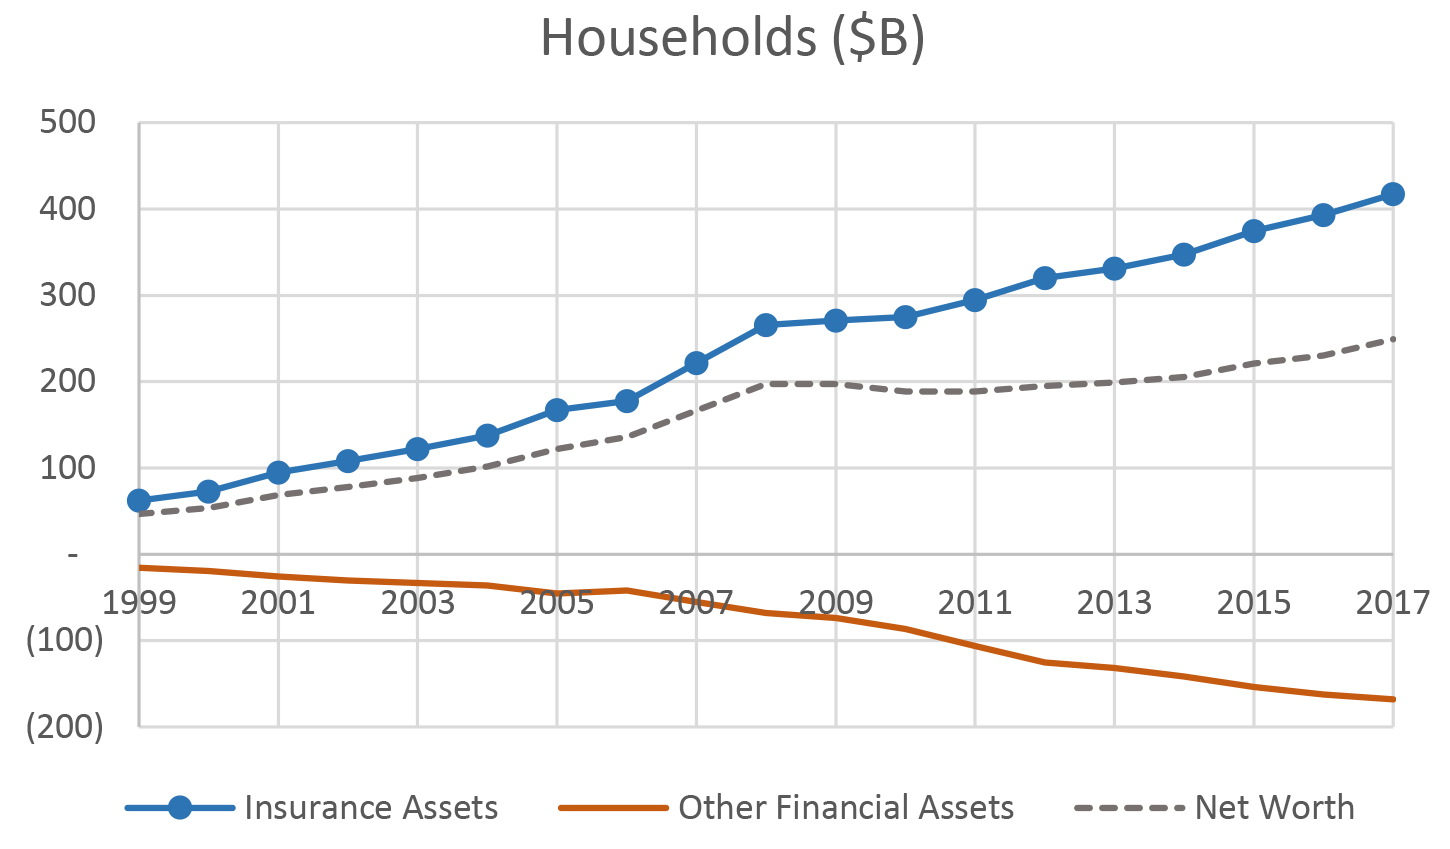
Source: Financial Accounts of the United States.
Holdings of insurance assets by the corporate nonfinancial and non-corporate nonfinancial sectors also increase by $66 and $16 billion, but their holdings of other financial assets are not affected because they are not calculated residually.19 These effects have also grown over time, but more slowly than those of households because they are only due to property and casualty insurance.
Detailed breakdowns of the changes to total assets and liabilities for each sector are shown in Appendix B, and graphs similar to Figure 5 showing the net effects for each remaining sector over time are shown in Appendix C.
Effects of the Tax Cuts and Jobs Act on Foreign Reinsurance
As expected, initial reports indicate that the Tax Cuts and Jobs Act is causing U.S. insurers to decrease their use of foreign reinsurance. Specifically, the base erosion and anti-abuse tax (BEAT) provision is designed to eliminate profit shifting from the U.S. to other jurisdictions. It imposes an additional tax on payments from U.S. firms to their related foreign entities, which in addition to the lowered U.S. corporate tax rate, reduces or eliminates the tax advantage of foreign reinsurers. Anecdotal evidence suggests insurers are responding in a variety of ways, such as reducing the use of reinsurance, replacing foreign affiliated reinsurance with U.S. captives or foreign reinsurers that are not related, or by electing for their foreign affiliates to pay taxes as if they were U.S. firms.20 Insurers disclose their reinsurance relationships in their year-end regulatory filing, and thus we are not yet able to observe how tax reform has influenced their use of reinsurance. In between annual filings, we produce quarterly estimates by assuming the reinsured balances move in proportion to the most closely related insurance balances that are reported quarterly. While this method typically produces reasonable preliminary estimates, we expect material revisions once the year-end filing are available.21 Thus, we quote effects as of 2017:Q4 throughout this document.
Conclusion
By accounting for reinsurance, we capture nearly $600 billion of policyholder liabilities that were previously missing from the Financial Accounts, and describe $1.3 trillion in reinsurance relationships that were previously unobservable. This helps us provide a more accurate measure of household balance sheets, and sheds light on the evolution of the insurance industry in response to changing economic and regulatory environments.
Appendix A: Accounting Treatment Details by Type of Reinsurance
This appendix provides basic descriptions of the different types of reinsurance and additional details about how we record them in the Financial Accounts.
Coinsurance and Yearly Renewable Term (YRT)
Direct insurers pass the premiums from policyholders to the reinsurer (less a commission for originating the business called a "reinsurance allowance"), the reinsurer invests these funds as they see fit, and the liability for future payment on the policy transfers from the direct insurer ("reserve credit") to the reinsurer ("reserves assumed"). The arrangement can cover the entire policy, or a percentage of the policy, in which case the above transfers will be proportional. Coinsurance is intended to last for the life of the policy (most likely the arrangement covers a block of business sold over a period of time), while YRT is revisited annually.
To report these transactions gross of reinsurance in the Financial Accounts, we add the insurance reserve liability back to the balance sheet of the direct insurer, and also give them an offsetting insurance reserve asset. For transactions between U.S. firms, this means that the liability for the same policy will appear twice as a liability of the insurance sector, and once each as an asset of the insurance sector and of the policyholder.
Coinsurance with Funds Withheld
The treatment of the insurance reserve is the same as above, but instead of passing the premium from the direct insurer to the reinsurer, the direct insurer invests the funds and reports a "funds withheld" liability for the amount they would have paid (and the reinsurer reports a corresponding asset). Previously, these assets and liabilities were included in the miscellaneous categories in the Financial Accounts. We now include them as part of the new trade payable and trade receivable series for the insurance sectors, and the existing trade payable and receivable series of the ROW (the other component of the insurance payable and receivable series are the amounts owed for claims that have already been paid by the direct insurer but not yet reimbursed by the reinsurer).
Modified Coinsurance
Rather than transferring the liability from the direct insurer to the reinsurer, the reinsurer funds the insurance reserve that is held on the balance sheet of the direct insurer. This is often combined with funds withheld in order to minimize the payments between the parties. In this case, only periodic net payment will be made in either direction to reflect the degree to which investment returns and policy experience differed from that assumed in reinsurance pricing. Although modified coinsurance transfers risks from the direct insurer to the reinsurer in ways similar to coinsurance, we do not explicitly adjust the insurance reserves in the main tables to account for modified coinsurance. This is because the insurance reserve remains on the books of the direct insurer, and after each periodic payment is made, there is no net liability for the reinsurer. Still, there is potential for a liability to develop if investment or policy experience deviate from expectations, and thus we still believe it is important to identify these transactions in the memo items.
Appendix B: Detailed Effects by Sector as of 2017:Q4
The table below summarizes the effects of incorporating reinsurance by sector as of 2017:Q4 ($Millions).
| Life General Account | Assets | Insurance reserves ceded to foreign reinsurers | 136,295 |
|---|---|---|---|
| Insurance reserves ceded to U.S. unaffiliated reinsurers | 311,420 | ||
| Invested assets of U.S. captive reinsurers | 111,745 | ||
| Funds withheld from U.S. captive reinsurers | 77,196 | ||
| Total | 636,656 | ||
| Liabilities | Insurance reserves ceded to foreign reinsurers | 136,295 | |
| Insurance reserves ceded to U.S. captive reinsurers | 219,850 | ||
| Insurance reserves ceded to U.S. unaffiliated reinsurers | 311,420 | ||
| Receivable for claims from U.S. captive reinsurers | 5,679 | ||
| Total | 673,244 | ||
| Net Effect | Total Assets - Total Liabilities | (36,588) | |
| Life Separate Account | Assets | Insurance reserves ceded to foreign reinsurers | 2 |
| Insurance reserves ceded to U.S. unaffiliated reinsurers | 58 | ||
| Funds withheld from U.S. captive reinsurers | - | ||
| Total | 60 | ||
| Liabilities | Insurance reserves ceded to foreign reinsurers | 2 | |
| Insurance reserves ceded to U.S. captive reinsurers | - | ||
| Insurance reserves ceded to U.S. unaffiliated reinsurers | 58 | ||
| Receivable for claims from U.S. captive reinsurers | - | ||
| Total | 60 | ||
| Net Effect | Total Assets - Total Liabilities | - | |
| Property and Casualty | Assets | Invested assets of residual market reinsurers | 56,252 |
| Funds withheld from residual market reinsurers | 633 | ||
| Payable to residual market reinsurers | 2,195 | ||
| Insurance reserves ceded to residual market reinsurers | 57,282 | ||
| Insurance reserves ceded to foreign reinsurers | 159,275 | ||
| Insurance reserves ceded to U.S. unaffiliated reinsurers | 82,804 | ||
| Total | 358,441 | ||
| Liabilities | Receivable for claims from residual market reinsurers | 1,804 | |
| Insurance reserves ceded to residual market reinsurers | 57,282 | ||
| Insurance reserves ceded to residual market reinsurers | 57,282 | ||
| Insurance reserves ceded to foreign reinsurers | 159,275 | ||
| Insurance reserves ceded to U.S. unaffiliated reinsurers | 82,804 | ||
| Total | 358,447 | ||
| Net Effect | Total Assets - Total Liabilities | (6) | |
| Rest of the World | Assets | PC funds withheld from non-U.S. reinsurers | 23,869 |
| Life funds withheld from non-U.S. reinsurers | 78,242 | ||
| PC payable to non-U.S. reinsurers | 14,390 | ||
| PC reserve credit assumed by U.S. reinsurers from non-U.S. | 50,131 | ||
| Life reserve credit assumed by U.S. reinsurers from non-U.S. | 24,041 | ||
| Total | 190,673 | ||
| Liabilities | PC reserves ceded to foreign reinsurers | 159,275 | |
| Life insurance reserves ceded to foreign reinsurers | 136,297 | ||
| Recoverable for PC claims | 16,305 | ||
| Recoverable for Life claims | 9,274 | ||
| Total | 321,151 | ||
| Net Effect | Total Assets - Total Liabilities | (130,478) | |
| Households | Assets | PC reserves ceded to foreign reinsurers | 81,390 |
| PC reserves ceded to residual market reinsurers | 29,271 | ||
| Life reserves ceded to foreign reinsurers | 136,297 | ||
| Life insurance reserves ceded to U.S. captive reinsurers | 219,850 | ||
| Subtract: Life reserve credit assumed by U.S. reinsurers from non-U.S. | 24,041 | ||
| Subtract: PC reserve credit assumed by U.S. reinsurers from non-U.S. | 25,617 | ||
| Subtract: Invested assets of U.S. captive reinsurers | 111,745 | ||
| Subtract: Invested assets of U.S. residual market reinsurers | 56,252 | ||
| Total | 249,153 | ||
| Nonfinancial Corporate | Assets | PC reserves ceded to foreign reinsurers | 62,914 |
| PC Reserves ceded to residual market reinsurers | 22,626 | ||
| Subtract: PC reserve credit assumed by U.S. reinsurers from non-U.S. | 19,802 | ||
| Total | 65,738 | ||
| Nonfinancial Noncorporate | Assets | PC reserves ceded to foreign reinsurers | 14,972 |
| PC Reserves ceded to residual market reinsurers | 5,385 | ||
| Subtract: PC reserve credit assumed by U.S. reinsurers from non-U.S. | 4,712 | ||
| Total | 15,644 |
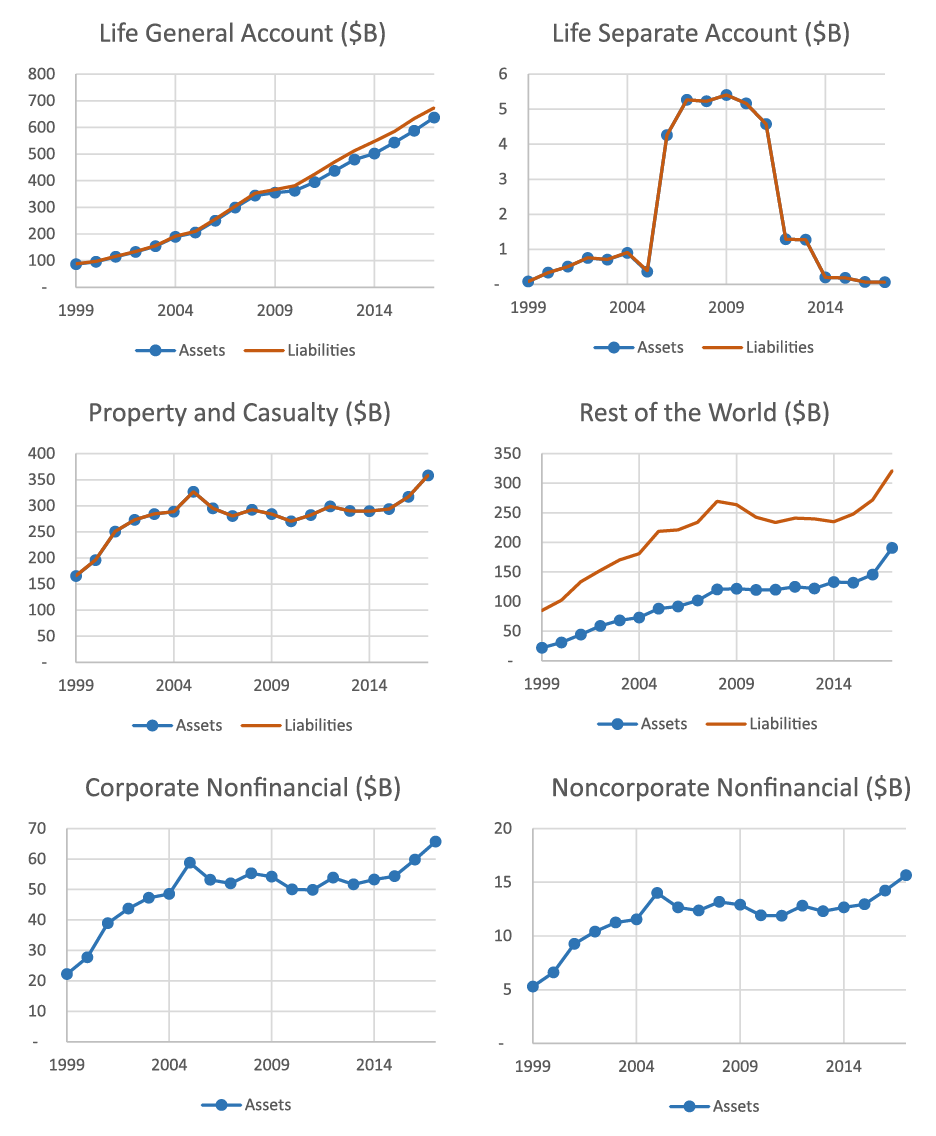
Appendix C: Total Effects by Sector over Time
The charts below show the total changes in assets and liabilities for each sector (excluding households, which are shown in Figure 3) as of Q4 from 1999 through 2017 ($Billions).
1. While many firms specialize in either direct sales or reinsurance, it is common for an insurer to engage in both activities. Thus, the terms direct insurer and reinsurer are most applicable when referring to particular policies, or groups of policies, as opposed to when referring to different firms. Return to text
2. These include US captives, non-US reinsurers, and US property and casualty residual market entities. Return to text
3. Schedules S and F are reported in the annual regulatory filing. We convert the annual data to quarterly estimates based upon the most closely related balances that are reported by insurers quarterly. Between 2006 and 2013 schedule S became increasingly detailed in the types of reinsurers that can be distinguished. For the years before a given piece of information is available we have estimated the reinsurer type breakdown using data from subsequent years. For example, the same insurer-reinsurer pairs are observed in different years, and we use the classification of their relationship reported in later years. A small amount of data is imputed through other means. Return to text
4. Reinsurance does occur between affiliated U.S. insurers where neither is a captive of the other, but we do not include these transactions in the memo items or the main table because both firms are subject to the same capital requirements, and the risk remains within the same insurance group. However, we do provide supplementary data series with this information. Return to text
5. Catastrophe bonds and other insurance-linked securities are not captured in the Financial Accounts. Return to text
6. Property and casualty insurers do not use captive reinsurance in the same way that life insurers do. Instead of being subsidiaries of insurance companies, captive property and casualty insurers are subsidiaries of non-insurance companies, and act as a form of self-insurance. These captive insurers are not captured in the Financial Accounts. We estimate they represent approximately one percent of the U.S. property and casualty market. Return to text
7. Policyholders are households, pension funds, US depository institutions, and holding companies for life insurance and annuities, households and corporations for property and casualty insurance, and households for accident and health insurance. Return to text
8. Life insurance reserves and pension entitlements are shown as separate line items for life insurance, while accident and health insurance reserves are included in miscellaneous assets and liabilities. Policy payables are identified miscellaneous assets and liabilities for property and casualty insurers. Return to text
9. Data series showing within-group within-US reinsurance transactions are available for download. Return to text
10. Captive reinsurers are wholly owned subsidiaries that exist solely to reinsure business sold by their parent insurance company. Increasingly, US state insurance commissioners have granted insurers permission to create captive reinsurers that operate under lower reserve requirements in their own jurisdictions. Return to text
11. For example, many industry participants believe that US reserve requirements for certain life insurance products are overly conservative, while those that govern US captive reinsurers and non-US insurers are less stringent. The most frequently referenced products and regulations are term life insurance and universal life with secondary guarantees (regulations XXX and AXXX), and variable annuities with embedded options (AG 43 and RBC C-3 Phase II). To mitigate the impact of these regulations, US insurers can reinsure policies to jurisdictions that require lower reserves. Technically, ceding US insurers are only allowed to claim reserve credit for the amount the reserve held by the reinsurer. The reinsurer will hold reserves according to US regulations, allowing the ceding insurer to claim full credit, but is allowed to hold lower cost and quality assets (letter of credit, parental guarantee, etc.) to support the portion of the reserve in excess of that required by their own jurisdiction. After much debate in recent years, in 2016 the NAIC published guidance that specifies an amount much closer to the "economic" reserve that must be backed by high quality assets of the reinsurer in order to claim reserve credit. Return to text
12. Many of the non-US reinsurers are located in tax havens. When the insurer and reinsurer share a parent, the arrangement often allows profits to be transferred from the US to lower tax jurisdictions. If the reinsurer is not affiliated with the insurer, the low tax environment allows for lower cost reinsurance. Return to text
13. Koijen, Ralph SJ, and Motohiro Yogo. "Shadow insurance." Econometrica 84.3 (2016): 1265-1287. Return to text
14. Walsh, Mary W. "Risky Moves in the Game of Life Insurance." New York Times, April 12, 2015: Page BU1 Return to text
15. Salient examples of residual market entities are the Florida Citizens Property Insurance Corporation and the Florida Hurricane Catastrophe Fund. Return to text
16. The future of reinsurance with the primary purpose of circumventing US statutory reserve requirements is unclear. As of 2017, the NAIC is beginning a transition from a formulaic approach to reserving to a principals-based approach (PBA). The goal of PBA is to better align the required reserves with "economic" reserves. Thus, the rational for captive reinsurance may dissipate over time as more new business sold is subject to PBA. However, it remains unclear whether the new rules will eliminate this incentive. Return to text
17. Schedules S and F reveal the liabilities held by reinsurers on behalf of direct insurers, but only document the assets held by reinsurers in support of those assets in certain cases. See https://www.financialresearch.gov/briefs/2016/03/17/captive-insurers/ for a discussion of when such disclosures occur. We use these disclosures, as well as the public financial statements of captive reinsurers in Iowa to impute the amount and types of financial assets held by reinsurers when this information is not available. Return to text
18. Modified coinsurance is economically similar to other forms of reinsurance (claims and investment risk on the policy transfer to the reinsurer), but it is designed to minimize the cash flow between the parties. The direct insurer invests the premiums from the policyholder and maintains the liability for future claims, and a net payment between the direct insurer and reinsurer is made periodically to reflect the degree to which investment and claims experience has differed from that assumed in the reinsurance pricing. Return to text
19. Note, the total increase in insurance assets of US policyholders of $499 billion (417 for households, 66 for nonfinancial corporations, and 16 for non-corporate organizations) is less than the $573 billion in non-NAIC reinsurance because we now also recognize that $74 billion in policyholder obligations on the balance sheets of US insurers have been assumed from foreign firms, and thus are assets of the ROW rather than US policyholders. Return to text
20. In an effort to avoid the BEAT and retain business, Bermuda has allowed its reinsurers to pay taxes as if they are U.S. entities. Return to text
21. In most years, the year-end filings are not available in time for the Q4 release of the Financial Accounts, and thus we incorporate them into our Q4 data for the Q1 release. Return to text
Batty, Mike (2018). "Accounting for Reinsurance Transactions in the Financial Accounts of the United States," FEDS Notes. Washington: Board of Governors of the Federal Reserve System, October 12, 2018, https://doi.org/10.17016/2380-7172.2271.
Disclaimer: FEDS Notes are articles in which Board staff offer their own views and present analysis on a range of topics in economics and finance. These articles are shorter and less technically oriented than FEDS Working Papers and IFDP papers.