FEDS Notes
June 23, 2023
Accumulated Savings During the Pandemic: An International Comparison with Historical Perspective
Francois de Soyres, Dylan Moore, and Julio Ortiz1
The COVID-19 pandemic gave rise to unprecedented global economic conditions. Due to a mix of government-imposed restrictions and voluntary personal decisions, mobility levels collapsed in March 2020 and subsequently closely tracked the successive waves of the pandemic. To mitigate the health and economic fallout from the COVID-19 pandemic, governments around the world engaged in large fiscal support programs which increased the demand for consumption goods, but production of these goods did not adjust quickly enough to meet the sharp increase in demand. This imbalance between supply and demand across countries contributed to the ongoing inflation outburst (see de Soyres, Santacreu and Young, 2023).
While aggregate demand increased sharply in response to fiscal transfers, households did not spend out of these additional resources according to norms, in part because the consumption of services was impeded by COVID-19-related restrictions. The combination of curtailed spending and resilient household income due to the fiscal support from the government led to a large increase in personal saving rates in many countries around the world. As can be seen in Figure 1, the savings rate increased by a factor of two or more in advanced economies during the pandemic, while changes have been more modest in emerging economies.
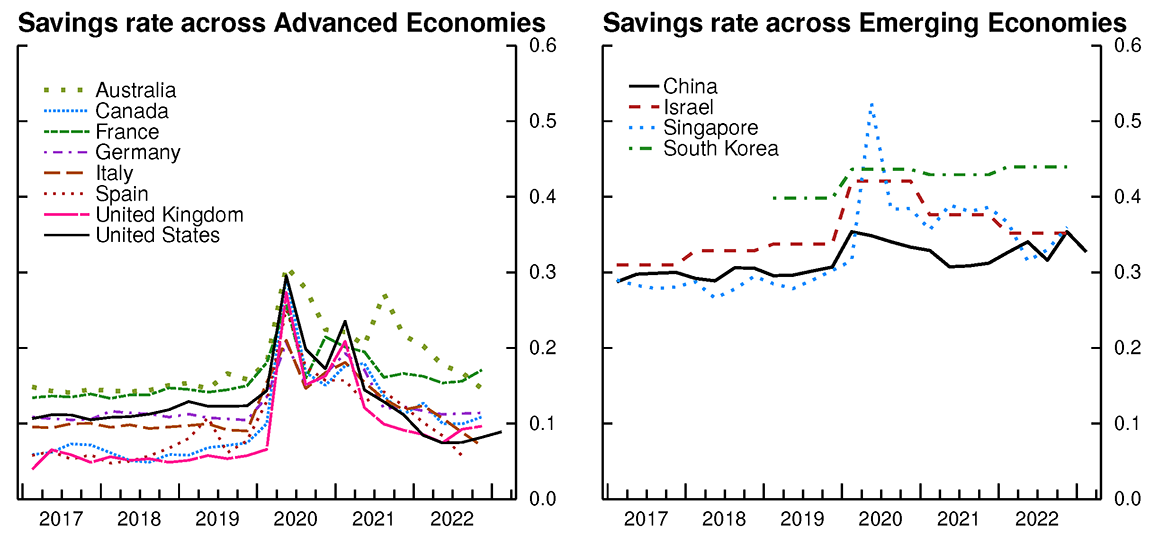
Fig 1a. (Left Figure)
Source: Haver analytics.
Fig 1b. (Right Figure)
Note: Data are annual for Israel and South Korea
Source: Haver analytics.
As households built up an unprecedented stock of savings, an important question going forward revolves around the usage of this stock, and to what extent "excess savings" will continue to fuel spending in the quarters to come. In a context of persistently high core inflation and continued supply-demand imbalances in many countries, it is especially important to assess the pace at which households might be expected to spend their excess savings and continue to maintain a high level of aggregate demand.
In this note, we put the current "excess savings" episode in historical context by examining past recessionary periods. We observe that, while the current juncture is unprecedented, historical experience suggests that the extent to which further drawdowns of excess savings support aggregate demand is likely to be heterogeneous across countries but waning in importance overall.
Quantifying Excess Savings during the COVID-19 pandemic.
We define excess savings as the amount of savings arising from above-trend savings rates.2 For each country, we collect its aggregate savings rate over time and employ the Hamilton (2018) filter to extract a time-varying trend savings rate. The flow of excess savings is defined as:
$$$$ {Flow\ of\ excess\ savings} = (Savings\ rate - Trend\ savings\ rate) * \frac {Disposable\ income}{Nominal\ GDP} * 100 $$$$
and the stock of excess savings is defined as the cumulative sum of these flows during a given episode.3 By construction, the stock of excess savings keeps growing as long as the flow of excess savings is positive (i.e., household savings rate is above its trend), while it starts to decrease when the flow of excess savings becomes negative (i.e., household savings rate drops below its trend).4
In Figure 2, we present our estimates for the accumulated stock of excess savings. Broadly speaking, advanced economies have followed a similar hump-shaped path so far, with a large increase in excess savings in 2020 and parts of 2021, followed by a decrease in the stock of excess savings which reflects a period of below-trend savings rates as households use their accumulated buffer to fuel consumption. That said, we note that the United States' path differs slightly from other countries, as its stock of excess savings increased more rapidly, peaking in 2021Q3, and then decreased more quickly. As a result, its excess savings stock, at least computed according to our method, is currently completely depleted, which contrasts with other advanced economies where households still hold a buffer of excess savings of about 3 to 5 percent of GDP.5 Given the more rapid drawdown of excess savings, aggregate demand in the United States is likely to have been supported more than in other countries over the past year.
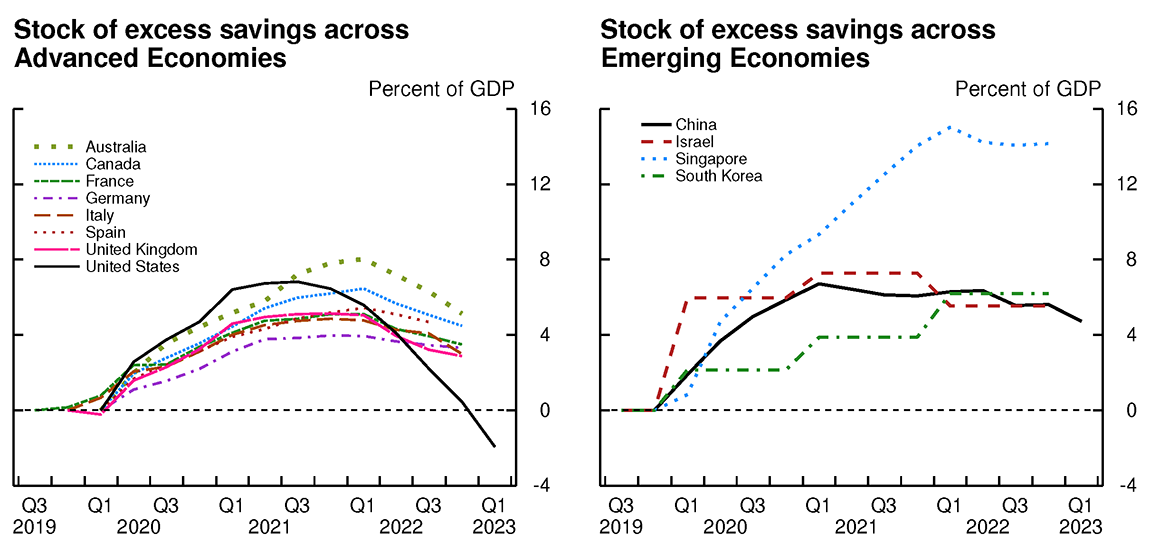
Fig 2a. (Left Figure)
Note: Stock begins accumulating from 0 at t=-1, where t=0 is the fist period of low growth due to COVID-19. Excess savings are calculated as deviation from the predicted savings rate using a Hamilton trend.
Source: Haver Analytics; authors' calculations.
Fig 2b. (Right Figure)
Note: Data is annual for Israel and South Korea. Stock begins accumulating from 0 at t=-1, where t=0 is the fist period of low growth due to COVID-19. Excess savings are calculated as deviation from the predicted savings rate using a Hamilton trend, except for South Korea where it is calculated as deviation from the 2019 rate due to data availability.
Source: Haver Analytics; authors' calculations.
The evolution of the excess savings stock is more heterogeneous in emerging economies. Most countries saw a significant accumulation in the past three years, but the size of the increase differs importantly from country to country. Additionally, whereas advanced economies all follow a hump-shaped path, the trajectories are also more varied for emerging economies. However, as these countries feature more volatile savings rates even before the pandemic, the estimates of excess savings should be considered with greater caution because deviations from the trend savings rate are more frequent even outside of recessionary episodes.
Historical perspective on recessions and excess savings.
To extract further insights about the evolution of excess savings, we look to history as a guide and examine 34 episodes spanning nine advanced economies and 29 episodes spanning six emerging economies.
For each advanced economy, we define a recession as two or more consecutive quarters of negative growth. To ensure that we do not have overlapping recessions within our observation window, we remove any recessions that begin within five years of a preceding recession. We then inspect each of these remaining episodes and define an "excess savings" recession as a recession during which the aggregate savings rate rises by more than the cross-country unconditional median savings rate. Table 1 breaks these episodes down into: (i) non "excess savings" episodes, (ii) "excess savings" episodes besides COVID-19, (iii) and COVID-19, and summarizes the severity of the recession and the increase in excess savings.
Table 1: Recession Episodes in Advanced Economies
| Non "excess savings" episodes | Non-COVID-19 "excess savings" episodes | COVID-19 episodes | |
|---|---|---|---|
| Number of episodes | 18 | 7 | 9 |
| Average peak-to-trough decline in GDP growth | -2.56% | -4.70% | -14.42% |
| Average of excess savings stock (relative to GDP) | 0.77% | 1.99% | 3.45% |
Note: Advanced economies in sample are: Australia, Canada, Germany, France, Italy, Japan, Spain, UK, and US.
Sample period: 1970 to 2023.
As can be seen in the table, in our sample of 25 pre-COVID-19 recessions, only about 30 percent were accompanied by excess savings. On average, these excess savings episodes feature larger peak-to-trough GDP contractions and have an average stock of accumulated excess savings of about 2 percent of GDP. In comparison, the peak-to-trough contraction during the COVID-19 episode was much larger, reaching almost 15 percent on average in advanced economies, while the stock of excess savings averaged about 3.5 percent.
GDP growth is typically higher, on average, and more volatile in emerging economies, which led us to adapt our definition of a recession. In particular, we define a recession in emerging economies as one or more quarters of negative growth. As with the advanced economies, we remove any recessions that begin within five years of the preceding recession to avoid overlapping observation windows. For each country and recession, we define an "excess savings" episode as a recession during which the aggregate savings rate rises by more than the country-specific unconditional median savings rate. Table 2 breaks these episodes down to again summarize the magnitudes of these recessionary and high saving episodes.
Table 2: Recession Episodes in Emerging Economies
| Non "excess savings" episodes | Non-COVID-19 "excess savings" episodes | COVID-19 episodes | |
|---|---|---|---|
| Number of episodes | 11 | 12 | 6 |
| Average peak-to-trough decline in GDP growth | -2.07% | -2.68% | -8.30% |
| Average of excess savings stock (relative to GDP) | -2.11% | 0.03% | 4.66% |
Note: Emerging markets in sample: China, Israel, Singapore, South Korea, Taiwan, Thailand.
Sample Period: 1970 to 2023.
Our results show that, unlike in advanced economies, emerging economies generally do not accumulate a significantly positive stock of excess savings during recessions. As a matter of fact, when conditioning on episodes deemed to be associated with excess savings according to our methodology, the average accumulated stock of excess savings is about 0 percent of GDP, as small positive accumulated stocks of savings are quickly followed by periods of small negative stocks. The fact that emerging market economies do not tend to accumulate a buffer of savings during deep recessionary episodes like the advanced economies may in part be due to consumers there facing more stringent liquidity constraints. That said, the COVID-19 episode shows a very different pattern, in which emerging economies behaved more like advanced economies: a deep recession was associated with a large accumulated stock of excess savings.
How does the current episode compare to historical precedents?
Equipped with a set of historical episodes, we proceed to comparing the COVID-19 recession to past excess savings recessions. Figure 3 presents our results for the United States, advanced foreign economies (AFEs), and emerging market economies (EMEs).
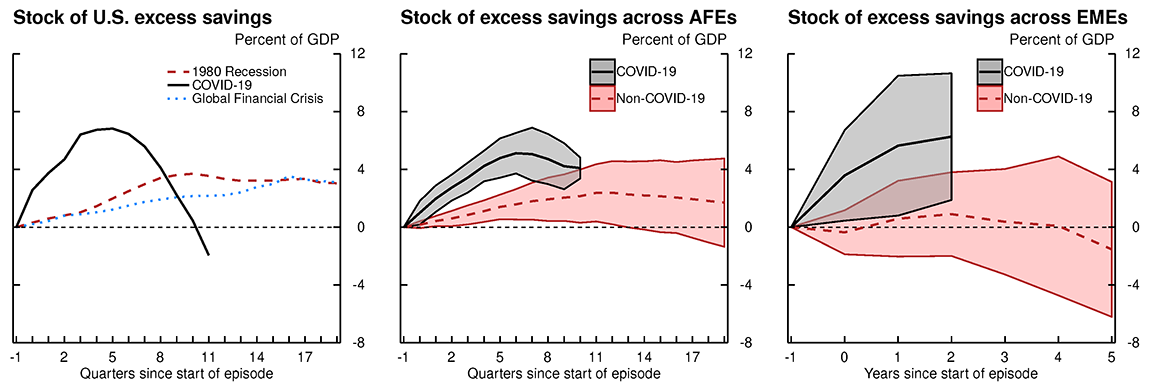
Fig 3a. (Left Figure)
Note: Data are quarterly.
Source: Haver Analytics; authors' calculations.
Fig 3b. (Middle Figure)
Note: Data are quarterly.
Source: Haver Analytics; authors' calculations.
Fig 3c. (Right Figure)
Note: Data are annual. For China, Israel, Singapore, South Korea, and Taiwan, t=0 at 2020. For Thailand, t=0 in 2019.
Source: Haver Analytics; authors' calculations.
In the United States, we uncover two prior recessions, besides COVID-19, during which households accumulated excess savings. The COVID-19 recession was unique in that it featured a remarkable rise in the stock of excess savings based on the methodology we use, peaking at nearly 7 percent of GDP, followed by an equally swift fall. Our results indicate that the stock of excess savings in the United States was depleted in 2023Q1, three years after the onset of COVID-19. On the other hand, the early 1980's recession and the Global Financial Crisis are characterized by a more gradual build up and subsequent rundown in excess savings.
Across the AFEs, stocks of excess savings during COVID-19 evolved as in the United States, with an average peak reaching nearly 6 percent of GDP. Notably, however, the stocks of excess savings evolved more gradually than in the United States, with the average reaching its peak nearly two years after the onset of COVID-19 and standing at close to 4 percent by 2022Q3.
Relative to COVID-19, the non-COVID-19 episodes feature a more gradual evolution in the stock of excess savings for the AFEs, as it does in the United States. The average stock of excess savings during non-COVID-19 AFE episodes reaches its peak about three years after the start of the recession. Based on the shaded areas, however, there is a meaningful amount of heterogeneity across countries.
The stock of excess savings accumulated across EMEs during COVID-19 is similar in size to those of the AFEs, with an average of around 6 percent of GDP. The accumulation of these stocks appears to have decelerated in the EMEs, suggesting that they too might have peaked about two years after the onset of COVID-19. Relative to the AFEs, however, there is greater dispersion in COVID-19-related excess savings across the EMEs. The stock of excess savings during non-COVID-19 episodes hovers around zero percent of GDP for the EMEs.
Implications for the inflation in AFEs.
While the above analysis suggests that excess savings in the United States have been depleted, the AFEs continue to hold a significant stock of excess savings. To understand the extent to which the unwinding of excess savings may continue to support demand and inflation in the AFEs, we estimate simple univariate time series models to project the stocks of AFE excess savings over the next few quarters. For each AFE we regress the flow of excess savings on its lag and a time trend, forecast these flows over four quarters, and construct an implied stock of savings, which gives us an estimate of when we might expect the stock of excess savings to be depleted. Figure 4, which plots these projections, suggests that the average stock of excess savings in the AFEs will continue to support aggregate demand until 2023Q4, at which time it will be depleted. Though the estimated time series models fit the data fairly well, this straightforward exercise assumes no new fiscal policies geared toward supporting real incomes and no change in household savings behavior.
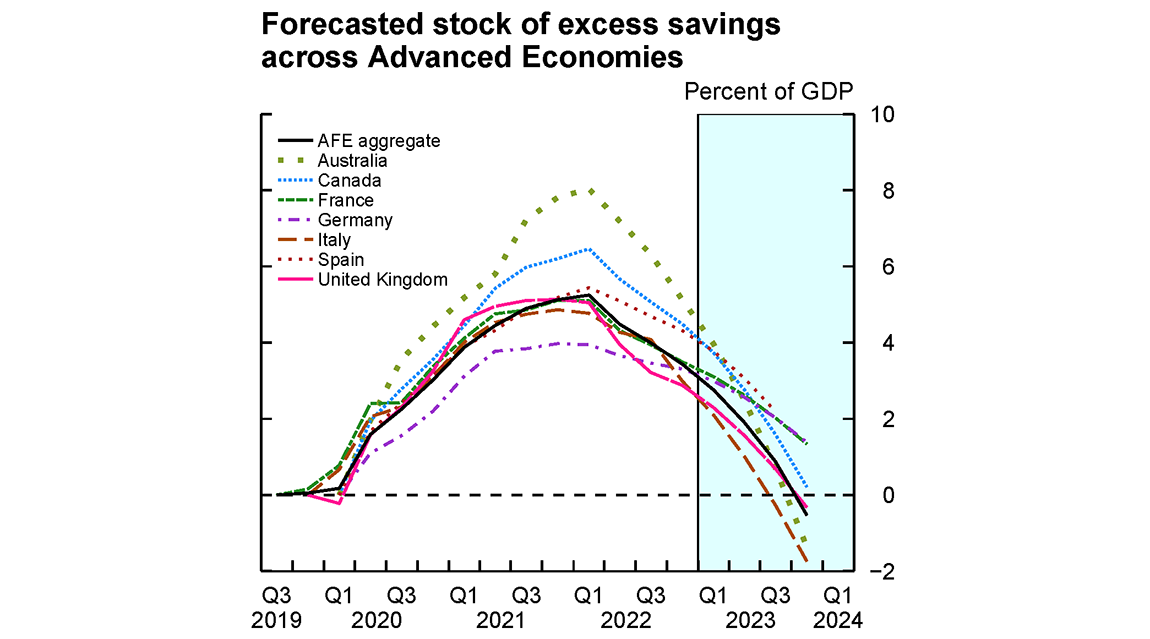
Note: Forecasts begin in 2023:1 except for Spain and the AFE aggregate, for which the forecast begins in 2022:4. Forecasts are based on an AR(1) model with a linear time trend.
Source: Haver Analytics; authors' calculations.
The recent outburst of inflation reflects imbalances between demand and supply that were partly enhanced by government fiscal support (see, for example, de Soyres, Santacreu and Young, 2023). As AFEs are expected to continue to use their accumulated stock of excess savings to fuel consumption in the quarters to come, the resulting strength in aggregate demand could continue to be a source of price pressures. Our analysis suggests that the effect of winding down of excess savings on consumption should last until about the end of the year in AFEs. 6
That said, while strong demand due to fiscal support could continue to play out as a source of inflationary pressures, one should also recognize the benefits of this fiscal support throughout the unprecedented COVID-19 crisis. The large fiscal transfers implemented by governments supported a strong economic rebound, with both GDP and employment recovering at a remarkable pace, likely preventing worse outcomes.
Final remarks.
Household savings rates spiked across several countries following the onset of the COVID-19 pandemic. In this note, we construct a measure of excess savings for the United States, AFEs, and EMEs, and compare the COVID-19 recession to past recessionary episodes. While accumulated excess savings during COVID-19 were unprecedented in size, they have been unwound in the United States, declined in the AFEs, and slowed in the EMEs. Relative to COVID-19, past episodes are characterized by smaller increases in excess savings and greater persistence in the stock of excess savings. Absent any further shocks to disposable income or savings behavior, our analysis suggests that the accumulated average AFE excess savings should be unwound by the end of the year.
References.
Abdelrahman, Hamza and Luiz E. Oliveira (2023). "The Rise and Fall of Pandemic Excess Savings," FRBSF Economic Letter 2023-11, The Federal Reserve Bank of San Francisco, May 8, 2023.
Aladangady, Aditya, David Cho, Laura Feiveson, and Eugenio Pinto (2022). "Excess Savings during the COVID-19 Pandemic," FEDS Notes. Washington: Board of Governors of the Federal Reserve System, October 21, 2022.
Cascaldi-Garcia, Danilo, Musa Orak, and Zina Saijid (2023). "Drivers of Post-pandemic Inflation in Selected Advanced Economies and Implications for the Outlook," FEDS Notes. Washington: Board of Governors of the Federal Reserve System, January 13, 2023.
de Soyres, François, Ana Maria Santacreu and Henry L. Young (2023). "Demand-Supply Imbalance during the COVID-19 Pandemic: The Role of Fiscal Policy" Review, Federal Reserve Bank of St. Louis, vol. 105(1), pages 21-50, January.
Hamilton, James D. (2018). "Why You Should Never Use the Hodrick-Prescott Filter," The Review of Economics and Statistics, vol. 100 (5), pages 831-843.
Appendix.
Alternative measure of excess savings.
Our baseline measure of excess savings is defined as the savings arising from a deviation in the actual savings rate from its time-varying trend. We extract time-varying trends in savings rates via the Hamilton (2018) filter. As an alternative, this section provides results based on a measure of excess savings defined as the deviation of the actual savings rate from a linear trend estimated over the two years (for AFEs) and five years (for EMEs) preceding a given recession. Figure 5 presents our excess savings estimates obtained with this alternative methodology.
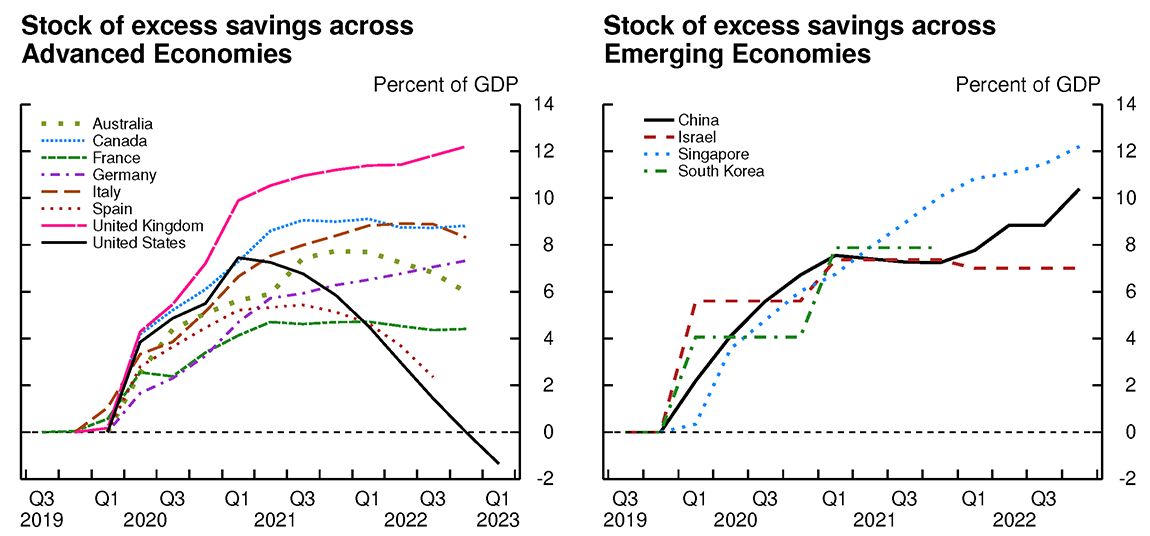
Fig 5a 1. (Left Figure)
Note: Stock begins accumulating from 0 at t=-1, where t=0 is the first period of low growth due to COVID-19. Excess savings are calculated as deviation from the predicted savings rate using a linear trend.
Source: Haver Analytics; authors' calculations.
Fig 5a 2. (Right Figure)
Note: Data is annual for Israel and South Korea. Stock begins accumulating from 0 at t=-1, where t=0 is the first period of low growth due to COVID-19. Excess savings are calculated as deviation from the predicted savings rate using a linear trend.
Source: Haver Analytics; authors' calculations.
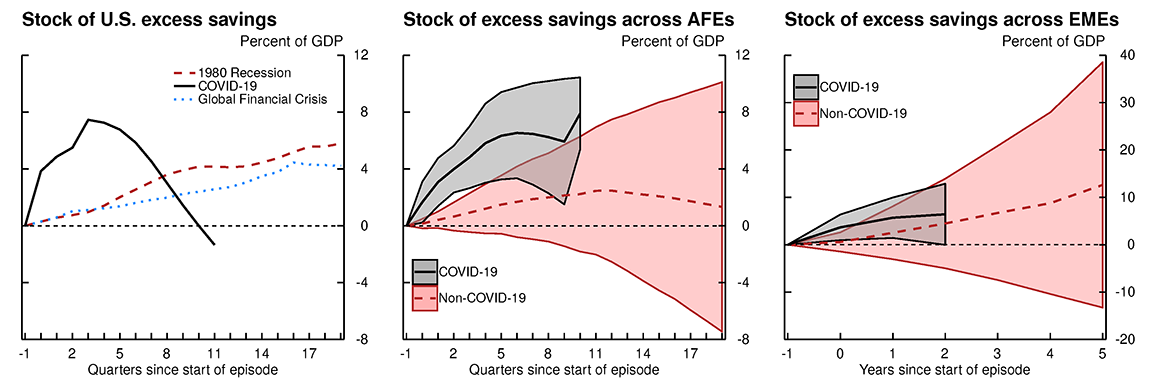
Fig 5b 1. (Left Figure)
Note: Data are quarterly.
Source: Haver Analytics; authors' calculations.
Fig 5b 2. (Middle Figure)
Note: Data are quarterly.
Source: Haver Analytics; authors' calculations.
Fig 5b 3. (Right Figure)
Note: Data are annual. For China, Israel, South Korea, and Taiwan, t=0 in 2020. For Thailand, t=0 in 2019.
Source: Haver Analytics; authors' calculations.
The key difference between the Hamilton filter-based definition of excess savings and the linear trend-based definition is that the latter assumes a constant trend in the savings rate during the years prior to the onset of a recession. Despite this conceptual difference, the results reported here are consistent with those obtained using the Hamilton filter-based definition of excess savings. In particular, we find that the stock of excess savings in the United States turned negative in 2023Q1. That said, excess savings based on deviations from a linear trend are notably higher in many AFEs and EMEs which illustrates that excess savings estimates are sensitive to assumptions and methodology used for their construction.
While our profile of excess savings for the United States through the first half of 2022 is similar to that detailed in a previous FEDS note (Aladangady, Cho, Feiveson, and Pinto, 2022), differences in definitions of excess savings may lead to differences in the measured levels of excess savings. Aladangady, Cho, Feiveson, and Pinto (2022) defines excess savings as the cumulative sum of flows of disposable personal income less personal consumption expenditures and other outlays, where each of these flows is first detrended using a linear trend. On the other hand, we define excess savings as the cumulative sum of deviations in savings rates from their respective time-varying trends, multiplied by nominal disposable income and divided by nominal GDP.
1. François de Soyres ([email protected]), Dylan Moore ([email protected]) and Julio Ortiz ([email protected]) are with the Board of Governors of the Federal Reserve System. The views expressed in this note are our own, and do not represent the views of the Board of Governors of the Federal Reserve, nor any other person associated with the Federal Reserve System. Return to text
2. The savings rate is defined as gross household savings divided by disposable income. Return to text
3. For each episode, we initialize the stock of accumulated excess savings by setting it equal to 0 at t = -1, the period before the recessionary growth occurs. Return to text
4. Aladangady, Cho, Feiveson, and Pinto (2022) defines excess savings as the sum of the deviation of savings components, in levels, from their respective linear trends estimated from 2015-2019. Abdelrahman and Oliveira (2023) defines excess savings as the deviation of the level of personal savings from its linear trend prior to a recession. In contrast, we focus on the evolution of savings rates, and our Hamilton filter-based approach enables us to flexibly account for time-varying trends in these savings rates which fits our goal of constructing excess savings measures for a wide variety of countries and time periods. In the Appendix, we repeat our analysis using an alternative measure of excess savings in which we fit a linear trend to each country's savings rate over the years preceding a given recession and define excess savings as the deviations from this linear trend. Our results are qualitatively unchanged when taking this approach. Return to text
5. We find that the US stock of excess savings is currently depleted due to a sustained drop below trend in the US savings rate from the end of 2021. Other definitions of excess savings, for instance based on detrended levels of savings components as in Aladangady, Cho, Feiveson, and Pinto (2022), may have different implications for the level of the current stock of US excess savings. Return to text
6. Relatedly, as discussed in Cascaldi-Garcia, Orak and Saijid (2023), strong demand will also result in tight labor markets which indirectly add pressures on inflation, as labor demand outstrips supply. Return to text
de Soyres, Francois, Dylan Moore, and Julio L. Ortiz (2023). "Accumulated Savings During the Pandemic: An International Comparison with Historical Perspective," FEDS Notes. Washington: Board of Governors of the Federal Reserve System, June 23, 2023, https://doi.org/10.17016/2380-7172.3326.
Disclaimer: FEDS Notes are articles in which Board staff offer their own views and present analysis on a range of topics in economics and finance. These articles are shorter and less technically oriented than FEDS Working Papers and IFDP papers.