FEDS Notes
October 21, 2022
Excess Savings during the COVID-19 Pandemic
Aditya Aladangady, David Cho, Laura Feiveson, and Eugenio Pinto1
Introduction
Over the pandemic, historic levels of government transfers boosted household income while household spending was severely curtailed by social distancing. This led the personal saving rate to soar (Figure 1), and we estimate that U.S. households accumulated about $2.3 trillion in savings in 2020 and through the summer of 2021, above and beyond what they would have saved if income and spending components had grown at recent, pre-pandemic trends. Since late last year, households have decumulated about one-quarter of these excess savings, as the saving rate has dropped below its pre-pandemic trend.
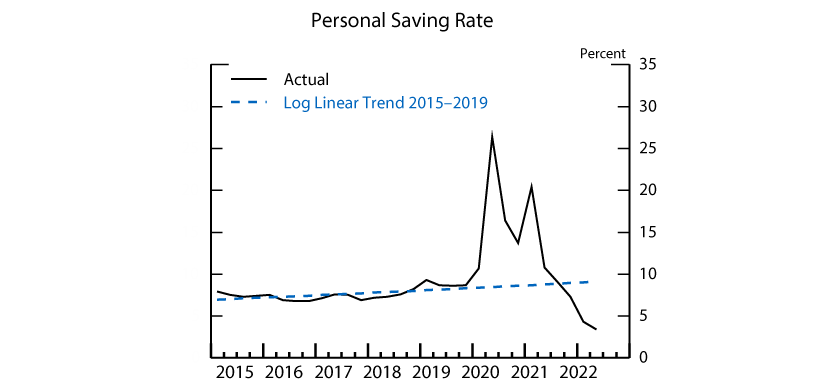
Source: Bureau of Economic Analysis, authors’ calculations.
The amount and distribution of these excess savings have received a lot of attention by policymakers, because forecasts of economic growth and inflation as well as our understanding of household welfare depend heavily on who holds the excess savings and how long they are expected to bolster household balance sheets and demand. In general, by contributing significantly to high levels of liquidity, excess savings have enabled more households to smooth their consumption through negative income shocks, making the economy more resilient to adverse shocks. Accordingly, excess savings may help to damp a feedback loop—where a negative shock to income leads to a cut to spending, which then leads to an additional cut to income, et cetera—that, at its worst, could lead to a recession. At the same time, excess savings have fueled high levels of spending for some households, which may have contributed to persistently high inflation amid constrained supply.
These effects may be amplified or reduced by the extent to which the excess savings are held by lower-income households, many of whom typically hold very little liquid wealth, as an increase in liquidity may lead to notable changes in their spending behavior. For this reason, we also consider how excess savings are distributed across the population. We estimate that households in the lower half of the income distribution were still holding about $350 billion in excess savings as of mid-2022—mostly stemming from the boost to income induced by fiscal stimulus in 2020 and 2021. It is important to note that many of these households have used some of their excess savings to pay down debts, or possibly to invest in equity and other financial assets or as a down payment for buying a home, instead of keeping them as liquid assets, thus shifting where the savings appear on their balance sheets. Regardless of their allocation, excess savings resulted in higher net wealth and stronger balance sheets for these households, which have continued to support spending and credit performance.
In contrast, even though households in the top half of the distribution hold the large majority of excess savings (about $1.35 trillion as of mid-2022), this increase in their savings likely had only a modest effect on their spending behavior through 2021. During the first two years of the pandemic, and especially earlier on, their spending was instead much more driven by social distancing. Now that this group is able to travel and spend again, their excess savings are likely contributing to their high levels of spending. However, the recent demand by these households has likely been boosted more by earlier gains in equity and housing prices than by their excess savings. As of mid-2022, household wealth had increased by nearly $25 trillion since 2019, even after accounting for the large equity price declines in the first half of this year, most of which accrued to the top half of the income distribution.
In Section II, we introduce our methodology and derive aggregate excess savings. In Section III, we estimate the decomposition of aggregate excess savings into income quartiles, and in Section IV we discuss the sensitivity of our results and the comparison to other data and estimates.
Aggregate Excess Savings
We start by deriving the aggregate amount of excess savings. The flow of household savings, as defined by the Bureau of Economic Analysis (BEA) in the national income and product accounts (NIPA), can be written as:2
Flow of savings = Disposable personal income (DPI) – Consumption (PCE) – Other outlays
We use a simple approach to calculate excess savings: We add the amount that the components of DPI exceed their trend with the amount that PCE and other outlays are below their trend.3 We then cumulate these flows over time to calculate the stock of excess savings.4
As shown in Figure 2, nominal DPI was above its trend for most of 2020 and 2021. This excess income is more than accounted for by transfer receipts, the category where most of the government fiscal policy response to the COVID-19 crisis shows up. However, disruptions to the labor market led compensation to remain below trend in 2020 and early 2021. Compensation only started rising above trend in mid-2021, when employment picked up significantly. By late 2021 and in early 2022, nominal compensation stood well above trend because of the high nominal wage growth during that period.
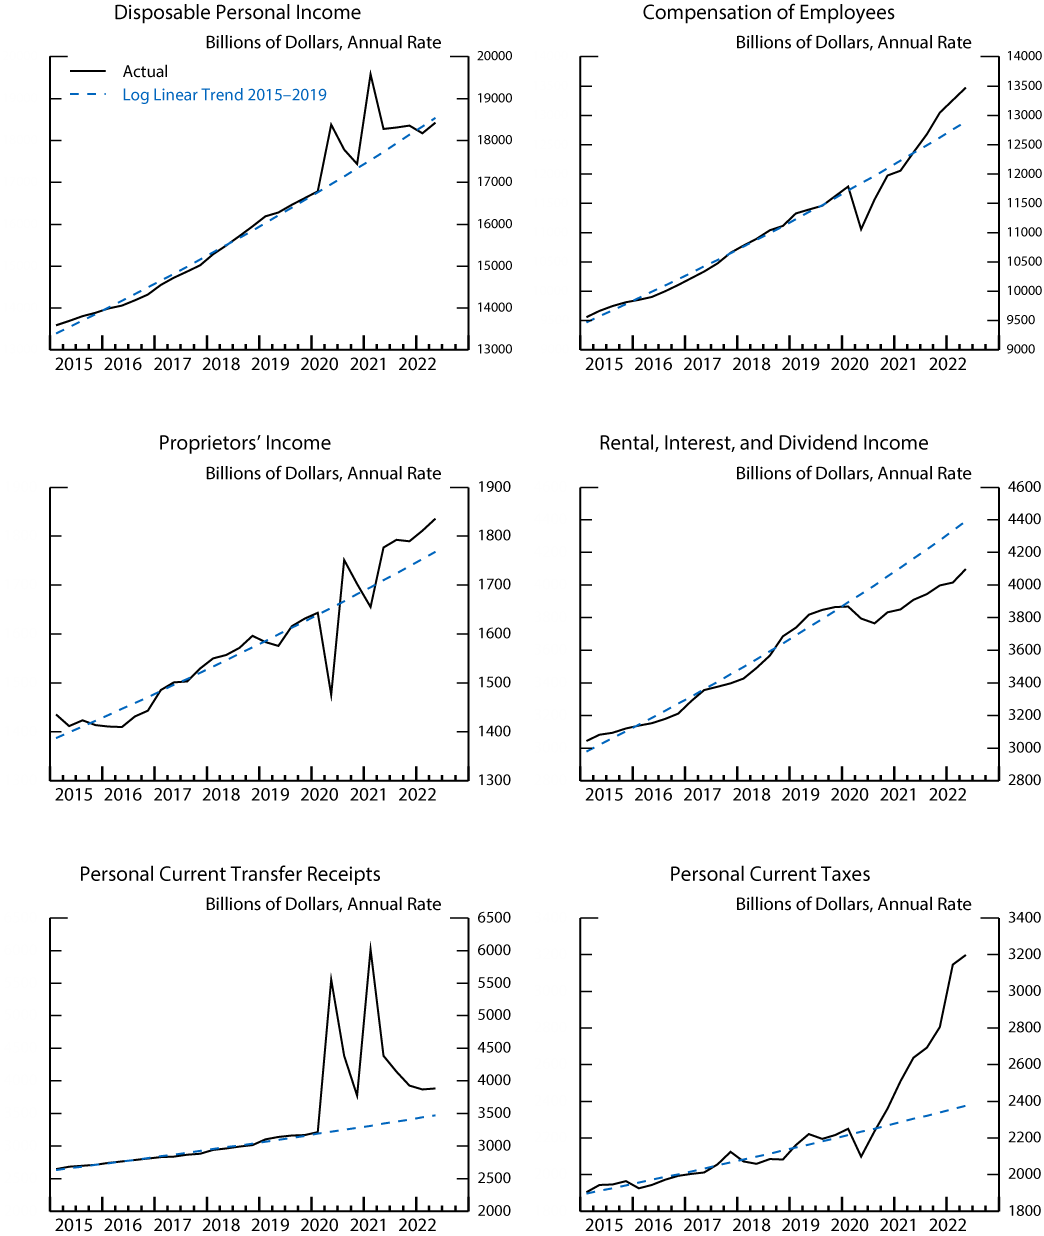
Source: Bureau of Economic Analysis, authors’ calculations.
A second major contributor to excess savings is nominal PCE, which moved below its trend throughout 2020 and early 2021. Below-trend PCE during this period was driven by services consumption, including spending on leisure, hospitality, and recreation services. Goods consumption has actually been running well above trend since early in the pandemic. Steep price appreciation, particularly for goods, contributes to the soaring nominal consumption flows by the end of 2021, but the real figures (Figure 3, middle-right panel) show that goods spending—even when deflated—has been well above trend since mid-2020.
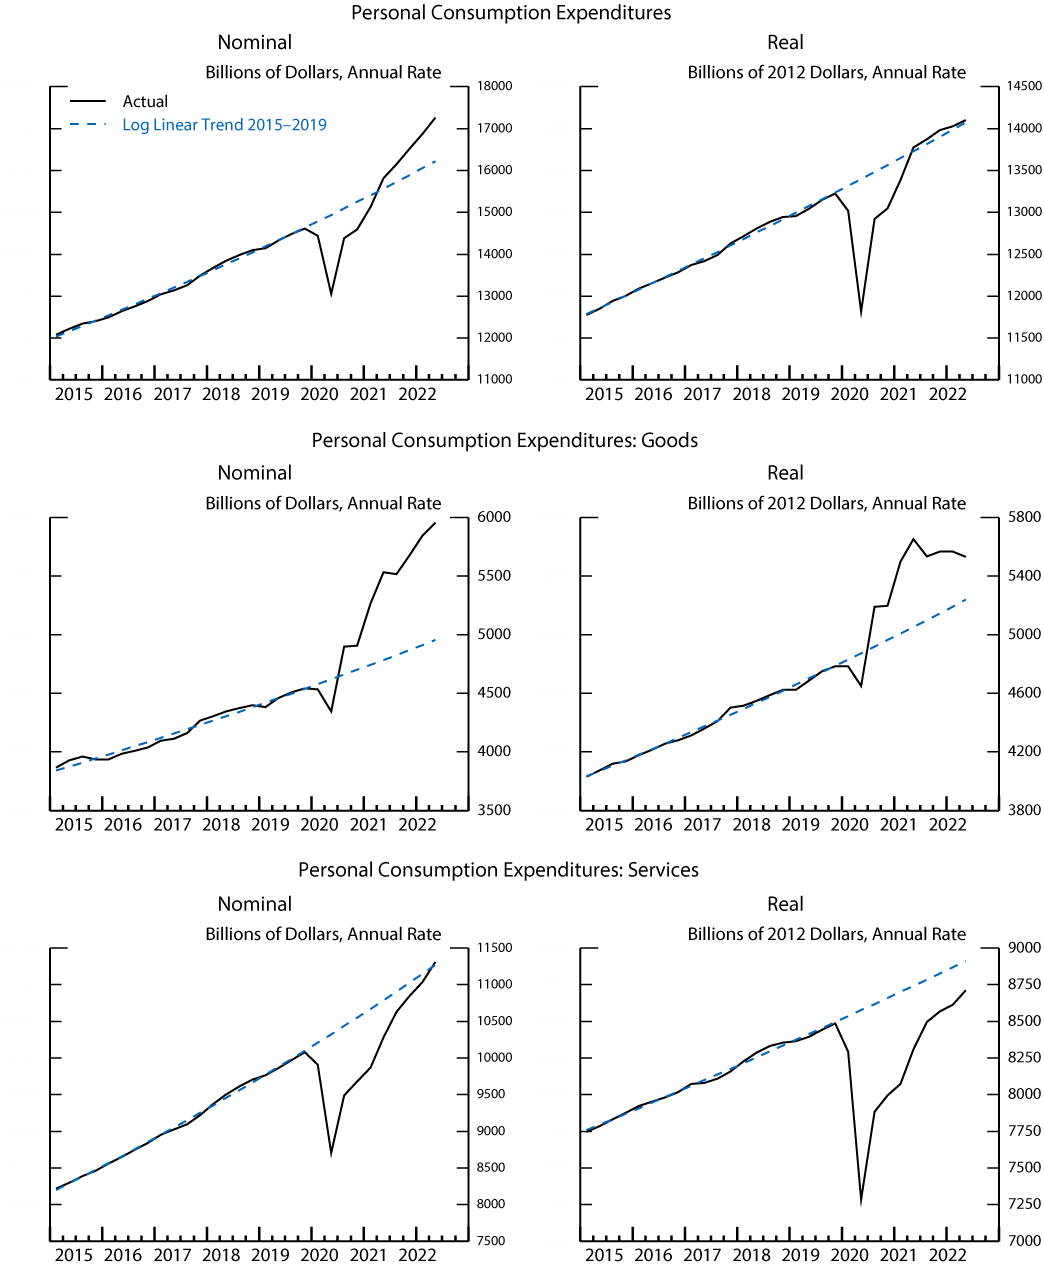
Source: Bureau of Economic Analysis, authors’ calculations.
Finally, one other important contributor to excess savings is interest payments (the major component of other outlays). Interest payments have been quite a bit below their trend since 2019 (Figure 4). We think this largely reflects loan forbearance policies for student loans, lower interest rates, and lower household debt balances enabled by higher fiscal support and reduced consumption.
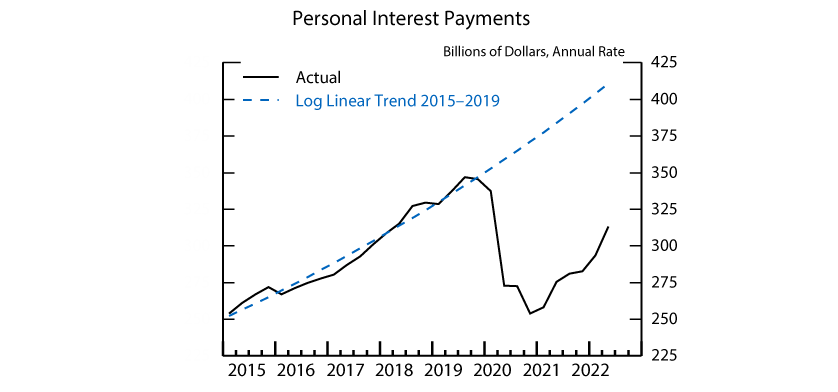
Source: Bureau of Economic Analysis, authors’ calculations.
We calculate aggregate excess savings by combining the deviations of DPI, PCE, and other outlays from their trends. The left panel of Figure 5 shows the flow of excess savings over time, and the right panel shows the cumulated stock. At the onset of the pandemic, fiscal support more than replaced other income losses in the aggregate, propping up personal income even as spending fell. By the third quarter of 2021, we estimate that the stock of excess savings amounted to about $2.3 trillion, after which it began to decline as spending picked up and fiscal support diminished. Even so, the stock of excess savings remained at about $1.7 trillion by mid-2022.
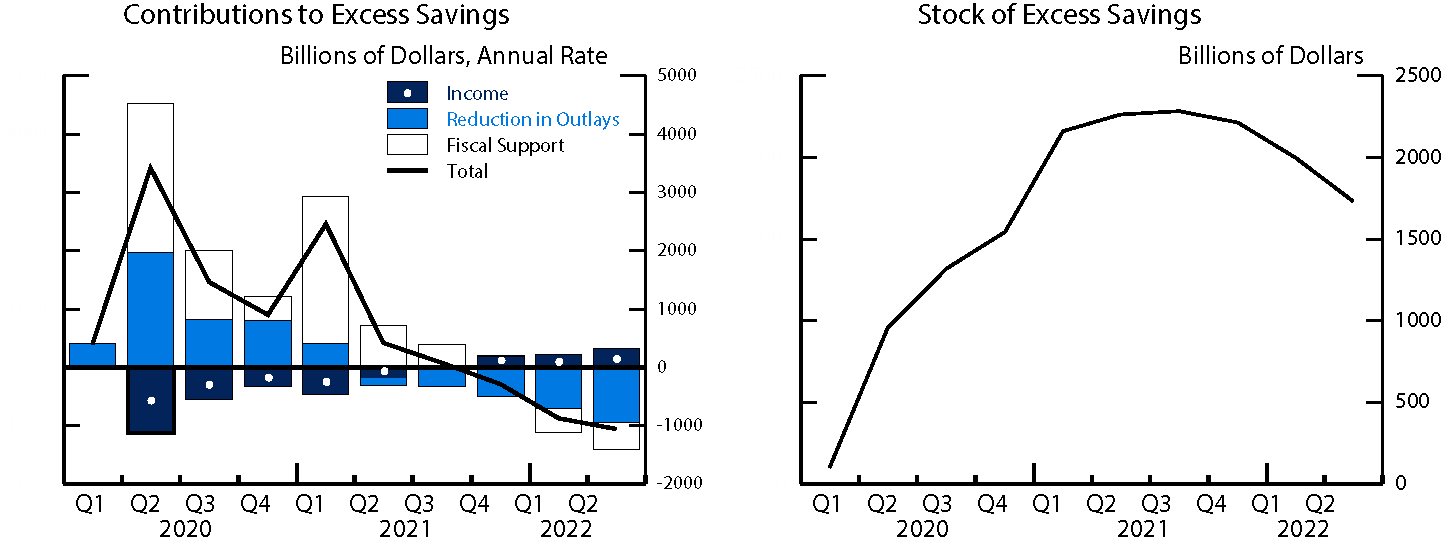
Source: Authors’ calculations.
Decomposition of Excess Savings across Income Quartiles
To allocate aggregate excess savings over the income distribution, we decompose detailed components of personal income (including fiscal support) and personal outlays across income quartiles. We draw upon existing data sets, whenever possible, and use institutional details and judgment, when there are gaps in the available data. We require that the decomposition of each category of savings adds to its aggregate flow in each quarter; in doing so, the excess savings by income quartile add up to the aggregate excess savings by design. Table 1 gives a summary of the information we use to decompose the different elements of excess savings.
Table 1: Source Data Used to Decompose Excess Savings across Income Quartiles
| Excess Savings Component | Contribution to Excess Savings through 2022:Q2 | Source of Decomposition Assumptions |
|---|---|---|
| Income | ||
| Compensation of employees | $71 billion | Bureau of Labor Statistics, "Current Population Survey" (January 2020-June 2022) |
| Proprietors' income | $51 billion | Bureau of Economic Analysis, "Distribution of Personal Income" (2019) |
| Rental, dividend, and interest income | -$596 billion | Bureau of Economic Analysis, "Distribution of Personal Income" (2019) |
| Fiscal Support | ||
| Paycheck Protection Program loans to nonprofit institutions | $56 billion | Bureau of Economic Analysis, "Distribution of Personal Income" (2019) |
| Stimulus checks | $844 billion | Bhutta, Blair, Dettling, and Moore (2020) |
| Unemployment insurance | $836 billion | Larrimore, Mortenson, and Splinter (2022) |
| Child tax credit | $181 billion | Authors' calculations |
| Other transfer receipts | $548 billion | Bureau of Economic Analysis, "Distribution of Personal Income" (2019) |
| Contributions for social insurance | $11 billion | Bureau of Economic Analysis, "Distribution of Personal Income" (2019) |
| Personal taxes | -$745 billion | Bureau of Economic Analysis, "Distribution of Personal Income" (2019) |
| Outlays | ||
| Personal consumption expenditures | $181 billion | Affinity/Opportunity Insights / authors' calculations |
| Student loan forbearance | $87 billion | Federal Reserve Board, "Survey of Consumer Finances" (2019) |
| Other interest payments | $156 billion | Federal Reserve Board, "Survey of Consumer Finances" (2019) |
| Transfer payments | $31 billion | Authors' calculations |
Figure 6 shows what our detailed decompositions imply for the paths of DPI and PCE for each income quartile relative to their typical trend. The left panel shows that, with the exception of the top quartile, DPI has remained above its trend and with considerable spikes in 2020:Q2 and 2021:Q1. These spikes coincide with stimulus payments and other fiscal support provided by major legislation, such as the CARES and ARP Acts, the bulk of which flowed to households in the bottom half of the income distribution. Fixed-dollar top ups to unemployment benefits also drove up savings among lower-income households, given large job losses among lower-income workers. Incomes among top-earners were little changed on net, but spending fell dramatically (right panel), reflecting the larger share of discretionary services spending by higher-income households.5
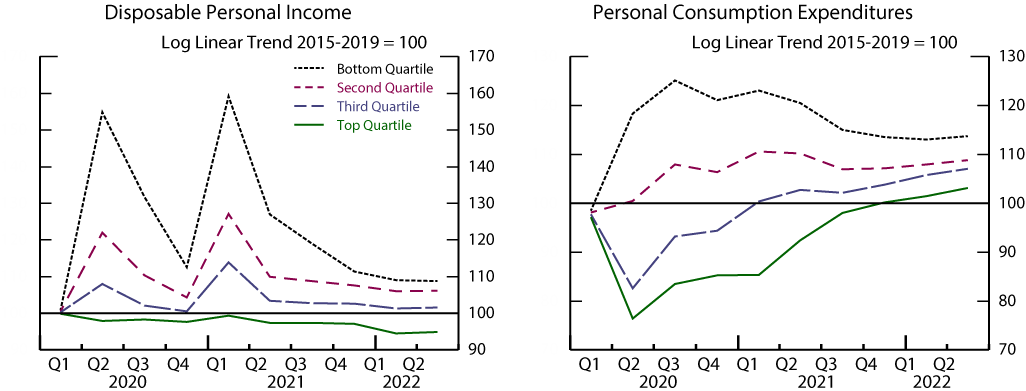
Source: Authors’ calculations.
After combining our assumptions for the decomposition of each detailed component of personal income and outlays, we arrive at a decomposition of total excess savings across the income distribution. The left panel of Figure 7 shows the path for this decomposition of excess savings over time, while the right panel shows the main contributors to excess savings held by households in each income quartile as of mid-2022. As suggested by the right panel of Figure 7, the primary driver of the excess savings for households in the top quartile has been their foregone consumption, whereas the primary driver of excess savings for the bottom half of the income distribution was the roughly $1.5 trillion in fiscal transfers received through the end of 2021.
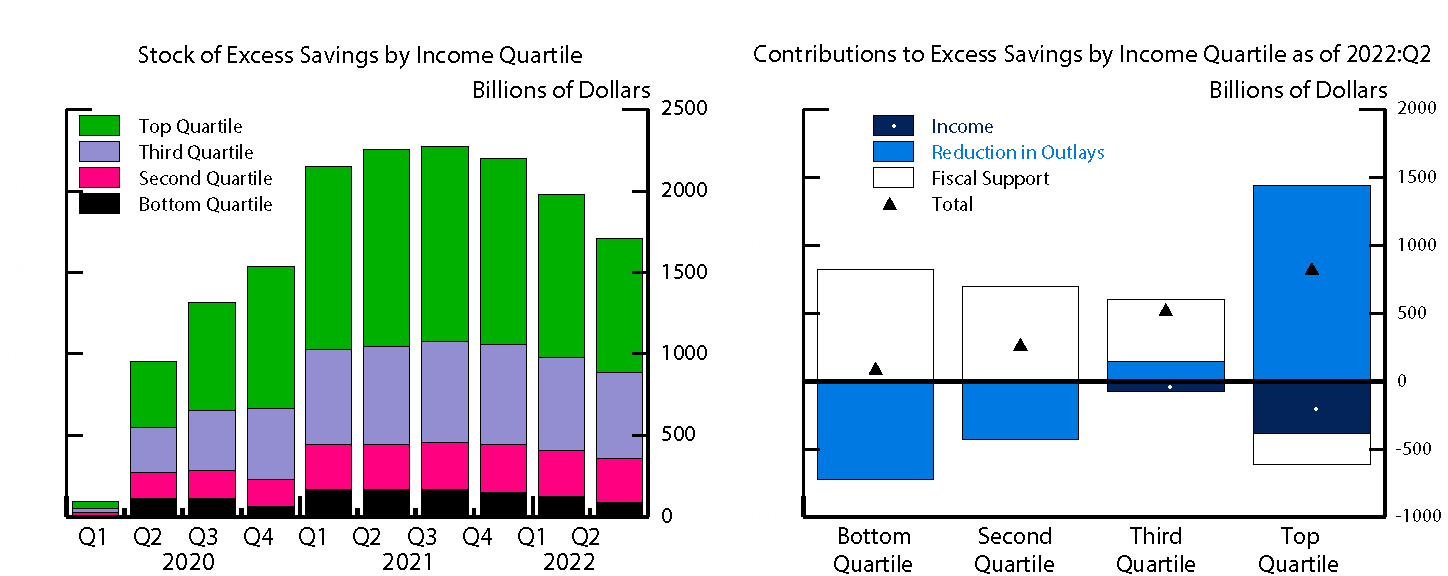
Source: Authors’ calculations.
The results of this exercise suggest that most excess savings have been held by households at the top half of the income distribution. However, as of the middle of this year, our simulation suggests that households in the bottom half of the income distribution still held roughly $350 billion in excess savings—about $5,500 per household on average. To put this amount in perspective, households in the bottom half of the distribution held in 2019 roughly $8,000 in transaction accounts and $4,000 in credit card debt on average. The liquidity from the excess savings, therefore, would have either boosted their liquid assets by roughly two-thirds, or fully paid off their "liquid debt" with some room to spare.6 The $5,500 average excess savings would then provide a much needed buffer for this group (Han et al., 2020).
Of course, our average excess savings estimate for households in the lower half of incomes masks considerable heterogeneity even within the lower end of the distribution. Much of this figure is driven by the highly progressive fiscal support during the early part of the pandemic—particularly stimulus checks and unemployment insurance expansions. While balance sheets of many lower-income households may have been bolstered by these programs, some households may have fallen through the cracks of the social safety nets (Bitler et al., 2020). Even for those households that still hold excess saving buffers, we expect savings to continue dwindling rapidly as fiscal support is now in the rearview and households return to relying on labor earnings and any remaining savings to finance spending.
Sensitivity of Our Estimates and Comparison to Other Data and Estimates
It is important to note that there is high uncertainty in these decomposition estimates. Indeed, while the range of other forecasters' estimates of aggregate excess savings have all been quite close to ours, the range of the estimates of the amount held by households at the bottom of the income distribution is quite large.7 While the distributions of fiscal support and earnings losses are closely tied to data or institutional details, data limitations require us to rely heavily on assumptions about the distribution of PCE across income quartiles.8
In our baseline, we estimate spending among households in the bottom half rises about 10 percent above its pre-pandemic trend following the CARES Act in 2020 and remains well above trend through 2022. Even assuming such elevated levels of spending, we estimate households accrued considerable excess savings over the past couple years. In fact, we would have to assume that the bottom half of the distribution consumed nearly 25 percent above their typical trend level in 2021, about twice as much as our baseline assumption, if we were to find that their excess savings had been fully exhausted by the end of 2021. We have not found any evidence in the available data that the consumption rates could have been even close to that high, on average, last year.9 In the other direction, had households in the bottom half of the income distribution kept their consumption at pre-pandemic trends in 2020, their excess savings would have accrued to about $750 billion as of mid-2022, with most of the difference accounted for by the bottom income quartile.
Other data sets provide some evidence that household balance sheets across the income distribution remain healthy. There are few datasets that have direct information about individual household balance sheets, but one notable exception is the dataset gathered by the JPMorganChase Institute (JPMCI), which contains information about the checking account balances of a nonrepresentative group of consumers that bank with Chase (Greig and Deadman, 2022). The JPMCI finds that median checking account balances surged in the spring of 2020—and disproportionately so for the lower income quartiles—and have remained elevated since. The checking account balances will only capture a portion of total excess savings of those consumers and, perhaps for this reason and because median checking balances are substantially smaller than mean balances, their implicit magnitudes are much smaller than our excess savings estimates. However, their finding that balances have stayed elevated through mid-2022 is qualitatively consistent with ours.10
The Distributional Financial Accounts, which rely on historic relationships to extrapolate household balance sheets at various points in the income and wealth distributions, also suggest considerable increases in liquid asset holdings among lower income households. While extrapolation based on historical relationships is likely not applicable in the current setting, as the distribution of the shocks to income and spending during the pandemic was quite different from prior experience, Batty et al. (2021) provide bounding exercises suggesting substantial excess savings throughout the income distribution even under alternative assumptions.
Measures of financial distress may also provide an indirect measure of household balance sheet strength, as accrued savings provide a buffer to fund spending and service debts. As shown in Figure 8, delinquencies dropped precipitously during 2020 when the first tranche of fiscal stimulus went out and stayed low through 2021.11,12 Likewise, payment rates on credit card balances rose and stayed elevated through 2021, consistent with conclusions of Adams and Bord (2020). Delinquency and payment rates have levelled off or shown signs of deterioration this year, but both measures remain in a healthier state than before the pandemic. These patterns are consistent with the gradual drawdown of excess savings, and they support our finding that household balance sheets in the bottom half of the distribution are still relatively healthy.
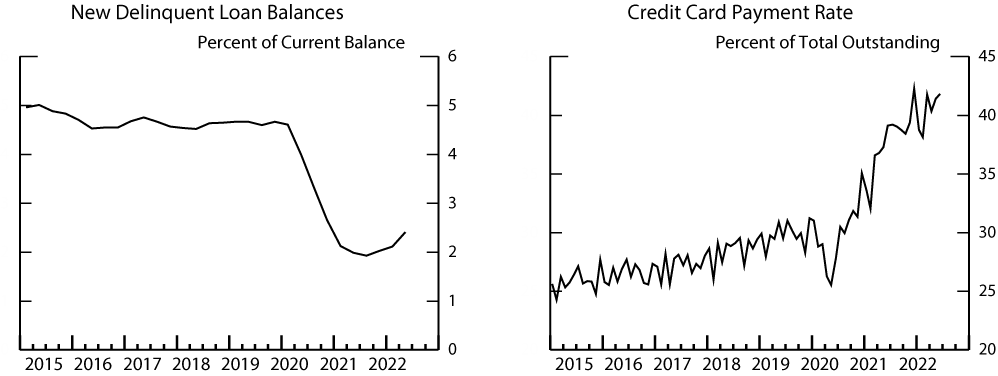
Left Figure:
Source: Federal Reserve Bank of New York, "Quarterly Report on Household Debt and Credit" (2022:Q2).
Right Figure:
Note: Includes both principal and finance charge payments.
Source: Standard and Poor’s
In summary, our estimates suggest that households across the income distribution continue to have a buffer of excess savings to help them navigate higher prices and/or a tightening cycle. While this buffer is dwindling, for now it is likely still providing some needed balance sheet support that could help to stanch a negative feedback loop were the economy to slow.
References
Adams, Robert and Vitaly Bord (2020). "The Effects of the COVID-19 Shutdown on the Consumer Credit Card Market: Revolvers versus Transactors," FEDS Notes. Washington: Board of Governors of the Federal Reserve System, October 21, https://www.federalreserve.gov/econres/notes/feds-notes/the-effects-of-the-covid-19-shutdown-on-the-consumer-credit-card-market-revolvers-versus-transactors-20201021.html.
Armantier, Olivier, Leo Goldman, Gizem Koşar and Wilbert van der Klaauw (2021). "An Update on How Households Are Using Stimulus Checks," Federal Reserve Bank of New York, Liberty Street Economics (blog), April 7, https://libertystreeteconomics.newyorkfed.org/2021/04/an-update-on-how-households-are-using-stimulus-checks/.
Bank of America Institute (2022). Consumer Morsel. It Takes Two Income Groups to Tango. (Charlotte: Bank of America Institute).
Batty, Michael, Ella Deeken, and Alice Henriques Volz (2021). "Wealth Inequality and COVID-19: Evidence from the Distributional Financial Accounts," FEDS Notes. Washington: Board of Governors of the Federal Reserve System, August 30, https://www.federalreserve.gov/econres/notes/feds-notes/wealth-inequality-and-covid-19-evidence-from-the-distributional-financial-accounts-20210830.html.
Bhutta, Neil, Jacqueline Blair, Lisa Dettling, and Kevin Moore (2020). "COVID-19, the CARES Act, and Families' Financial Security," National Tax Journal, vol. 73 (3), pp. 645–72.
Bitler, Marianne P., Hilary W. Hoynes, and Diane Whitmore Schanzenbach (2020). "The Social Safety Net in the Wake of COVID-19," Brookings Papers on Economic Activity, Summer, pp. 119–58, https://www.brookings.edu/wp-content/uploads/2020/06/SU20_S2_Bitler-et-al_-final-paper.pdf.
Briggs, Joseph (2021). USA Daily: Updating Our Distributional Income and Spending of Pent-Up Savings Estimates. New York: Goldman Sachs, October.
Chetty, Raj, Nathaniel Hendren, John Friedman, and Michael Stepner, and The Opportunity Insights Team (2020). "The Economic Impacts of COVID-19: Evidence from a New Public Database Built Using Private Sector Data," NBER Working Paper 27431. Cambridge, Mass.: National Bureau of Economic Research, November, https://www.nber.org/papers/w27431.
Dettling, Lisa and Lauren Lambie-Hanson (2021). "Why is the Default Rate So Low? How Economic Conditions and Public Policies Have Shaped Mortgage and Auto Delinquencies During the COVID-19 Pandemic," FEDS Notes. Washington: Board of Governors of the Federal Reserve System, March 4, https://www.federalreserve.gov/econres/notes/feds-notes/why-is-the-default-rate-so-low-20210304.html.
Ensign, Rachel and Orla McCaffrey (2021). "Americans Begin to Draw Down Pandemic-Era Savings," The Wall Street Journal, July 6.
Greig, Fiona and Erica Deadman (2022). Household Pulse: The State of Cash Balances through March 2022. New York: JPMorgan Chase Institute, March.
Han, Jeehoon, Bruce D. Meyer, and James X. Sullivan (2020). "Income and Poverty in the COVID-19 Pandemic," Brookings Papers on Economic Activity, Summer, pp. 85–118, https://www.brookings.edu/wp-content/uploads/2020/06/Han-et-al-conference-draft.pdf.
Larrimore, Jeff, Jacob Mortenson, and David Splinter (2022). "Unemployment Insurance in Survey and Administrative Data," FEDS Notes. Washington: Board of Governors of the Federal Reserve System, July 5, https://www.federalreserve.gov/econres/notes/feds-notes/unemployment-insurance-in-survey-and-administrative-data-20220705.html.
Zentner, Ellen, Robert Rosener, Julian Richers, Christopher Collins, Sarah Wolfe, and Lenoy Dujon (2022). US Economics Mid-Year Outlook: Policy Weighs on Growth. New York: Morgan Stanley, May.
1. We would like to thank Samara Beach and Ari Gelbard for valuable research assistance. The note benefitted from comments by Vitaly Bord, Edmund Crawley, Lisa Dettling, John Driscoll, Will Gamber, Paul Lengermann, Andrew Paciorek, David Ratner, and Kamila Sommer. The analysis and conclusions set forth are those of the authors and do not indicate concurrence by other members of the staff, the Board of Governors, or the Federal Reserve Banks. Return to text
2. In this equation, DPI is personal income less taxes, and "Other outlays" includes (non-mortgage) interest and transfer payments by households. Return to text
3. Our excess savings estimates are a bit sensitive to the sample period used to estimate the trend. We assume a log linear trend fit over the 2015–2019 period. Using a trend fit over a longer 10- or 20-year period would result in between 5 to 15 percent higher excess savings estimates, but still a similar decline from their peak in 2021:Q3. Return to text
4. For simplicity and to preserve additivity, all components of personal income and outlays are measured in nominal dollars. Therefore, our trends implicitly assume that both prices and real values move along their pre-pandemic trends. Nominal excess savings have been boosted by above-trend price inflation since early 2021, but we think that deflating the flow of nominal excess savings only leads to a small upward bias relative to the flow of excess savings measured at constant prices, given that the trend saving rate is relatively small. That said, with inflation boosting PCE prices in 2022:Q2 by about 10 percent above their pre-pandemic level, this could reduce somewhat the real (consumption-equivalent) value of previously accumulated excess savings, especially for households that have not used their savings to reduce debt or invest in inflation-protected assets. Return to text
5. As noted in Table 1, we partly base our decomposition of PCE across income quartiles on the Affinity/Opportunity Insights data published by https://tracktherecovery.org and Chetty et al. (2020). While spending among lower-income households in the Affinity data did fall early in the pandemic, it fell considerably less sharply than for higher-income households, and we find a similar pattern in other administrative and regulatory data sources tracking spending. However, because the Affinity data show a much larger drop in aggregate consumption in 2020 than reported in the NIPA, we adjusted upwards the consumption paths mostly for the two bottom income quartiles, especially in 2020. Return to text
6. Retirees made up about one-third of the bottom half of the income distribution. The remaining two-thirds of non‑retirees typically held even less in their checking accounts and held more debt. Return to text
7. The comparison to other estimates reflects the data prior to the 2022 annual revision of the NIPA. The recent NIPA revision affected our estimate of the pre-pandemic trend for personal saving and resulted in a significantly lower estimate of excess savings. However, the NIPA revision did not materially affect the estimated distribution of excess savings. We estimate that households in the bottom half of the income distribution have held about 20 percent of overall excess savings in recent quarters. Relative to other reported estimates, our estimate stands about halfway between Morgan Stanley (Zentner et al., May 11, 2022), at about 10 percent, and Goldman Sachs (Briggs, October 27, 2021), at about 30 percent. The dispersion of similar estimates for the bottom income quartile is likely even larger. Return to text
8. Real-time consumption data broken down by income quartile are hard to come by. As noted, our methodology uses one of the most publicized sources: the Affinity/Opportunity Insights data. However, these data have some caveats: They don't cover all components of PCE, and, perhaps most importantly, they imply a much larger drop in aggregate consumption in 2020, and then a faster recovery in consumption in 2021, than reported by the BEA. Thus, given our principle to match the aggregate consumption levels in the NIPA, we had to use judgement to distribute the residuals across the income quartiles. To aid in this judgment, we applied a standard marginal propensity to consume to the net income received by the bottom half of the income distribution, who received more fiscal stimulus than the top of the distribution. In contrast, we assume that the consumption patterns of the top half of the income distribution, were held back by the limits to spending on travel, leisure, and hospitality imposed by social distancing. Return to text
9. The Affinity/Opportunity Insights data show that average spending by households in the bottom half of the income distribution has exceeded pre-pandemic trends by about 6 percent, on average, in 2021. Available data from other internal administrative and regulatory data sets appear broadly consistent with the fact that spending in lower income areas exceeded pre-pandemic levels, but by far less than what would have been required to have exhausted excess savings buffers by the end of last year. Return to text
10. Similar evidence is provided by the Bank of America Institute (2022), which includes data on savings and checking account balances by income. Return to text
11. Low delinquency rates reflect both improved balance sheet health and legislation that facilitated forbearance programs (Dettling and Lambie-Hanson, 2021). Loans in forbearance are not reported as delinquent to credit bureaus and would lower delinquency rates. However, Dettling and Lambie-Hanson (2021) show forbearance alone does not explain all of the drop in delinquencies, with stimulus payments and income support programs playing a considerable role as well. Return to text
12. Armantier et al. (2021) find that a large fraction of households report paying down debts using their stimulus checks. Moreover, self-reported spending responses diminished with each subsequent stimulus check, consistent with rising liquid balances reducing marginal propensities to consume. Return to text
Aladangady, Aditya, David Cho, Laura Feiveson, and Eugenio Pinto (2022). "Excess Savings during the COVID-19 Pandemic," FEDS Notes. Washington: Board of Governors of the Federal Reserve System, October 21, 2022, https://doi.org/10.17016/2380-7172.3223.
Disclaimer: FEDS Notes are articles in which Board staff offer their own views and present analysis on a range of topics in economics and finance. These articles are shorter and less technically oriented than FEDS Working Papers and IFDP papers.