FEDS Notes
August 30, 2021
Wealth Inequality and COVID-19: Evidence from the Distributional Financial Accounts
Michael Batty, Ella Deeken, and Alice Henriques Volz
A wide range of economic activity has been severely disrupted by the COVID-19 pandemic, while others have been remarkably resilient throughout the restrictions placed on our physical interactions. The unique pattern of income losses, spending reductions and substitutions, and government relief raise many questions about how different groups fared economically over the last year. This note discusses how household wealth may have evolved over the COVID-19 pandemic. We first describe how aggregate household wealth, as reported in the Financial Accounts of the United States (FA), changed during the pandemic. Next, we discuss how these changes in wealth are apportioned across the distribution in the Distributional Financial Accounts (DFA), which use historical relationships between macroeconomic aggregates and survey distributions to extrapolate from the distribution of wealth measured by the 2019 Survey of Consumer Finances. The unprecedented events of the pandemic give reason to question the relevance of these historical relationships in describing recent quarters. The DFA projections do not explicitly take the unique circumstances into account; in particular, the vast amount of fiscal support and reduced consumption that has resulted in a significant amount of excess savings. Since we do not directly observe the distribution of savings beyond the 2019 SCF, we present a few alternate scenarios for how deposits may be allocated that are designed to bound the distribution of household wealth in the quarters since.1
Aggregate Household Wealth during COVID-19
Despite the fall in equity markets that drove a sharp decline in wealth in 2020q1, equity prices rebounded quickly after the Federal Reserve, U.S. Treasury, and Congress took steps to stabilize financial markets and the economy, and households gained over $18 trillion in wealth since the beginning of 2020. This 17% increase over 2019q4 was driven by asset accumulation much more than by debt paydown. Further, asset-price increases ("revaluations") were the dominant source of wealth accumulation, accounting for nearly 80% (Figure 1). Equity performance has been strong the since the pandemic-related crash in 2020Q1, producing a net gain of 23% for the S&P 500 from the beginning of 2020 through 2021q1. Real estate valuations also rose over this period, which contributed 90% of the 12.6 percentage point increase in household real estate holdings.2
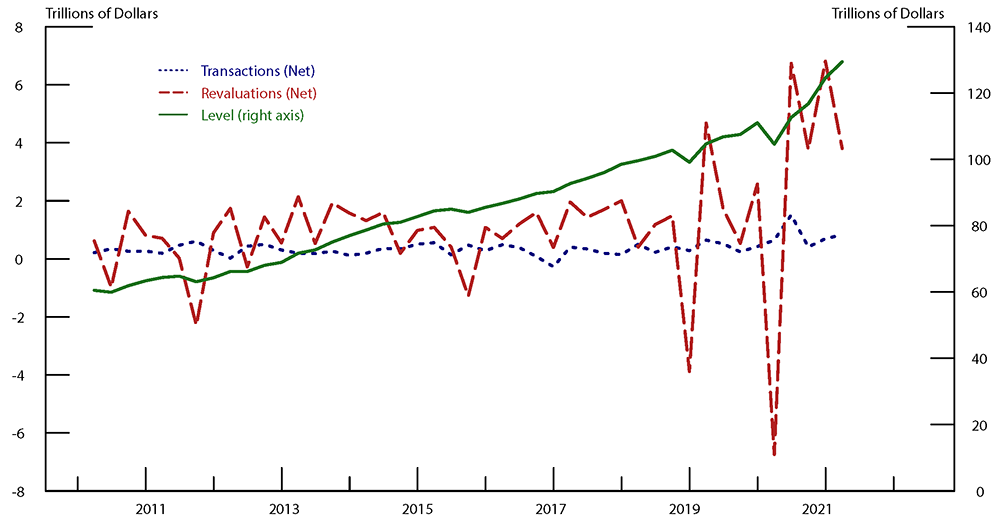
Note: The level of household net worth is plotted on the right axis, and the major sources of wealth change are plotted on the left axis. Transactions represent the net savings from flows into and out of each asset and liability. Revaluations represent the effect of changes in market prices. Omitted from this figure are other changes in volume, which typically account for a much smaller portion of wealth change, and capture things like changes in valuation methodology and the depreciation or destruction of real assets.
Source: Financial Accounts of the United States.
Though not the primary contributor to the aggregate gain in wealth, savings ("net transactions") surged during the pandemic. The increase in savings reflects the resilience of certain sectors of the economy, reduced consumption, and the large amount of fiscal relief provided by the government.3 Notably, increased savings largely flowed to deposits, which saw unprecedented gains (Figure 2). In contrast, net transactions for other assets and liabilities were within their recent historical ranges through 2020. Equities and real estate had somewhat elevated transactions in 2021Q1 but remain far below those for deposits.4
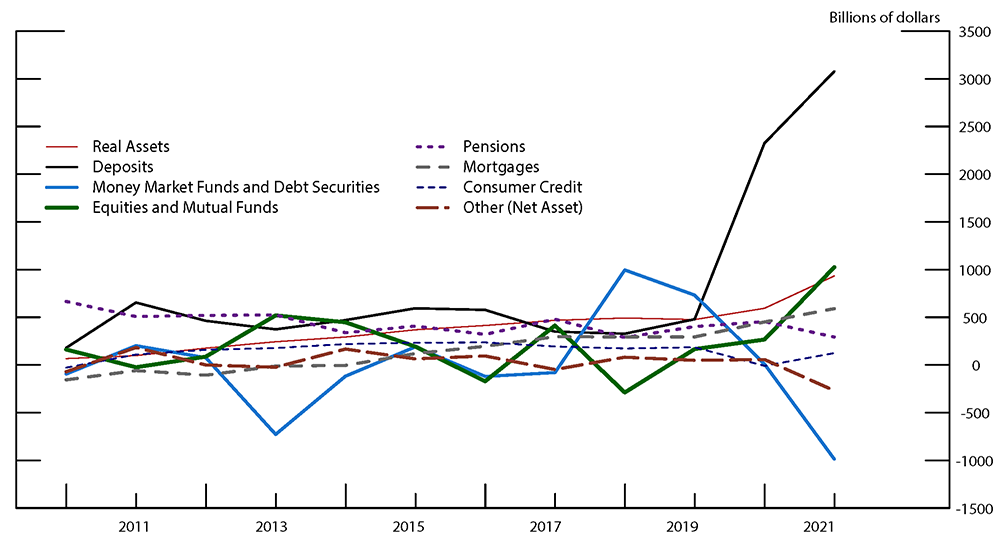
Note: Figure 2 breaks down the transactions shown in Figure 1 by major asset and liability category.
Source: Financial Accounts of the United States.
DFA Results during COVID-19
The aggregate changes in household wealth provide a useful lens through which to analyze the DFA5 estimates during COVID-19. The net transactions for assets that account for the vast majority of wealth gained through market price increases—corporate equities, mutual funds, pensions, and real estate— have not been elevated through most of the pandemic, and they were significantly lower than their respective net revaluations. Thus, the distributions for these assets measured in the 2019 SCF are likely still informative, and there is little reason to expect the DFA apportionment of the price-driven gains since 2020Q2 would be substantially biased.6 In contrast, the large inflows for deposits that were influenced by pandemic-specific factors, which the DFA models have no relevant historical precedent. In this section, we describe the recent evolution of the wealth distribution as estimated by the DFA and turn to alternate distributions of deposits in the next section.
We begin by reviewing the balance sheet composition across the distribution. In 2019Q4, approximately half of the assets held by households in the bottom half of the wealth distribution ("Bottom 50") were real estate, with pensions and durables each comprising less than 20%. Liquid assets were less than 10% of Bottom 50 assets. In contrast, for those in the top one percent ("Top 1") and families between the 90th and 99th percentile of the wealth distribution ("Next 9"), real estate comprises less than 20%, while equities are nearly half. Pensions are approximately one-quarter of assets for the Next 9.
Wealth levels fell for all groups in the wealth distribution in 2020Q1. The decline was almost all due to the stock market revaluations, which mostly operate through corporate equity and mutual funds, but also through the defined contribution plans included in pension entitlements.7 Due to their greater exposure to equity markets, the Top 1 and Next 9 lost 9 and 6 percent of their wealth in 2020Q1, respectively, whereas the "Next 40" (households between the 50th and 90th percentiles) and the Bottom 50 lost 2 and 4 percent.
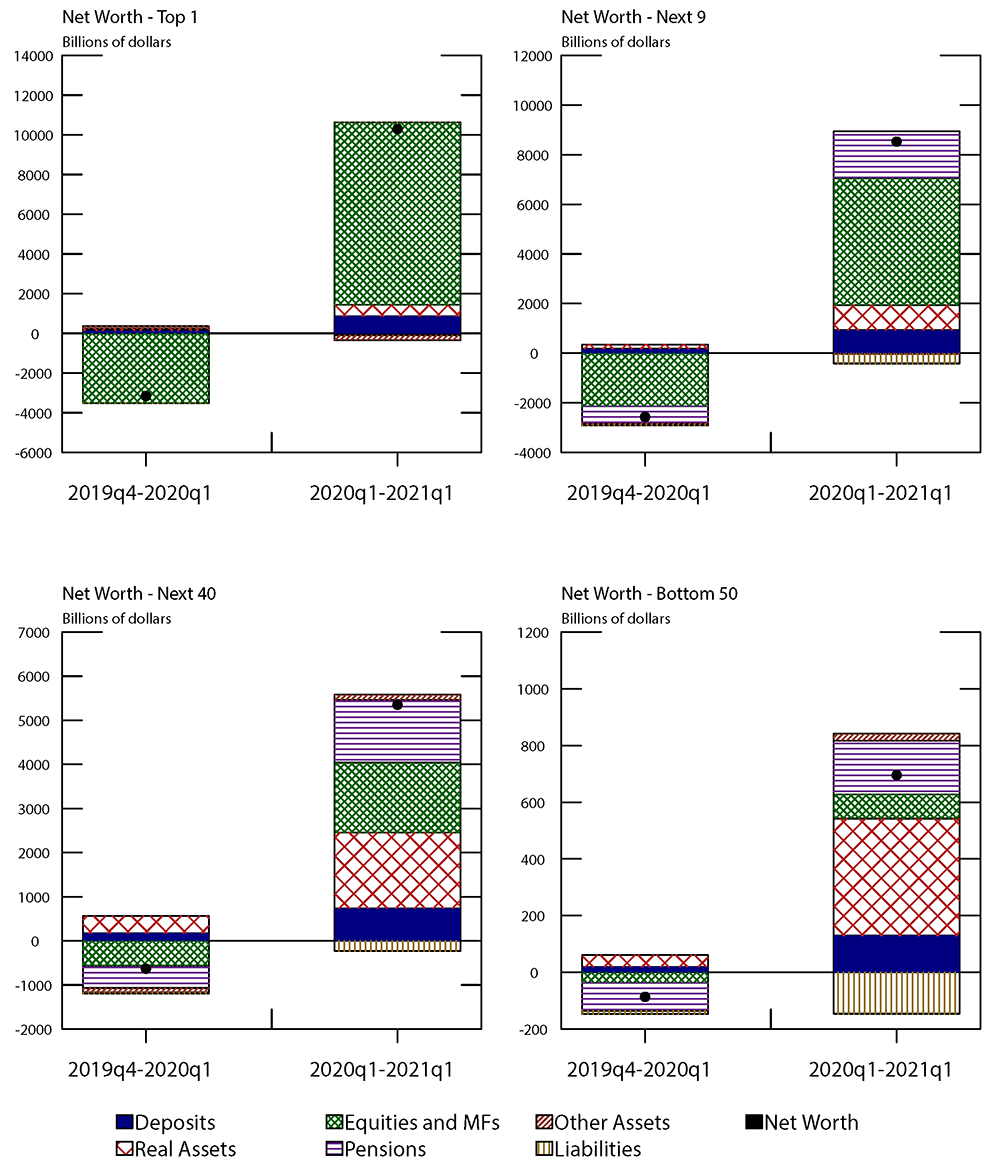
After the 2020Q1 decline, all wealth groups saw gains during the "Rebound" (the change between 2020Q1 and 2021Q1). Stocks recovered quickly and then surpassed previous highs. These market movements drove rapid increases in wealth for the top 10 percent of the wealth distribution. For the Top 1, nearly 90% of total wealth gain in the Rebound is from corporate equities, while equities made up 60% of the gains for the Next 9. For the Next 9, increases in pension entitlements was an additional one-quarter of their total wealth gain. The combination of pensions and equities were also the largest driver of asset increases for the Next 40, making up nearly 60%. This share falls to 40% for the Bottom 50. It is also important to note that a minority of the Bottom 50 benefitted from rising stock market prices since only one-third of these households own any public equity.8
Real estate assets were also large contributors to wealth gains in the Rebound, as house prices rose more than 11 percent, accelerating beginning in 2020Q3. However, compared with corporate equities, housing is a small piece of the Rebound, making up less than 15% of the total net revaluations. That said, real estate assets comprise the vast majority of assets for the Bottom 50; thus, the strong price growth is the largest driver of wealth gains for that group. However, these wealth gains are also not evenly spread across that group since only 40% of Bottom 50 own their home.
Since the SCF reveals that the Bottom 50 consistently holds a larger share of deposits than they do other financial assets, the large increase in their checking and savings balances also contributed meaningfully to wealth gains for the Bottom 50 as projected in the DFA. Overall, the wealth of the Bottom 50 increased by 30%, which is 10-15 percentage points more than any other wealth group. However, since their wealth share is quite small, they received only 3.3% of the total wealth gain during the pandemic.
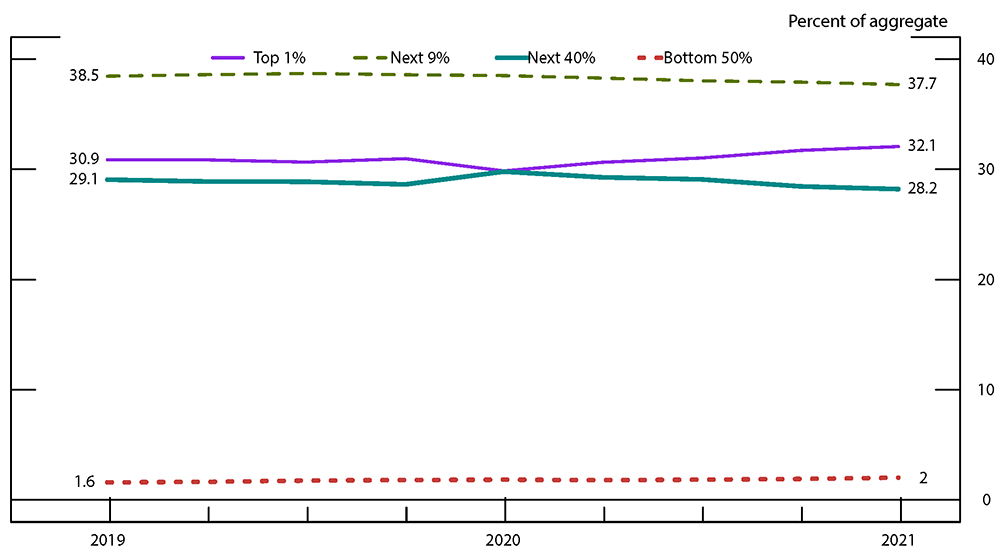
In total, changes in the concentration of wealth were not large in magnitude. The share of wealth going to the Top 1%, which tends to be procyclical, increased 2.2 percentage points in the Rebound periods after falling 1.1 percentage points in 2020q1. Despite their wealth growing at the fastest pace, the small wealth level for the Bottom 50 results in their share only increasing by 0.2 percentage points between 2019Q4 and 2021Q1.
In the DFA, the distribution of wealth by income was also not substantially reshaped in the pandemic. However, unlike the distribution by wealth group, lower income households saw somewhat slower wealth growth compared to high income households. The bottom 40 percent of the income distribution group experienced growth of 8.2% over the full period after only small decline in 2020Q1, and the middle quintile of the income distribution (families between the 40th and 60th percentiles) also experienced slightly slower than average wealth growth, at just over 13%. The primary difference between the DFA projections for the bottom wealth and income groups is how the models based upon historical data allocate the large increases in deposits. Specifically, they project a slight increase in the share of deposits for the Bottom 50 [percent of the wealth distribution] but a slight decrease in the share for the bottom 40 percent of the income distribution. This highlights both how the distributions of wealth and income are distinct, but also the challenges of modeling excess savings during the pandemic, which we turn to in the next section.
While we use the DFA as the starting point for studying wealth during COVID-19, we acknowledge there are major aspects of the pandemic for which the DFA estimation approach does not account. To begin to explore this uncertainty, it is useful to evaluate what portion of the DFA estimates come from assets and liabilities are most likely still represented accurately in these abnormal times. Seeing transaction volumes for assets and liabilities other than deposits were not abnormal in 2020, we assume that there was little active rebalancing of portfolios by households (i.e. the 2019 SCF provides a valid description for these assets). Further, 80% of total wealth gains over the pandemic were from the revaluations of real estate and corporate equities. This grows to 90% when including pensions, which were also driven by stock market movements since 2019. This suggests we should have greater confidence in the DFA results for groups whose portfolios were comprised of more of these assets in the 2019 SCF. The Top 1 percent of the wealth distribution held around 80% of their wealth in equities, businesses, pensions, and real estate in 2019, but falls to 65% for the Bottom 50. The pattern across the income distribution is similar.
Alternative Distributions of Excess Savings
We now turn to exploring how the true evolution of the wealth distribution during the pandemic may deviate from that projected by the DFA. The net effect of the pandemic-specific factors on the distribution of savings is unclear. For example, the categories of spending that declined the most during lockdowns, such as travel and entertainment, are skewed towards affluent households. Further, many of the service sector jobs most disrupted by COVID-19 pay relatively low wages. However, the replacement rates provided by expanded unemployment insurance were often above 100% for lower income workers (Ganong, Noel, and Vavra, 2020), and the Economic Impact Payments phased out for couples earning more than $150,000.
Our goal in this section is to gauge how this uncertainty might alter the DFA measurement of the wealth distribution as of 2021Q1. To do so, we estimate how much of household savings stemmed from pandemic-specific factors ("excess savings"), run the DFA models without these excess savings, and then study the range of outcomes when the excess savings are distributed under alternative scenarios.
As a starting point, we define excess savings as the net increase in asset and liability transactions in 2020 and 2021Q1 over the rate for 2019. This accumulates to $1.8 trillion from 2020Q1-2021Q1.9 Our estimates are similar in magnitude to others, such as Blanchard (2021) and Briggs and Mericle (2021).10 Figure 2 strongly suggests that the vast majority of excess savings flowed into bank accounts rather than were used to pay down debt or were otherwise invested (for additional evidence, see Briggs and Mericle, 2021).11 Thus, for our counterfactual DFA, we subtract the quarterly estimates of excess savings from the levels of savings and checking deposits (split proportionally across these categories). To complete the exercise, we add the excess savings to deposits under three alternative distribution scenarios: 1) equal across the population, 2) roughly halfway between an equal distribution and the baseline DFA, which is heavily skewed towards the wealthy, and 3) entirely to the bottom 50% of the wealth and income distributions. We construct these scenarios for each quarter, and aggregate across the pandemic in order to present them in Table 1, along with the baseline DFA increase [from the previous section] in deposits for comparison. Briggs and Mericle (2021) use the limited available data to distribute the spending cuts, income losses, and government support to quintiles of the income distribution. They find that although excess savings was far from equally distributed, it was considerably less skewed to the top than is estimated by the baseline DFA. Greig, Deadman, and Noel (2021) come to a similar conclusion studying the account balances of JP Morgan Chase banking customers. Thus, we view the "somewhat equal" scenario as the most realistic, but we include the others, particularly the unrealistic, "all to the bottom 50%" scenario to establish bounds.
Table 1: Alternative Distribution Scenarios for 2020 Excess Savings
| Distribution of 2020 Excess Savings | DFA | Equally Distributed | Somewhat Equally Distributed | All to the Bottom 50% | |
|---|---|---|---|---|---|
| Wealth | Top 1 | 33.6% | 1% | 8.4% | 0% |
| Next 9 | 34.8% | 9% | 17.5% | 0% | |
| Next 40 | 25.9% | 40% | 38.6% | 0% | |
| Bottom 50 | 5.8% | 50% | 35.5% | 100% | |
| Income | 99-100 | 32.3% | 1% | 8.1% | 0% |
| 80-99 | 35.0% | 19% | 24.3% | 0% | |
| 60-80 | 17.6% | 20% | 21.3% | 0% | |
| 40-60 | 10.8% | 20% | 17.4% | 20% | |
| 0-40 | 4.4% | 40% | 29.0% | 80% | |
Tables 2 and 3 present the results. The first takeaway is that the significant amount of excess savings did not substantially reshape the wealth distribution. Even under the extreme assumption that all excess savings went to the bottom, the gains in the wealth share of the bottom wealth and income groups are very small compared to the degree of wealth inequality. Although there was a large increase in savings during the pandemic, it was somewhat overshadowed by large price increases in asset classes that are heavily skewed towards the wealthy and remains small compared to the level of household wealth.
Table 2: Net Worth Shares and Growth Rates by Wealth Group
| Net Worth Shares | DFA 2019q4 | DFA 2021q1 | Equally Distributed | Somewhat Equally Distributed | All to the Bottom 50% | |
|---|---|---|---|---|---|---|
| Wealth | Top 1 | 31.0% | 32.1% | 31.6% | 31.7% | 31.6% |
| Next 9 | 38.6% | 37.7% | 37.3% | 37.5% | 37.2% | |
| Next 40 | 28.6% | 28.2% | 28.4% | 28.4% | 27.9% | |
| Bottom 50 | 1.8% | 2.0% | 2.6% | 2.4% | 3.3% | |
| Annual Net Worth Growth Rate: | ||||||
| Wealth | Top 1 | 20.7% | 19.0% | 19.4% | 18.9% | |
| Next 9 | 13.9% | 12.8% | 13.2% | 12.4% | ||
| Next 40 | 14.8% | 15.7% | 15.6% | 13.4% | ||
| Bottom 50 | 30.3% | 70.2% | 57.2% | 114.9% | ||
Table 3: Net Worth Shares and Growth Rates by Income Group
| Net Worth Shares | DFA 2019q4 | DFA 2021q1 | Equally Distributed | Somewhat Equally Distributed | All to the Bottom 50% | |
|---|---|---|---|---|---|---|
| Income | 99-100 | 25.3% | 26.7% | 26.2% | 26.3% | 26.2% |
| 80-99 | 45.1% | 44.0% | 43.8% | 43.9% | 43.5% | |
| 60-80 | 14.9% | 15.4% | 15.4% | 15.4% | 15.1% | |
| 40-60 | 7.4% | 7.2% | 7.3% | 7.3% | 7.3% | |
| 0-40 | 7.3% | 6.8% | 7.3% | 7.1% | 7.8% | |
| Annual Net Worth Growth Rate | ||||||
| Income | 99-100 | 23.1% | 21.0% | 21.5% | 21.0% | |
| 80-99 | 13.9% | 13.3% | 13.5% | 12.6% | ||
| 60-80 | 19.5% | 19.8% | 19.9% | 17.6% | ||
| 40-60 | 13.1% | 15.0% | 14.4% | 15.0% | ||
| 0-40 | 8.2% | 16.3% | 13.8% | 25.2% | ||
In the baseline DFA, wealth for the bottom of the wealth distribution grew at the fastest rate, followed by that of the Top 1. Our alternative scenarios for excess savings do little to alter that conclusion. However, due to their low levels of wealth, this exercise reveals nontrivial uncertainty in the growth rate of wealth held by the bottom half of the wealth distribution. The DFA shows wealth for the Bottom 50 growing by 30% in the pandemic, which increases to 57% in our preferred "somewhat equal" excess savings scenario, 70% if excess savings were equally distributed, and 115% if the savings all went to the bottom. On a per household basis, wealth of the Bottom 50 increased from $31,000 in 2019Q4, to $41,000, $53,000, $49,000, and $67,000 in 2021Q1 under the DFA and three alternative scenarios. Thus, although there is material uncertainty in the evolution of wealth for the Bottom 50 during the pandemic, the qualitative finding of rapid wealth growth for the Bottom 50 relative to other groups holds for the DFA and the alternative scenarios.
When segmenting the population by income, this exercise again reveals little variation in the rate of wealth gain for the top of 60 percent of the distribution, but some uncertainty for the bottom 40 percent. However, the range of plausible growth rates for the bottom 40 of income is lower than that for wealth because per household wealth levels for the lower income groups are substantially higher than for the bottom half of the wealth distribution.
Conclusion
The distribution of wealth has been relatively stable recently despite the massive economic upheaval caused by the COVID-19 pandemic. This is true both in the baseline DFA estimates and in our alternative scenarios for the distribution of excess savings. The stability of the wealth distribution stems from the fact that most of the wealth gained comes from appreciation of assets that were heavily concentrated before the pandemic. The gains on these assets were so large that they dwarf the historic increase in household savings that also occurred, and leave limited margin for the uncertainty of the distribution of excess savings to alter the overall wealth distribution. Our simulation exercise also reveals the challenges of relying upon historical relationships to model the wealth distribution during unprecedented circumstances. Since it has no information about the distributional patterns of income loss, spending declines, or the government response, the DFA likely assigns too much of the large increase in savings to high wealth and income households. Although the effects on the overall wealth distribution are small, the uncertainty due to the pandemic does modestly alter the estimates of changes in wealth experienced by less affluent households in 2020. In particular, our exposition of the alternate distributions of excess savings highlights the significance of the government response in supporting economic well-being of low wealth and income households.
References
Briggs, Joseph and David Mericle, "Pent-Up Savings and Post-Pandemic Spending," Goldman Sachs US Economics Analyst, February 15, 2021.
Blanchard, O J (2021), "In defense of concerns over the $1.9 trillion relief plan," Realtime Economic Issues Watch, Peterson Institute for International Economics, 18 February.
Ganong, Peter, Pascal Noel, and Joseph Vavra, "US unemployment insurance replacement rates during the pandemic," Journal of Public Economics, November 2020.
Greig, Fiona, Erica Deadman, and Pascal Noel, "Family cash balances, income, and expenditures trends through 2021," JPMorgan Chase Institute
1. Excess savings may have elevated balances in other assets but the evidence thus far suggests that vast majority of excess savings by households resides in deposit accounts. Return to text
2. The valuation model is based upon sales data from Zillow. For more details, see, "A New Measure of Housing Wealth in the Financial Accounts of the United States" by Hannah Hall, Eric Nielsen, and Kamila Sommer. Return to text
3. The CARES Act provided fiscal support in 2020, and the Omnibus Appropriations and Coronavirus Relief Package and the American Rescue Plan provided support in 2021. Return to text
4. Transactions for debt securities are calculated as a relatively small residual (roughly ten percent) from the total issuance and holdings of other sectors. Thus, modest measurement error in these other sectors can have a significant effect on households, which likely explains the heightened volatility of that series. Return to text
5. For a description of the DFA methodology see https://www.nber.org/books-and-chapters/measuring-distribution-and-mobility-income-and-wealth/distributional-financial-accounts-united-states. Return to text
6. Even though the amounts of transactions for these assets were affected by the pandemic much less than those for deposits, it is possible that their distributions were atypical. However, given that these transactions were small compared to both the levels and the revaluations for these assets, the effect on their overall distributions would be muted. Note, the Financial Accounts does not show intra-sector transactions, and thus would not reveal if the pandemic caused a large increase in asset sales between households. More granular transactions data suggest this likely does not materially bias the DFA. According to the National Association of Realtors, existing home sales increased 5.6% in 2020, which is less than the increase in real estate transactions in the Financial Accounts. Similarly, trading volumes on the NYSE increased in 2020 over 2019 by a smaller amount than the increase in net transactions of household's corporate equities and mutual funds in the Financial Accounts. Return to text
7. Pension entitlements include both 401(k)-type accounts and defined benefit accumulations, with the former being directly affected by revaluations. Return to text
8. Including exposure to equities held through defined contribution pension plans. Return to text
9. We use the 2019 transactions as the 2020 counterfactual for simplicity, and because it aligns well with other estimates of excess savings for this period. If we instead project the 2020 counterfactual using the positive, but insignificant, trend in net transactions between 2016 and 2019, the excess savings would fall to $1.6 trillion, and the results below would roughly scale accordingly. The $1.8 trillion of excess savings is a net effect of a $2.05 trillion increase in asset inflows, less a $250 billion increase in liability inflows. Return to text
10. We compare our estimates for 2020 excess savings since these sources go through 2020q4. Return to text
11. Although consumer credit was flat as spending was subdued and some of the fiscal support went towards debt, had consumer credit grown at the same rate it had in recent years, the increase in net worth would only decline by 0.25%. Return to text
Batty, Michael, Ella Deeken, and Alice Henriques Volz (2021). "Wealth Inequality and COVID-19: Evidence from the Distributional Financial Accounts," FEDS Notes. Washington: Board of Governors of the Federal Reserve System, August 30, 2021, https://doi.org/10.17016/2380-7172.2980.
Disclaimer: FEDS Notes are articles in which Board staff offer their own views and present analysis on a range of topics in economics and finance. These articles are shorter and less technically oriented than FEDS Working Papers and IFDP papers.