FEDS Notes
May 30, 2019
Assessing the Resiliency of the Banking Industry to a Commercial Real Estate Price Shock
Summary
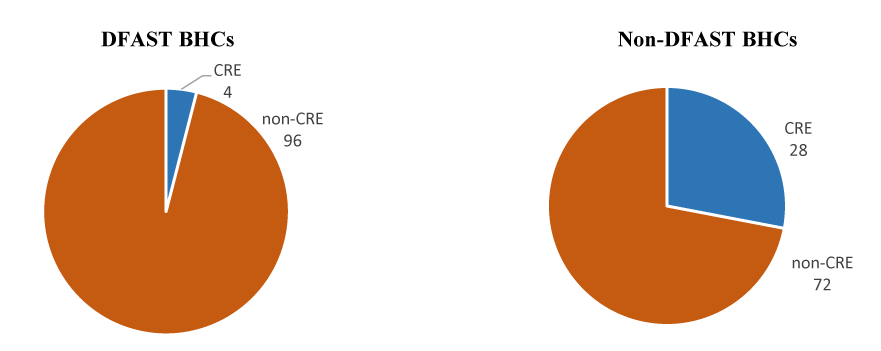
Given the valuation pressures in the commercial real estate (CRE) market, this note explores the resiliency of the banking industry to a sudden CRE price decrease. Assessing this resilience is important because the banking industry holds more than half of the $4.5 trillion in debt that funds CRE (table 1). While the annual Dodd-Frank Act stress test (DFAST) process assesses the resiliency of large bank holding companies (BHCs) to a CRE price decrease, BHCs that are not subject to DFAST (non-DFAST BHCs) hold more than half of the CRE loans in the banking system, and a much larger percent of non-DFAST assets are held in the form of CRE loans (figure 1).2 In order to assess the resiliency of the non-DFAST BHCs, this note uses the loan-loss rate information in the public disclosure documents from DFAST 2017 and 2018.
Table 1: CRE Debt Magnitudes and Shares by Lender Type
| Nonfarm nonresidential | |||||
|---|---|---|---|---|---|
| Total CRE | Owner Occupied(a) | Income Generating | Multifamily | Construction & Land Development(a) | |
| Total [trillions] | 4.5 | 0.4 | 2.5 | 1.4 | 0.2 |
| Percent held by: [percent] | |||||
| Banks and Thrifts | 55 | 100 | 55 | 34 | 100 |
| Life Insurers(b) | 12 | 0 | 19 | 6 | 0 |
| GSEs and Agency CMBS | 15 | 0 | 0 | 48 | 0 |
| Non-Agency CMBS(c) | 9 | 0 | 14 | 3 | 0 |
| Finance Companies | 1 | 0 | 1 | 0 | 0 |
| Nonfinancial | 5 | 0 | 5 | 9 | 0 |
Note: Totals may not sum to 100 percent due to rounding. CMBS is commercial mortgage-backed securities. GSE is government-sponsored enterprises.
(a) The 100% attribution of these loans to banks is an approximation. Life insurers and finance companies may provide funding to selected deals. Currently collected data cannot capture this activity, although nonbank institutions hold little of debt secured by construction or owner occupied properties.
(b) This row also includes other long-term investors (such as property & casualty insurers and pension funds), though life insurers account for almost all of the category.
(c) This row also includes REITs, though non-agency CMBS accounts for almost all of the category.
Source: Federal Reserve Board, Form FR Y-9C, Consolidated Financial Statements for Bank Holding Companies; Financial Accounts of the United States, Z.1 release (December 31, 2018).
Source: Federal Reserve Board, Form FR Y-9C, Consolidated Financial Statements for Bank Holding Companies.
The 2018 DFAST scenario assumes a CRE price decline of 40 percent, and the 2017 scenario has a decline of 35 percent. Partly as a result, the CRE loan-loss rate during the 9-quarter time horizon and averaged across the DFAST BHCs is 8.3 percent in 2018 versus 7.3 percent in 2017.3 If that 2018 average loss rate is applied to the CRE balances held by non-DFAST BHCs in the fourth quarter of 2018, the CET1 ratio for 8 BHCs out of 226 falls below the 4.5 percent regulatory minimum. These BHCs that did not meet the regulatory minimum make up only 0.7 percent of banking system assets, but include two BHCs with more than $30 billion in total assets.
However, using the average loss rate can be misleading. First, risk is substantially different across CRE loan types. In particular, construction and land development (CLD) loans are much more risky than multifamily loans. Second, while the composition of CRE loans among non-DFAST BHCs is similar to DFAST BHCs (figure 2), it can vary substantially at the BHC level. After using loss rates that account for CRE type and loan risk, eleven non-DFAST BHCs fall below the 4.5 percent capital minimum, making up 0.8 percent of banking system assets.
In addition, banks change behavior long before reaching the mandatory minimum. Undercapitalized banks typically restrict lending. For example, Carlson, Shan, and Warusawithrana (2013) show that the relationship between lending and capital becomes stronger when capital ratios are lower. Lending contracted more for low-capital banks, especially during the financial crisis.4 If a bank falls below a CET1 ratio of 7.0 percent (minimum + capital conservation buffer), it is subject to restrictions on dividends and management compensation. Using the 7 percent threshold, 80 BHCs fall below, and these BHCs make up 22 percent of CRE loans and 4.5 percent of assets in the banking system. Severe CRE price declines could adversely affect lending at the non-DFAST BHCs, especially where these impacted banks are concentrated.
![Figure 2. Composition of CRE Loans [Percent, December 31, 2018]. See accessible link for data description.](/econres/notes/feds-notes/Fig2_20190528.png)
Note: Numbers may not add due to rounding.
Source: Federal Reserve Board, Form FR Y-9C, Consolidated Financial Statements for Bank Holding Companies.
These BHC-level results can also be merged with deposit share data to assess risk at the geographic level. This data merge implies that a bank's CRE lending is focused in geographic areas where the bank has a branch presence, which is consistent with such loans generally needing local support and expertise, as well as the requirements of the Community Reinvestment Act. Using the average DFAST 2018 loan-loss rates and the 7.0 percent CET1 threshold, nine states have at least 10 percent of their deposit base held by BHCs that would be solvency-constrained by such a scenario. Using the most conservative loan-loss model presented in this note, there are thirteen such states, including five states with more than 15 percent deposit base exposure.
Overall, the results presented in this note suggest that the banking system is resilient to a CRE price shock. However, the most conservative model implies that solvency-constrained banks would hold a substantial portion of CRE loans, and those banks are more concentrated in certain geographic areas. These pockets of concentrated risk may be more adversely affected by CRE price declines.
Loan-Loss Rate Analysis
As a first test of the resiliency of the banking industry to a CRE price decline, the publicly available CRE loan-loss rates from DFAST 2018 are used. Specifically, the average 9-quarter CRE loss rate across the DFAST BHCs is applied to the non-DFAST BHCs. Applying the same loss rate appears to be a reasonable assumption because the aggregate composition of CRE loans across the two groups are similar (figure 2). The loss rate is applied instantaneously, and the common equity tier 1 (CET1) ratio is recalculated.5 Because the 9-quarter loss rate is applied immediately and because the denominator is not adjusted, this post-stress CET1 ratio is conservative. This construction does not allow the BHC to use the 9-quarter period to gain earnings which rebuild capital, and the defaulted loans are not reduced from the denominator.6 Given their high exposure to CRE, non-DFAST BHCs incur a substantial loss of capital under this stress analysis, but as a group, their CET1 ratio remains above 9 percent as of the fourth quarter of 2018 (compared with a benchmark of 7 percent, reflecting the Basel III minimum of 4.5 percent plus the capital conservation buffer of 2.5 percent.). Likely in part because the assumed CRE price decline was smaller in 2017, the impact on capital is smaller using 2017 DFAST loss rates.7
Turning to the BHC level data, there are 226 BHCs in the non-DFAST group. Of these, eight fall below the 4.5 percent CET1 ratio minimum when the average 2018 DFAST loss rate on CRE is applied (table 2, column 1). Of the BHCs that did not meet the regulatory minimum, two of them have more than $30 billion in total consolidated assets.8 Overall, this group holds 4.6 percent of CRE loans and 0.7 percent of assets in the banking industry. In addition, six of these BHCs hold CRE loans above at least one of the supervisory guidance concentration thresholds and, as a result, are subject to more stringent risk management oversight.9
Table 2: Summary of Resiliency Tests for Non-DFAST BHCs
| (1) | (2) | (3) | (4) | (5) | (6) | |
|---|---|---|---|---|---|---|
| Average Loss Rate | Modeled Loss Rate | Quantile Loss Rate | ||||
| 2018 | 2017 | 2018 | 2017 | 2018 | 2017 | |
| Total number of non-DFAST BHCs | 226 | 226 | 226 | 226 | 226 | 226 |
| After applying CRE loss rate: | ||||||
| BHCs below 4.5 percent CET1 [number] | 8 | 8 | 6 | 2 | 11 | 5 |
| as a percent of banking assets [percent] | 0.7 | 0.7 | 0.3 | 0.1 | 0.8 | 0.3 |
| BHCs below 7.0 percent CET1 [number] | 59 | 59 | 67 | 48 | 80 | 62 |
| as a percent of banking assets [percent] | 3.4 | 3.4 | 3.7 | 2.7 | 4.5 | 3.1 |
Source: Federal Reserve Board, Form FR Y-9C, Consolidated Financial Statements for Bank Holding Companies;
DFAST 2017 results, https://www.federalreserve.gov/newsevents/pressreleases/bcreg20170622a.htm;
DFAST 2018 results, https://www.federalreserve.gov/newsevents/pressreleases/bcreg20180621a.htm.
Using the average CRE loan-loss rate ignores the underlying compositions of different banks' CRE loan portfolios. CRE loans have very different risk profiles, with CLD loans being much more risky than nonfarm nonresidential (NFNR) loans or multifamily loans. In order to generate loss rates for each property type, the reported CRE loss rates for the DFAST BHCs in a given year are regressed on CRE composition shares.10
$$$$ {CRE\ loss\ rate} = \alpha + \beta_1 {multifamily\ share} + \beta_2 {NFNR\ share} $$$$
The estimated coefficients are then used to project CRE loss rates for the non-DFAST BHCs. For DFAST 2018, the modeled CLD loss rate is 18.2 percent, multifamily is 4.8 percent, and NFNR is 7.5 percent. After applying these modeled loss rates, overall, the aggregate capital level for the non-DFAST BHC group is about the same as when the average loss rate was used.
At the individual BHC level, if the projected 2018 CRE loss rates by subcategory are applied to the non-DFAST BHCs, six BHCs have adjusted CET1 ratios below the 4.5 percent requirement (table 2, column 3). For example, 80 percent of NY Community's CRE portfolio consists of multifamily loans, and so it no longer falls below the regulatory minimum. Overall, these BHCs are much smaller, comprising 1.9 percent of CRE loans and 0.3 percent of assets in the banking industry.11 Using the 7.0 percent CET1 threshold, 67 BHCs become capital constrained. These BHCs make up 18 percent of CRE loans and 3.7 percent of assets in the banking industry. Thirty-one of the 67 BHCs exceed at least one of the CRE concentration thresholds.
By construction, the modeled loss rates using a simple regression are based on the average loss rate associated with each loan type. By instead using a quantile regression, other parts of the distribution can be used to estimate loss rates. As an alternative model, the 75th percentile is used from such a quantile regression. This model captures not only the risk of the various CRE types but some of the loan characteristic risk. Because the DFAST model that generated the loss rates has detailed loan information such as property location, loan-to-value, and borrower information, DFAST BHCs with higher than average loss rates are underwriting loans with more risky characteristics. As a result, loss rates from this quantile model are much more conservative for interpreting vulnerabilities in the banking system. Using the DFAST 2018 loss rates, the quantile model at the 75th percentile generates loan-loss rates of 20.5 percent for CLD, 6.0 percent for multifamily, and 8.1 percent for NFNR.
At the individual BHC level, if these quantile loss rates are applied to the non-DFAST BHCs, eleven BHCs have adjusted CET1 ratios below the 4.5 percent requirement (table 2, column 5). These BHCs comprise 5.3 percent of CRE loans and 0.8 percent of assets in the banking industry.12 Using the 7.0 percent CET1 threshold, 80 BHCs become capital constrained. These BHCs make up 22 percent of CRE loans and 4.5 percent of assets in the banking industry. Thirty-five of the 80 BHCs exceed at least one of the CRE concentration thresholds.
Geographic Analysis
Geographic concentration is an alternative framework for assessing vulnerability. The Federal Deposit Insurance Corporation (FDIC) annually publishes data on the deposit levels at the branch level in the Summary of Deposits data. These data can be used to approximate the level of activity of banks in geographic markets by using the deposits as weights. For example, based on the CRE concentration thresholds and deposit shares, some states have more exposure to banks with high CRE concentrations, suggesting that those states may be more adversely affected by CRE price declines. Table 3a-b summarizes states with the largest of these exposures.
Table 3a: States with Exposure to BHCs with CRE Concentrations by Deposit Share
| CRE Concentration | |
|---|---|
| State | Share of State Deposits [percent] |
| Arkansas | 19.0 |
| Tennessee | 15.9 |
| New Jersey | 12.6 |
| Oklahoma | 12.2 |
| North Dakota | 10.8 |
| Iowa | 10.0 |
| Maryland | 8.9 |
| District Of Columbia | 7.9 |
| Nebraska | 7.6 |
| Virginia | 5.9 |
Table 3b: States with Exposure to BHCs with CLD Concentrations by Deposit Share
| CLD Concentration | |
|---|---|
| State | Share of State Deposits [percent] |
| Oklahoma | 12.8 |
| Tennessee | 12.8 |
| Arkansas | 12.4 |
| District Of Columbia | 6.0 |
| Maryland | 5.8 |
| Texas | 5.4 |
| Wyoming | 4.5 |
| Kansas | 4.3 |
| Louisiana | 4.1 |
| Colorado | 3.9 |
Source: Federal Deposit Insurance Corportion, Summary of Deposits (June 2018); Federal Financial Institutions Examination Council, Form FFIEC 031, Consolidated Reports of Condition and Income for a Bank with Domestic and Foreign Offices, and Form FFIEC 041, Consolidated Reports of Condition and Income for a Bank with Domestic Offices Only (December 31, 2018).
Similar geographic analysis can be performed by replacing the CRE-concentrated BHCs with the capital-constrained BHCs from the DFAST loan-loss rate analysis above. Table 4a-c summarizes those results by listing the states with the highest exposure to BHCs that have less than 7 percent of CET1 capital after applying the various loss rates: average, modeled, and quantile. Under the most conservative model (quantile, table 4c), five states have at least 15 percent of their deposit base held by solvency-constrained BHCs.
Table 4a: States with Exposure to BHCs with High Estimated CRE Losses Relative to Capital
| Average DFAST 2018 | |
|---|---|
| State | Share of State Deposits [percent] |
| Arkansas | 17.5 |
| Pennsylvania | 13.4 |
| Oregon | 13.2 |
| Iowa | 12.8 |
| Alabama | 12.3 |
| Tennessee | 11.3 |
| New Jersey | 10.4 |
| North Dakota | 10.1 |
| Washington | 9.8 |
| Georgia | 9.8 |
Table 4b: States with Exposure to BHCs with High Estimated CRE Losses Relative to Capital
| Modeled DFAST 2018 | |
|---|---|
| State | Share of State Deposits [percent] |
| Arkansas | 33.8 |
| Iowa | 14.8 |
| Oklahoma | 14.2 |
| Tennessee | 13.6 |
| Oregon | 13.2 |
| Alabama | 12.9 |
| Pennsylvania | 11.8 |
| Georgia | 11.1 |
| Mississippi | 10.4 |
| North Dakota | 10.1 |
Table 4c: States with Exposure to BHCs with High Estimated CRE Losses Relative to Capital
| Quantile DFAST 2018 | |
|---|---|
| State | Share of State Deposits [percent] |
| Arkansas | 33.8 |
| Vermont | 28.7 |
| Oklahoma | 17.0 |
| Tennessee | 16.2 |
| Connecticut | 15.9 |
| Iowa | 14.9 |
| Alabama | 14.2 |
| Pennsylvania | 13.4 |
| Oregon | 13.2 |
| Georgia | 11.3 |
Source: Federal Deposit Insurance Corportion, Summary of Deposits (June 2018); Federal Financial Institutions Examination Council, Form FFIEC 031, Consolidated Reports of Condition and Income for a Bank with Domestic and Foreign Offices, and Form FFIEC 041, Consolidated Reports of Condition and Income for a Bank with Domestic Offices Only (December 31, 2018); Federal Reserve Board, Form FR Y-9C, Consolidated Financial Statements for Bank Holding Companies; DFAST 2018 results, https://www.federalreserve.gov/newsevents/pressreleases/bcreg20180621a.htm.
References
Carlson, Mark, Hui Shan, and Missaka Warusawitharana. "Capital Ratios and Bank Lending: A Matched Bank Approach." Journal of Financial Intermediation 22 (2013): 663–687.
Gambacorta, Leonardo and David Marques-Ibanez. "The Bank Lending Channel: Lessons from the Crisis." Economic Policy 26, no. 66 (2011): 135–182.
Van den Heuvel, Skander. "Does Bank Capital Matter for Monetary Transmission?" Economic Policy Review 8, no. 1 (2002): 259–265.
1. The analysis in this FEDS Note is based entirely on publicly available information. I thank William Bassett, Jose Berrospide, and Andrew Cohen for comments. I also thank Kevin Kiernan for excellent research assistance. Return to text
2. For this memo, the DFAST BHC group is defined using the BHCs subject to the 2018 test. Those BHCs are: Ally Financial, American Express, Bank of America, Bank of New York Mellon, Barclays, BB&T, BBVA Compass, BMO Financial, BNP Paribas USA (formerly BancWest), Capital One, Citigroup, Citizens Financial, Credit Suisse, Deutsche, Discover, Fifth Third, Goldman Sachs, HSBC, Huntington, JPMorgan, KeyCorp, M&T Bank, Morgan Stanley, MUFG, Northern Trust, PNC Financial, RBC USA, Regions Financial, Santander, State Street, SunTrust, TD Group, UBS, U.S. Bancorp, and Wells Fargo. The non-DFAST BHC group is defined by the remaining BHCs that file a FR Y-9C form. All BHCs above $3 billion in consolidated assets are required to file this form. As of December 31, 2018, there were 226 such BHCs. Return to text
3. Loss rates on CRE loans are also importantly influenced by the BBB corporate spread and residential housing prices, both of which were also more severely stressed in 2018 than in 2017. Return to text
4. Other papers also support the finding that capital is important for lending during financial stress. For example, see Gambacorta and Marques-Ibanez (2011). As modeled by Van den Heuvel (2002), low-capital banks will forgo profitable lending opportunities to lower the risk of future capital shortfalls, even when the capital requirement is not currently binding. Return to text
5. Post-stress CET1 ratio = (CET1 – (CRE loss rate * CRE loans)) / risk-weighted assets. Return to text
6. In order to adjust risk-weighted assets, the appropriate risk-weight would need to be assumed. Return to text
7. The DFAST 2018 results are available here https://www.federalreserve.gov/publications/files/2018-dfast-methodology-results-20180621.pdf. The CRE modeling variables are discussed on page 65. The firm-specific results with loan losses begin on page 80. The DFAST 2017 results are available here https://www.federalreserve.gov/publications/files/2017-dfast-methodology-results-20170622.pdf. Return to text
8. The two largest BHCs are NY Community Bancorp ($52 billion) and Valley National Bancorp ($32 billion). Return to text
9. In 2006, the federal banking agencies issued the Interagency Guidance on Concentrations of Commercial Real Estate (SR 07-1). This guidance sets exposure thresholds as a percent of total risk-based capital that warrant greater regulatory scrutiny; specifically, the thresholds are non-owner occupied CRE loans larger than 300 percent and non-owner occupied CRE growth of 50 percent over past 3 years, or CLD loans larger than 100 percent. The guidance also spells out sound risk management practices for banks with high CRE exposures and states that banks must hold capital commensurate with the risk profile of their CRE exposures. The guidance is at the bank level. For this note, bank data are aggregated to the BHC level, and the threshold ratios are assessed at the BHC level. Return to text
10. For collinearity reasons, one of the three CRE loan categories needs to be dropped. The excluded category is CLD loans. The results are robust to the exclusion category. BHCs with below $5 billion in CRE loans were excluded from the regression. Return to text
11. The two largest BHCs are Valley National and Independent Bank ($10 billion). Return to text
12. The two largest BHCs are NY Community Bancorp and Valley National Bancorp. Return to text
Vojtech, Cindy M. (2019). "Assessing the Resiliency of the Banking Industry to a Commercial Real Estate Price Shock," FEDS Notes. Washington: Board of Governors of the Federal Reserve System, May 30, 2019, https://doi.org/10.17016/2380-7172.2380.
Disclaimer: FEDS Notes are articles in which Board staff offer their own views and present analysis on a range of topics in economics and finance. These articles are shorter and less technically oriented than FEDS Working Papers and IFDP papers.