FEDS Notes
July 08, 2021
Banks' Backtesting Exceptions during the COVID-19 Crash: Causes and Consequences
Alice Abboud, Chris Anderson, Aaron Game, Diana Iercosan, Hulusi Inanoglu, and David Lynch
1. Introduction
Due to the market crash and heightened market volatility in the beginning of the COVID-19 outbreak, banks faced dramatic increases in their market risk capital requirements. Part of this increase was a straightforward consequence of volatility: higher market volatility raises banks' Value at Risk1 (VaR) estimates that then directly increase capital requirements. However, another part of this potential increase was due to banks' numerous backtesting exceptions.2
Under the current market risk rule, banks compute part of their capital requirements by multiplying their VaR estimates by a backtesting multiplier. If banks experience many daily exceptions, then the backtesting multiplier increases and capital requirements automatically rise. The intent of the rule is to treat estimates from poorly-specified VaR models more conservatively.
During the COVID-19 crash, banks experienced simultaneous backtesting exceptions that, without intervention, would have increased their backtesting multipliers and raised market risk capital requirements by $3.3 billion. U.S. regulators felt that these exceptions may have reflected unusual market conditions rather than misspecified VaR models, so they prevented this capital increase by first temporarily capping banks' backtesting multipliers to prior values and then later excluding all backtesting exceptions incurred between March 6, 2020, and March 27, 2020.
This note provides background on how backtesting exceptions affect market risk capital requirements, analyzes the sources of banks' backtesting exceptions during this period, and describes regulators' actions in further detail. The main takeaways of these analyses are: (1) market benchmarks and the majority of risk factors used in valuation were extraordinarily volatile during the beginning of the COVID-19 outbreak, and frequently far more volatile than during the 2008 Great Financial Crisis (GFC)3; (2) banks' backtesting exceptions were associated with many different markets, but credit and interest rates were particularly important; (3) other benchmark VaR models would have experienced a similar number of exceptions during the same period; and (4) while banks experienced losses on their inventory held at the beginning of each day, they more than compensated for those losses with intraday trading revenues. Most of the analysis of the source of exceptions relies upon confidential bank data on exceptions, associated trading losses, and associated risk factor movements that banks submitted as part of an ad hoc voluntary data request.
2. Backtesting exceptions and capital requirements
We begin by reviewing the relevant portions of the market risk capital framework and how backtesting exceptions can increase capital requirements. An important input to calculating market risk capital requirements is a Value at Risk (VaR) estimate. VaR is an estimate of a specified percentile of the forecasted profit and loss (P&L) distribution, which varies over time as market conditions and portfolio compositions change. Stressed VaR must be based on data from the most stressed period, which, prior to the COVID-19 crash, almost always meant data from the 2008 financial crisis. For trading book positions, under the Market Risk Rule (MRR), a bank must calculate the capital requirement for market risk, which equals VaR plus stressed VaR, both multiplied by a backtesting multiplier, and other components outside of the scope of this note.4
The backtesting multiplier is determined by the banks' backtesting performance. The MRR requires backtesting, where a bank must compare each of its most recent firm-level 250 business days' trading Hypothetical P&L with the corresponding daily VaR. Hypothetical P&L is defined as P&L from the existing portfolio (i.e., the portfolio as held on the day the VaR forecast for the following day was estimated) excluding fees, commissions, reserves, net interest income, and intraday trading, which is distinct from Actual P&L, which would include these cash flows. Intraday new position P&L5 (i.e., P&L on positions entered on the day following the VaR forecast) is not included as part of Hypothetical P&L, and is therefore not counted as part of backtesting. Essentially, backtesting is performed as if a firm held the previous day's existing portfolio constant since the VaR estimate only applies to that portfolio and does not account for future trading activities. As a result, firms on a given day may have new position P&L gains (losses) that are sufficient to offset losses (gains) from Hypothetical P&L even on days when exceptions occur. Banks must identify the number of exceptions (i.e., the number of business days for which the hypothetical P&L, if any, exceeds the corresponding VaR estimate) that have occurred over the preceding 250 business days. The resulting number of exceptions is used as a key factor in determining a bank's backtesting multiplier.
Developed initially in 1996 by the Basel Committee on Banking Supervision (BCBS Basel Amendment 1996), the purpose of the backtesting multiplier is to incentivize banks to improve and refine their risk measurement models such that actual trading results are close enough to model-generated risk measures. The initial multiplier used in the required capital calculation applied to VaR and stressed VaR is set at 3 to allow a sufficient capital buffer for losses that the VaR model may not capture, however, firms with a large number of exceptions over the previous year, which indicates a poorly performing internal VaR model, are subject to higher multipliers, as given in the table below.
Table 1: Multiplication Factors Based on Results of Backtesting
| Number of exceptions | Multiplication factor |
|---|---|
| 4 or fewer | 3.00 |
| 5 | 3.40 |
| 6 | 3.50 |
| 7 | 3.65 |
| 8 | 3.75 |
| 9 | 3.85 |
| 10 or more | 4.00 |
Source: Market Risk Rule §217.204.
The multiplier can have a material impact on market risk capital requirements. The backtesting multiplier6 provided in the table above is then applied to both VaR-based and stressed VaR-based capital requirements, until the following quarter's backtesting results are available. The backtesting multiplier is intended to offset uncertainties due to model misspecification, and more specifically the misspecification of the tail of the return distributions and potential time-variation of return distributions (Stahl, 1997). However, a backtesting exceedance might also occur due to reasons other than deficiencies in the VaR model, namely: stress market shocks, data issues in computing P&L, and operational difficulties.
Procylicality, within the framework of regulatory capital, arises when capital requirements increase during times of market stress. During stress, banks' capital positions may already be depleted, and regulations which require additional capital to be held may further exacerbate market stress and lead to further volatility in trading markets. There is a balance that must be struck between penalizing poor model performance and inducing unwanted procyclicality. The backtesting multiplier is one mechanism that could induce procyclicality for capital requirements, and is a main area of interest for capital, given that the primary federal regulator7 has the authority to direct a bank to apply a different multiplier to its VaR and stressed VaR-based measures.
3. Banks' performance during the COVID-19 crash
3.1. Sources of backtesting exceptions
Throughout March 2020, during the early stages of the COVID-19 outbreak, banks suffered ongoing large losses that led to a dramatic increase in backtesting exceptions. We found that these backtesting exceptions were driven by large movements across many different markets, although movements in credit and rates markets were associated with more backtesting exceptions and larger losses. We also simulated the performance of other benchmark VaR models and found that those VaR models would have also experienced as many exceptions or more as banks' VaR models during the same period, indicating that exceptions were driven more by unusual market conditions rather than model deficiencies.
To understand the sources of these exceptions, we collected additional information from banks relating to movements in relevant risk factors and data at the line of business (LoB) level. We collected responses from 9 systemically important banks (defined as those supervised by the Large Institution Supervision Coordinating Committee) and 16 non-systemically important banks.
Figure 1 aggregates exceptions across all banks in our sample, separately highlighting systemic and non-systemic banks. Across both types of banks, the number of backtesting exceptions jumped around the beginning of March 2020 and remained elevated until close to the end of the month. The figure superimposes percentage changes in the S&P 500 and the VIX, showing that the backtesting exceptions occurred amid high realized stock market volatility.
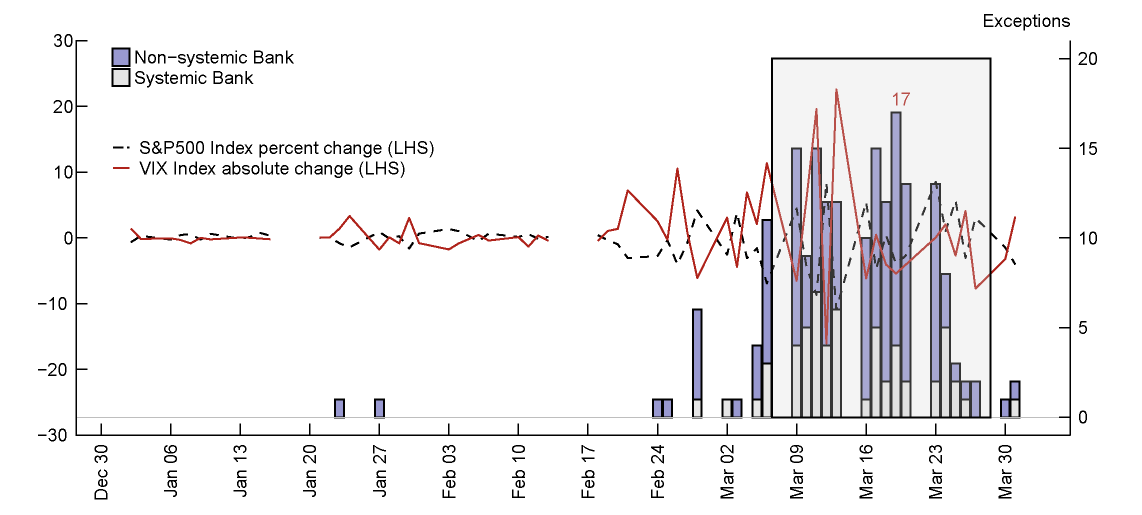
Note: Key identifies from top to bottom. Shaded gray area represents the backtesting exceptions window from March 6, 2020, to March 27, 2020, explained in section 4.
Source: Supervisory data from banks and Bloomberg. Systemic banks are defined as those that are supervised by the Large Institution Supervision Coordinating Committee.
Next, we examined how these exceptions and their associated losses were associated with major lines of business (LoBs). Due to data availability, we focused on the 9 systemically important banks' data for the LoB analysis. Since banks name and operate LoBs differently, we mapped bank-provided asset classifications to four broad LoBs: Credit, rates, equity, and other. The "other" category aggregates the foreign exchange, commodities, and securitizations LoBs. Individual exceptions were frequently mapped to multiple LoBs, so the sum of mapped exceptions across LoBs is not equal to the overall number of exceptions. Banks also provided information breaking down the losses surrounding an exception across the different LoBs. For example, a bank might break down a $100 million overall loss into $40 million in interest rate-related losses and $60 million in equity-related losses.
Table 2 shows, for systemically important banks during 2020 Q1, the number of BHC-level backtesting exceptions mapped to each LoB as well as the sum of related hypothetical losses. All LoBs were associated with backtesting exceptions, although the credit and rates LoBs had the strongest associations. The credit and rates LoBs were associated with 50 and 32 exceptions respectively. Meanwhile, the other LoBs were associated with 25 exceptions—although each subcomponent was individually associated with fewer than 15 exceptions—and the equity LoB was associated with 20 exceptions. Additionally, credit and rates contributed the most to the BHC losses with $2.3 billion and $1.7 billion in losses respectively, which are both substantially larger than either the equity LoB or the aggregated other LoBs.
Table 2: Attributing systemically important banks’ backtesting exceptions to lines of business in 2020 Q1
| Line of Business (LoB) | Number of exceptions associated with LoB | Total losses (thousands, USD) |
|---|---|---|
| Credit | 50 | (2,310,272) |
| Rates | 32 | (1,743,817) |
| Equity | 20 | (901,948) |
| Other | 25 | (1,318,106) |
| BHC Total | 57 | (6,274,143) |
Note: Multiple LoBs can contribute to the same BHC-level backtesting exception. Therefore, the sum of the "Number of exceptions to which LoB contributes" column across LoBs will not equal the total number of BHC-level exceptions.
Figure 2 aggregates these associated hypothetical losses by days when a bank experienced a BHC-level exception. It does not include LoBs that aggregated to a positive profit or profits or losses of banks that did not experience a backtesting exception. Exceptions were associated with credit losses throughout the COVID-19 crash, whereas losses in rates occurred earlier and losses in equities and other LoBs occurred later. Section 3.2 describes the market movements associated with these exceptions in greater depth. Ultimately, while credit and rates-related losses were larger than others, no single LoB was the dominant driver of exceptions.
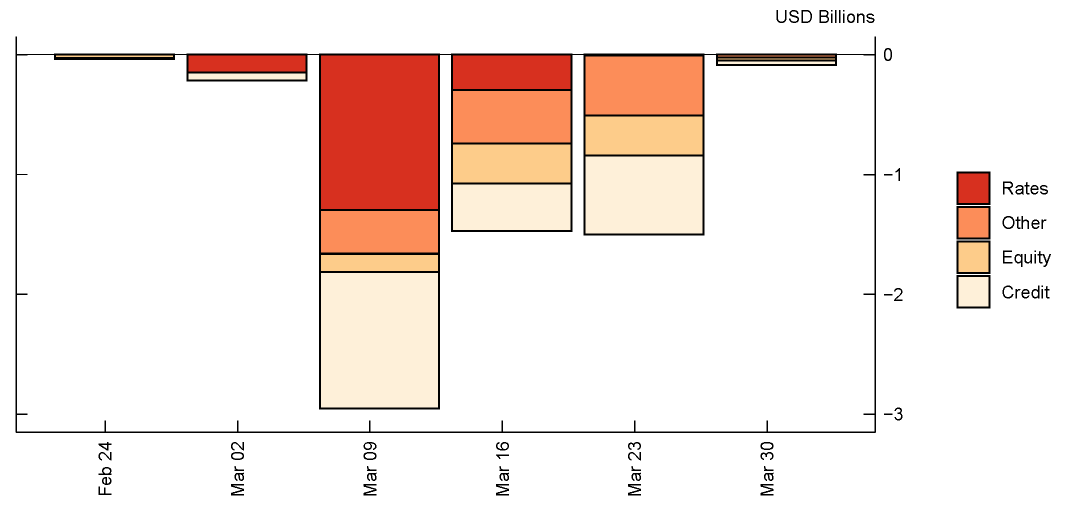
Note: Key identifies from top to bottom.
Source: Supervisory data from 9 systemic banks. Systemic banks are defined as those that are supervised by the Large Institution Supervision Coordinating Committee. Categories appear in order according to legend. Feb 24 mostly shows Equity; Mar 02 only shows Rates and Credit; and Mar 30 shows Other, Equity, and Credit.
Finally, we investigated the extent to which banks' sustained backtesting exceptions reflected a problem with their VaR models versus unusual market conditions. To compare banks' performance, we constructed several portfolios and considered how several different types of VaR models would have performed throughout the first quarter of 2020. The portfolios that we used included the S&P 500 index, the S&P US treasury bond total return index, the Bloomberg Barclay's US corporate investment grade unhedged index, and an equally-weighted combination of the three previous indices. These portfolios represent an equity portfolio, a treasury portfolio, a corporate bond portfolio and a portfolio that represents a diversified portfolio across the three asset classes.
For the VaR models, we used both historical simulation models, which estimate VaR using the distribution of daily returns over the previous year, as well as GARCH(1, 1) models that can react more quickly to market volatility (see Christoffersen (2012) for further details on these types of models). Additionally, to reflect possible operational problems, some specifications include a week-long or two-week-long data lag, reflecting how banks sometimes take time to load the most recent market data into their models, and different GARCH parameter update frequencies. Supporting the idea that data and parameter lags may have been an issue, Anderson and Mawhirter (2020) show that banks' trading desk-level VaR models were slow to incorporate new information during the COVID-19 crash. We consider the GARCH(1, 1) with daily data and daily parameter updating to be our best-case benchmark model. While banks' actual VaR models may involve multivariate volatility modeling that could theoretically improve performance, O'Brien and Szerszeń (2017) show that a simple univariate GARCH applied to P&L often outperforms banks' own models.
Table 3 shows the number of exceptions each of these models would have experienced over the first quarter of 2020 and Figure 12 plots the time series of VaR and exceptions for the portfolio proxy. The best-performing models are the GARCH(1, 1) with daily data and either daily or biweekly parameter updating, but even these models experience 6 exceptions for the portfolio proxy. The worst-performing model is the GARCH(1, 1) with a week-long data lag with 11 exceptions; interestingly, both of the historical simulation models perform better with 9 exceptions each. Banks' average of 6.3 exceptions on their own substantially more complicated portfolios is more in line with the better-performing models.
One countervailing point is that, due to asymmetric costs of underestimating versus overestimating VaR, banks have an incentive to use more conservative VaR calibrations. O'Brien and Szerszeń (2017) also document that in the pre- and post-2008 financial crisis period, banks' VaRs were overly conservative. This general conservativeness may have reduced their exceptions during the March COVID-19 turmoil.
Systemic banks' average of 6.3 exceptions per bank for a complicated portfolio is similar to the 6 exceptions from the best-performing GARCH(1, 1) model for a simple equal-weighted average of equity, Treasury, and corporate bond portfolios. Further evidence indicates there were structural shifts in the estimated GARCH model around the COVID-19 crash, which would affect the performance of even the best models. The evidence points toward the market conditions being the main driver of exceptions rather than material deficiencies in the VaR models.
Table 3: Number of exceedances per model specification
| S&P 500 Index | S&P U.S. Treasury Bond Total Return Index | Bloomberg Barclays U.S. Corporate Investment Grade (USD) Unhedged | Portfolio proxy* | |
|---|---|---|---|---|
| 1. Historical simulation that uses all available data | 8 | 4 | 6 | 9 |
| 2. Historical simulation with a week-long data lag | 10 | 4 | 8 | 9 |
| 3. GARCH(1,1) with daily data and daily parameter updating | 5 | 1 | 4 | 6 |
| 4. GARCH(1, 1) – with daily data and using parameters from 2019 (no parameter update) | 6 | 2 | 5 | 9 |
| 5. GARCH(1,1) with daily data but using parameters estimated on a biweekly basis | 5 | 1 | 4 | 6 |
| 6. GARCH(1, 1) – with a week-long data lag and using parameters from 2019 (no parameter update) | 8 | 2 | 8 | 11 |
Source: Bloomberg and staff calculations.
*Portfolio proxy is calculated as an equal-weighted average of the S&P 500 Index, S&P U.S. Treasury Bond Total Return Index, and the Bloomberg Barclays U.S. Corporate Investment Grade (USD) Unhedged returns.
To better understand why even the GARCH models, designed to reflect time-varying volatility, experienced numerous exceptions during March 2020, we compared the estimated GARCH coefficients before and after the March COVID-19 turmoil. Table 4 shows that the estimated coefficient on the lagged squared residual term rose from 0.29 before the COVID-19 period to 0.39 throughout, so that a GARCH model would have underestimated the impact of recent and sudden market volatility. The changing structure of the market likely contributed to the large number of exceptions. In line with this, the GARCH model with daily data and daily parameter updating experienced 6 exceptions for the portfolio proxy while the GARCH model with daily data and fixed parameters from 2019 experienced 9 exceptions – as many as the simpler historical simulation models.
Table 4: GARCH coefficients
| Intercept | Lagged Squared Residual (Alpha) | Lagged Variance (Beta) | |
|---|---|---|---|
| GARCH parameters as of March 6 using the previous 261 observations | 0.000 (0.000) | 0.286 (0.069) | 0.587 (0.065) |
| GARCH parameters as of March 28 using the previous 261 observations | 0.000 (0.000) | 0.394 (0.105) | 0.602 (0.072) |
Note: Standard errors in parenthesis.
Overall, there is no single market that drove the backtesting exceptions that occurred throughout March 2020, although credit and rates markets were associated with a larger number of exceptions and larger losses than other markets. While banks experienced many exceptions during this period, systemic banks' average number of exceptions were in line with the number of exceptions from a benchmark GARCH model, indicating the importance of extraordinarily unusual market conditions in driving the exceptions rather than substantial model deficiencies.
3.2. Market Movements
To better understand the severity of the market volatility associated with the COVID-19 crash, we compared the size of market risk factor (MRF) moves observed during March 2020 to the 2008 GFC. MRFs drive the valuations of trading assets and liabilities and determine daily profits and losses on the banks' portfolios. A good forecast of these extreme market risk moves ensures that banks budget sufficient capital ahead of market turbulence. In general, we are interested in how the "worst" COVID-19 period daily move compared to the "worst" GFC move (i.e., broadly defined as negative price returns or increasing credit spreads). We compared COVID and GFC movements for both bank-provided MRFs, which banks use in their internal models, as well as selected publicly-available benchmark risk factors, such as movements in major indices. Positive MRF moves in the COVID time period were compared to the largest analogous positive move reported by banks in the GFC time period. Similarly, negative MRF moves during the COVID period were compared to the largest negative moves during the GFC. In both cases, one-day movements in MRFs were almost always larger during the COVID-19 crash than during the GFC.
First, we compared movement in high-level MRFs by LoB between the COVID and GFC periods. High-level MRFs are those that drive the performance of a portfolio, such as changes in major benchmark interest rates or benchmark stock indices. Systemically important banks identified and provided time series of these MRFs for each LoB. We investigated whether one-day movements in MRFs were unusually large for certain LoBs relative to movements during the Great Financial Crisis (GFC). In this section, we broke down the "other" LoB from Section 3.1 into its subcomponents of foreign exchange, commodities, and securitizations.
To illustrate how we compared movements in MRFs, continue the example from section 3.1. Assume a bank had a $100 million overall loss on March 12, 2020, that included $60 million in equity-related losses. The bank would report time series of the high-level MRFs associated with each LoB's losses, including the equity-related losses. In this case, suppose that the VIX Index was one such MRF with a movement in the positive direction. We would examine whether movement in the VIX on March 12, 2020, was unusually large compared to the GFC by comparing the change of the VIX on March 12, 2020, (which was 24.9) with the 99th percentile daily move during the GFC (which was 7.0).8 We would then calculate the relative move ratio as the ratio of the COVID move over the GFC move (in this case 24.9/7.0 = 3.6).
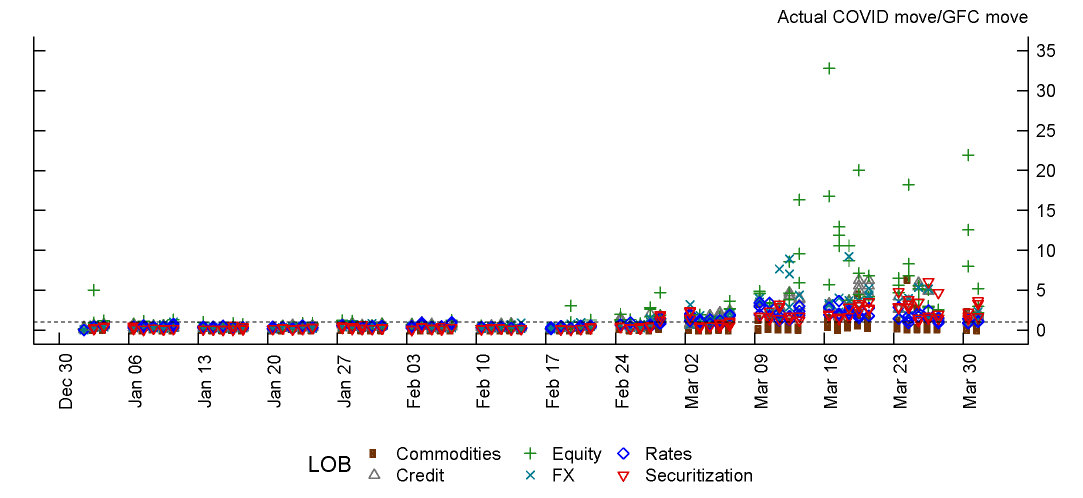
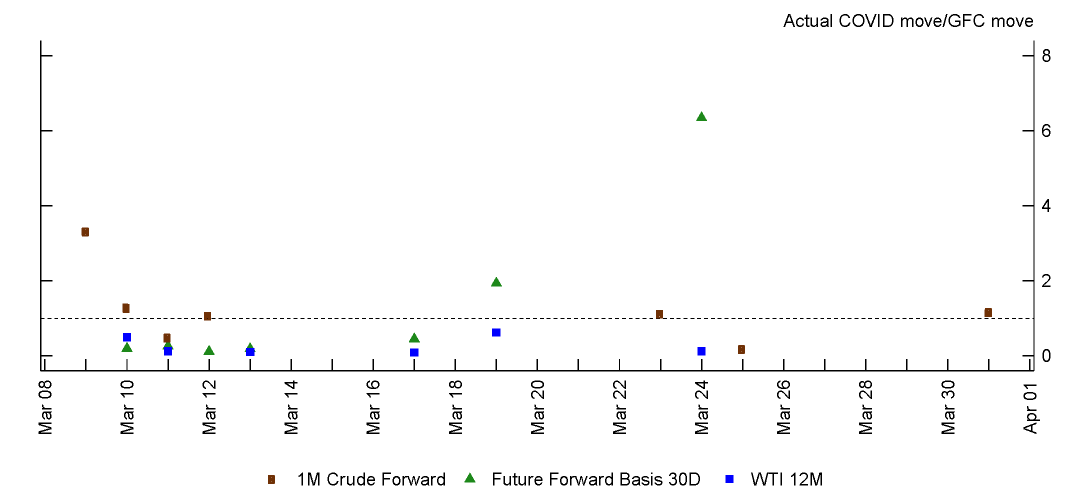
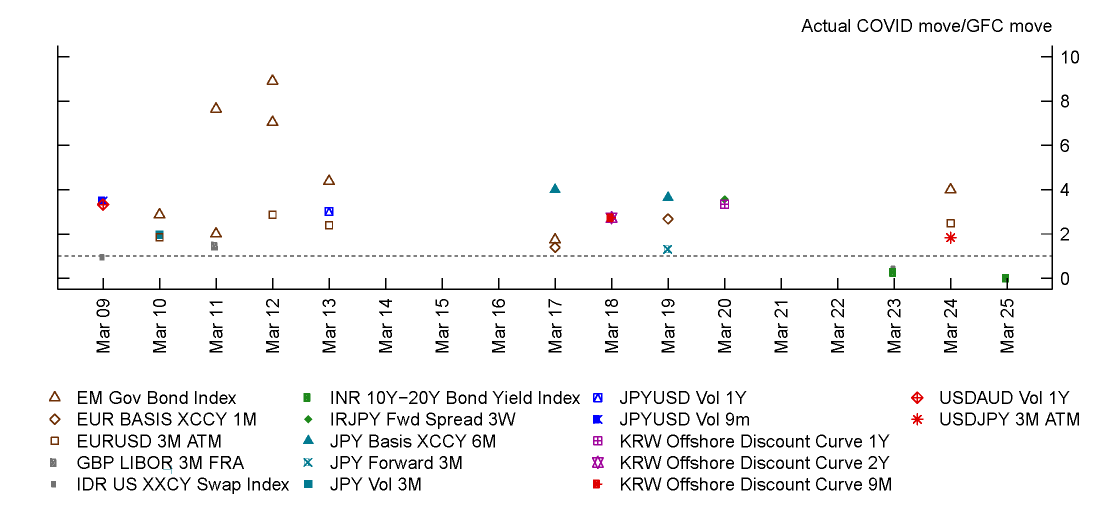
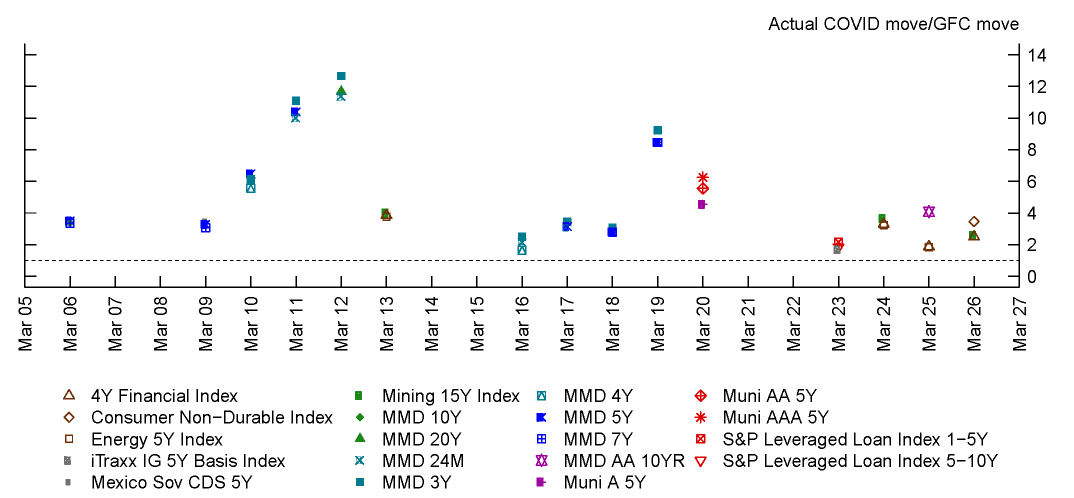
We computed the relative move ratios across all high-level MRFs and identified the three largest ones per day. Figure 3 shows the largest ratios during dates systemic banks incurred exceptions throughout the COVID period. Figure 5 in the appendix shows moves for the entire first quarter of 2020. As shown in Figures 6-11, MRFs from most LoBs typically observed moves much greater than during the GFC, however the MRFs associated with the equity and credit LoBs had especially large moves. Returning to our example, it turns out that the relative move ratio for the VIX of 3.6 was the highest daily COVID/GFC market move ratio on March 12, 2020, as indicated in Figure 11.
Figure 3: Three largest ratios of risk factor movements during COVID to those during the Great Financial Crisis for systemic banks on exception dates
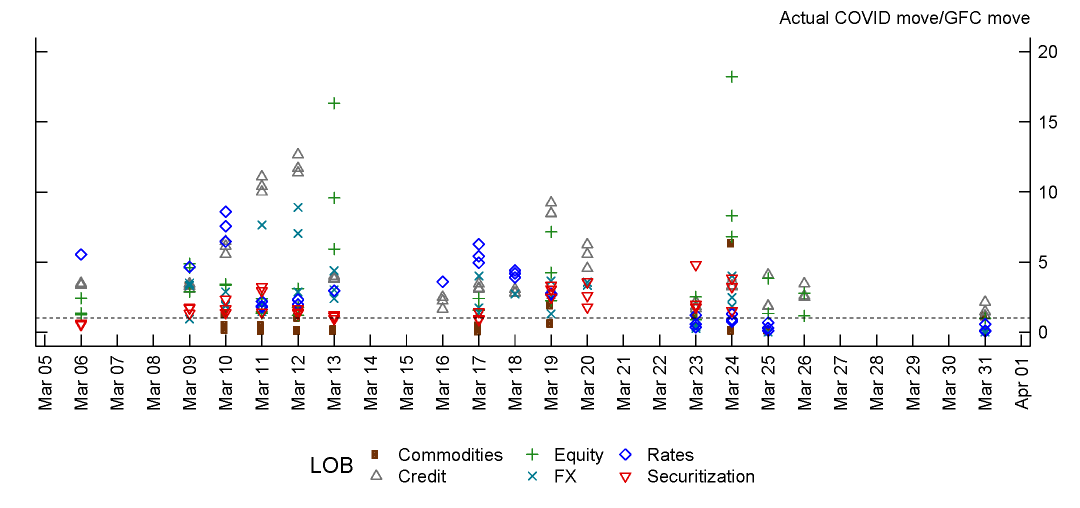
Source: Supervisory data from 9 systemic banks. Systemic banks are defined as those that are supervised by the Large Institution Supervision Coordinating Committee.
Second, we compared movements for selected publicly-available benchmark risk factors in Table 5.9 Additionally, we supplemented the GFC period comparison with the severely adverse scenarios from the Federal Reserve's stress testing framework, also known as DFAST 2020.10 In doing so, we reviewed whether MRF moves during the COVID-19 period were consistent with those from DFAST 2020.
Table 5: COVID-19 shocks for selective market risk factors (MRFs) by asset class
| Worst Daily Move | Worst Peak-to-Trough** | Market shock | |||
|---|---|---|---|---|---|
| Representative MRFs | COVID-19 (2020-Q1) | GFC 1% or 99% (2007-2009)* | COVID-19 (2020-Q1) | COVID-19 (Mar 6-27) | FRB Severely Adverse Scenarios (DFAST 2020) |
| 2 year U.S. Treasury (bps) | -25 | -11 | -135 | -31 | -77.7 |
| 10 year U.S. Treasury (bps) | -21 | -17 | -134 | -64 | -60.2 |
| 30 year U.S. Treasury (bps) | -31 | -17 | -139 | -79 | -55.5 |
| EUR/USD | -2.00% | -1.90% | -6.60% | -6.60% | -3.90% |
| GBP/USD | -3.70% | -2.30% | -13.00% | -12.40% | -3.20% |
| USD/JPY | -2.80% | -2.30% | -8.70% | -8.00% | -6.40% |
| SP500 Index | -12% | -6.00% | -33.90% | -22.40% | -26.00% |
| VIX Index (absolute change) | 24.9 | 6.96 | 70.59 | 35.4 | 49.4*** |
| Euro Stoxx 50 Index | -12.40% | -5.60% | -38.30% | -19.40% | -19.50% |
| CDX Investment Grade (IG) | 33.40% | 10% | 247.00% | 57.00% | 432.90% |
| CDX High Yield (HY) | 24.50% | 12% | 217.20% | 62.50% | 336.20% |
| Spread Muni AAA 5Y (bps) | 52.4 | 14 | 215 | 215 | 28.2 |
| Gold spot price | -3.60% | -3.90% | -12.50% | -12.50% | 11.20% |
| West Texas Intermediate (WTI) | -23.50% | -4.30% | -66.60% | -39.90% | -32.20% |
| S&P GSCI Index | -11.50% | -5.90% | -44.40% | -21.30% | -23.40% |
| ABS Credit Cards AA-BBB Fixed | -1.50% | -2.40% | -6.00% | -6.00% | -6.00% |
| ABS Automobiles AA-BBB Fixed | -1.60% | -0.70% | -8.90% | -8.80% | -15.30% |
| CMBS IG Index | -2.80% | -3.40% | -11.70% | -11.70% | -44.00% |
*Note prices dropping or spread widening is how we differentiate the "worst moves" as being from the 99th or 1st percentile of the move distribution.
**Peak-to-trough is calculated using the largest and smallest values in the selected period.
*** This is the change from the realized VIX level of 20.6 in 2019-4Q to the maximum FRB severely adverse scenario of 70.
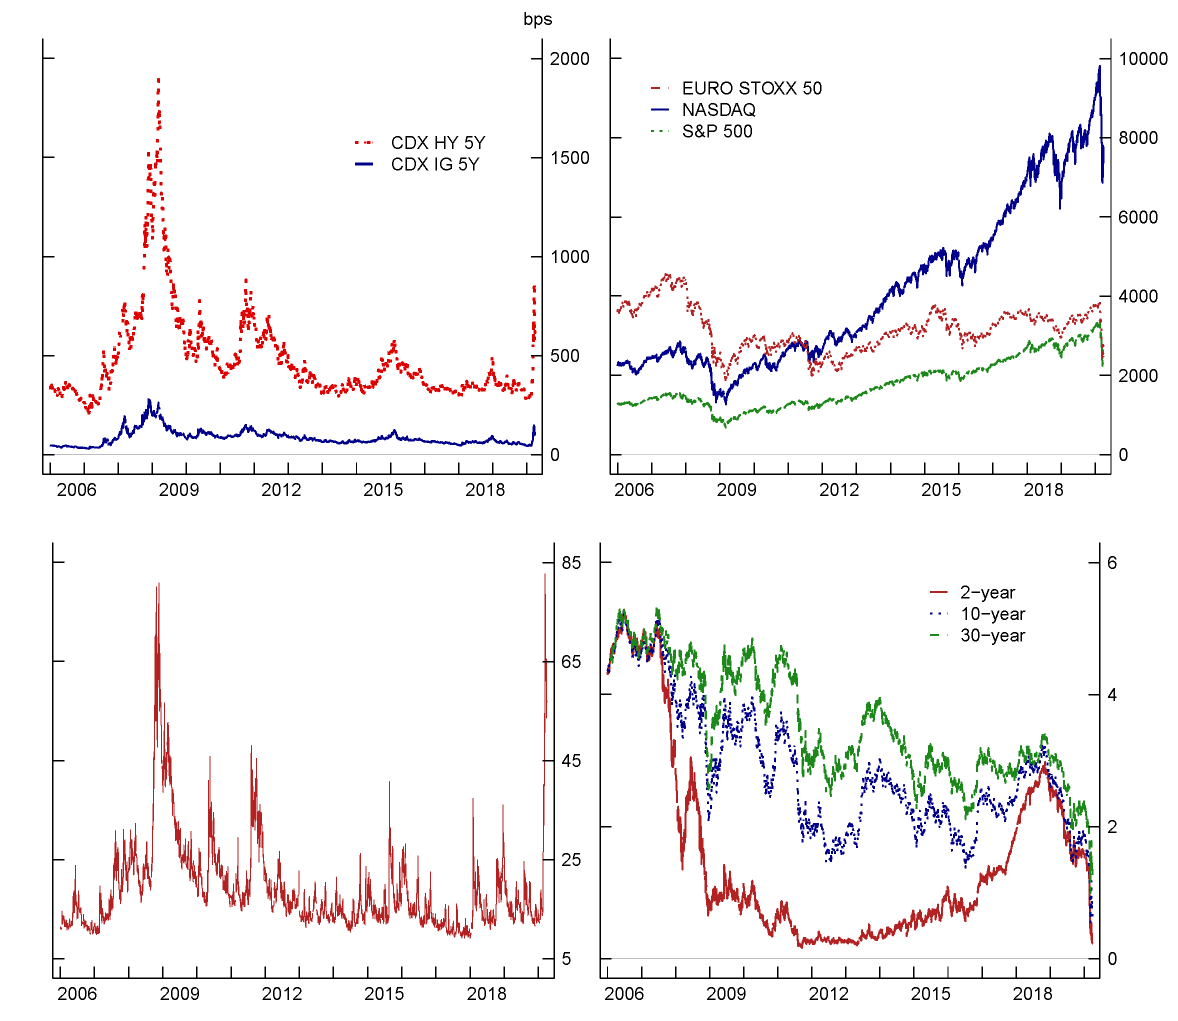
Table 5 lists selected representative benchmark risk factors across different asset classes to illustrate how extreme the market risk factor moves were during this period. U.S. Treasury rates fell sharply (see Figure 13, Panel A); specifically 2-year and 10-year U.S. Treasury rates fell 25 bps and 21 bps over one day, which were more extreme than the GFC period's 1% daily moves. Peak-to-trough moves, a metric used broadly to proxy worst-case scenario moves, in 2020-Q1 for U.S. Treasury rates are more than twice the severely adverse scenarios projected over one quarter under DFAST 2020 (e.g. -134 bps vs. -60.2 bps for 10 year U.S. Treasury yield in the initial release of scenarios).
Equities markets during the period from March 6, 2020, to March 27, 2020, observed extreme market moves when compared to the GFC period as well (see Figure 13, Panel B). The VIX, a stock market volatility index, reached a maximum of 82.7 with a worst daily absolute change of 24.9 (see Figure 13, Panel C) .Peak-to-trough move in 2020-Q1 saw a staggering increase of 70.59 whereas the DFAST 2020 maximum level for VIX was prescribed as 70 in the initial round of scenarios (see Table 5 bold items).
Flight-to-safety considerations caused the U.S. dollar to appreciate modestly against the Euro (EUR), pound (GBP), and Yen (JPY). While U.S. dollar daily moves against these currencies were modest, the worst daily moves during the period from March 6, 2020, to March 27, 2020, were still higher than the GFC 1% moves (e.g., -4% vs. -2.3% for GBP). Similarly, peak-to-trough moves for 2020-Q1 are higher than the DFAST 2020 first round of scenarios (e.g., -13% vs. -3.2% for GBP).
Credit spreads widened sharply both for Investment Grade (IG) and High Yield (HY) CDX indices (see Figure 13, Panel D), which are commonly-used credit risk indices based on credit default swap spreads.11 The worst daily spread widenings were 33% and 24.5% respectively for CDX IG and HY indices that were at least twice of the 1% GFC spread widening for the same indices. Similarly, municipal bond spreads during the period from March 6, 2020, to March 27, 2020, widened in line with lower municipal tax revenues associated with the severe weakening of the U.S. economy. Muni AAA 5-year spreads saw a spike of 52 bps over one day while the GFC period 1% spread move was only 14 bps. Even more striking is the fact that the peak-to-trough widening for the Muni AAA 5-year spread of 215 bps was seven times more than the widening envisioned under the Federal Reserve's severely adverse scenario of 28.2 bps for a projected quarter.
Commodities markets observed similar shocks. During the period from March 6, 2020, to March 27, 2020, WTI's worst daily drop was -25% while the 1% GFC move was -9.4%. The S&P GSCI commodity index's worst daily move was -12% while it was -5.7% for the GFC period.
In sum, during the period from March 6, 2020, to March 27, 2020, MRFs moved substantially more than during the GFC across multiple asset classes, both for banks' internal MRFs and for publicly-available representative benchmark factors. Additionally, many risk factors moved by more than had been anticipated under the DFAST severely adversely scenario. Market behavior during the COVID-19 crash was far from normal, even by the standards of other crises.
3.3. Trading profitability
The intent of MRR regulations is to capitalize banks' trading inventory risk in line with forecasted hypothetical losses on existing positions. As explained in Section 2, further capital buffers are implemented using backtesting multipliers, which are applied based on comparisons of hypothetical losses to VaR estimates (i.e., exception counts). During March 2020, while backtesting resulted in a high number of exception days when Hypothetical P&L on existing positions exceeded modelled VaR estimates, the largest banks' actual P&L on their trading portfolios was positive.12 Panel A of Figure 4 shows the breakdown of Actual P&L into new position P&L and Hypothetical P&L on existing positions for the systemic banks that submitted Volcker Rule metrics data and experienced enough backtesting exceptions to potentially raise their backtesting multiplier. Even on the most turbulent days in 2020 Q1, the figure shows that new positions' profits and losses largely offset hypothetical losses on existing positions. In Figure 4, we show that higher new position P&L (Panel A) is associated with higher transaction volumes (Panel B) during March 2020. The significant difference between the COVID crash and the GFC is that trading volume increased during the COVID crash, whereas liquidity and trading volume dried up during the GFC, which caused banks to experience significant trading losses.13
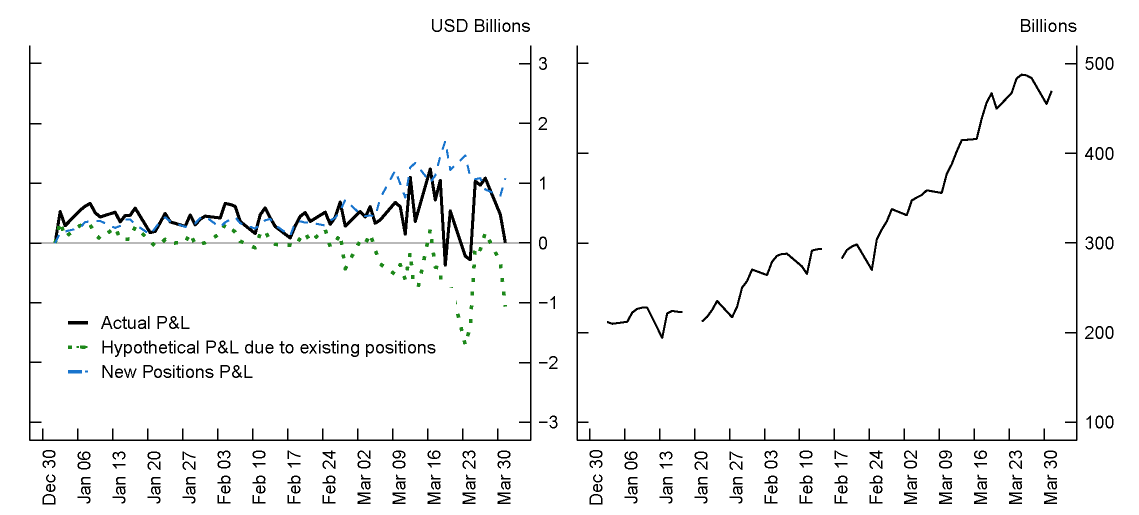
Source: Volcker Rule Quantitative Measurements (FR VV-1). Supervisory data from 8 systemic banks, since one of the 9 banks does not submit FR VV-1. Systemic banks are defined as those that are supervised by the Large Institution Supervision Coordinating Committee.
4. Federal Reserve response
Without intervention, banks' backtesting exceptions would have increased their multipliers and further amplified increases in market risk capital requirements. Furthermore, increasing the backtesting multiplier was arguably not in the spirit of the rule, to the extent that exceptions were driven by unusual market conditions rather than modeling failures. At the time, regulators were concerned that banks would pull back from making markets and extending credit if capital requirements increased at the same time they were experiencing losses, amplifying the economic downturn. After large losses are experienced by banks, there is a clear tension between raising the multiplier based on backtesting exceptions and ensuring lending and market making continues to avoid or lessen the severity of an economic downturn. Along these lines, Chair Jerome Powell described the Federal Reserve's regulatory adjustments as being designed "to encourage and allow banks to expand their balance sheets to support their household and business customers" (Powell, 2020).
Regulators temporarily allowed banks to cap their backtesting multiplier at the value of the multiplier that applied on December 31, 2019, through September 30, 2020.14 The total market risk capital impact from this decision was approximately $3.3 billion, or 9% of the total market risk capital that would have applied if the relief were not provided.15 While this temporary measure was in place, regulators collected additional information from banks to identify the causes of backtesting exceptions. The longer-term goal was to remove all exceptions that were due to unusual market movements rather than poorly-specified models.
Regulators ultimately decided to exclude all backtesting exceptions from March 6, 2020, to March 27, 2020. They found that exceptions inside the window were associated with widespread and unusual volatility in major benchmark indices and model risk factors. From manual inspection, regulators determined that exceptions outside of the window were generally driven by month-end valuation adjustments or idiosyncratic risk and should therefore not be excluded from the multiplier. Similar actions were taken by other regulators internationally.
Under the upcoming adoption of the Fundamental Review of the Trading Book (FRTB), which sets new standards for calculating market risk capital requirements, capital requirements will be less likely to spike in stressed market conditions. The main reason is that the FRTB's capital calculations require estimations of expected shortfall (ES for short; the expected loss beyond a specified percentile) for only stressed market conditions, not including current market conditions. Therefore, capital requirements should remain stable as markets become more volatile. The current market risk rule is based on a mix of current VaR and Stressed VaR, making it procyclical.
While capital requirements will be less likely to spike in stressed markets under the FRTB, there is still potential for backtesting exceptions to raise capital requirements for banks using the Internal Models Approach (IMA). Banks using the IMA set capital requirements based upon their own models. While capital requirements under the FRTB depend on ES rather than VaR, VaR-based backtests are still used to evaluate banks' ES models. The FRTB has a similar BHC-level backtesting multiplier that automatically increases as banks experience more exceptions.16 Additionally, a new feature of the FRTB is to allow for internal model approval at the level of trading desks. However, if desks experience a sufficiently high number of backtesting exceptions, they could be forced to stop using internal models and instead fall back to the more conservative Standardized Approach (SA). To avoid pro-cyclical effects from these two mechanisms, the FRTB allows for flexibility in assigning the backtesting multiplier, as was used during the COVID-19 market volatility, and in allowing trading desks to continue using internal models even if they fail backtests.17 The FRTB contains these safeguards to allow for exceptions during market crises. Also, neither of these problems is a concern for banks that consistently use the SA.
5. Conclusion
Increased market volatility across several asset classes during the March COVID-19 turmoil caused many backtesting exceptions at even the most sophisticated and systemically important firms. While no single market stands out as the cause of these exceptions, credit and rates businesses were associated with a particularly large number of exceptions and with larger losses. The extent of volatility during the COVID-19 turmoil was large relative to previously estimated DFAST Severely Adverse market shock scenarios and, in many cases, the Great Financial Crisis. This resulted in large losses in Hypothetical P&L, even though intraday new positions more than offset these losses, resulting in net positive Actual P&L. While banks experienced many exceptions, other benchmark VaR models would have experienced the same, which indicates that exceptions were likely driven by unusual market volatility rather than underperforming VaR models. To prevent these backtesting exceptions from triggering an increase in market risk capital requirements at the height of the COVID-19 market volatility, regulators initially responded by capping banks' backtesting multipliers to prevent an immediate undesired capital increase, and then later removed backtesting exceptions that occurred in a window surrounding the COVID-19 crash since they reflected unusual market conditions rather than deficiencies in banks' VaR models.
References
Anderson, Chris and Mawhirter, Dennis (2020). "Evaluating Banks' Value at Risk Models During the COVID-19 Crisis." Working paper.
BCBS, 1996, Amendment to the Capital Accord to Incorporate Market Risks (PDF).
Christoffersen, Peter F. (2012). Elements of Financial Risk Management (2nd edition). Academic Press.
James O'Brien, Paweł J. Szerszeń (2017). "An evaluation of bank measures for market risk before, during and after the financial crisis." Journal of Banking & Finance, Volume 80, Pages 215-234, https://www.sciencedirect.com/science/article/pii/S0378426617300511?via%3Dihub.
Powell, Jerome H. May 13, 2020. Current Economic Issues.
Stahl G., 1997, Three Cheers, Risk Magazine Vol. 10, Figure 1.
6. Appendix
6.1. Other figures
Figure 5: 2020 Q1 – Largest three ratios of COVID to Great Financial Crisis risk factor movements for systemic banks
Source: Supervisory data from 9 systemic banks. Systemic banks are defined as those that are supervised by the Large Institution Supervision Coordinating Committee.
Figure 6: Commodities LoB – Largest three ratios of COVID to Great Financial Crisis risk factor movements for systemic banks on exception dates
Source: Supervisory data from 9 systemic banks. Systemic banks are defined as those that are supervised by the Large Institution Supervision Coordinating Committee.
Figure 7: FX LoB – Largest three ratios of COVID to Great Financial Crisis risk factor movements for systemic banks on exception dates
Source: Supervisory data from 9 systemic banks. Systemic banks are defined as those that are supervised by the Large Institution Supervision Coordinating Committee.
Figure 8: Credit LoB – Largest three ratios of COVID to Great Financial Crisis risk factor movements for systemic banks on exception dates
Source: Supervisory data from 9 systemic banks. Systemic banks are defined as those that are supervised by the Large Institution Supervision Coordinating Committee.
Figure 9: Securitization LoB – Largest three ratios of COVID to Great Financial Crisis risk factor movements for systemic banks on exception dates
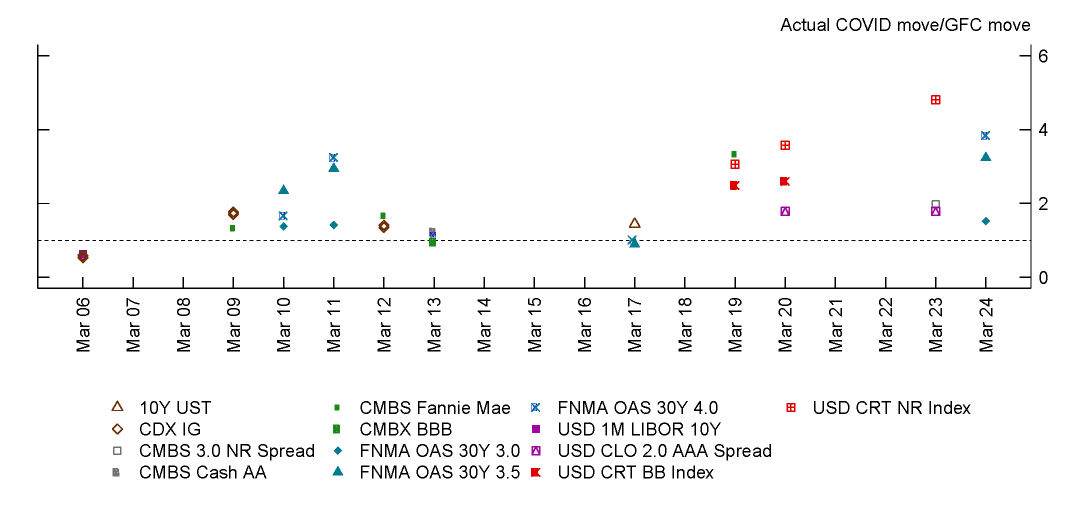
Source: Supervisory data from 9 systemic banks. Systemic banks are defined as those that are supervised by the Large Institution Supervision Coordinating Committee.
Figure 10: Rates LoB – Largest three ratios of COVID to Great Financial Crisis risk factor movements for systemic banks on exception dates
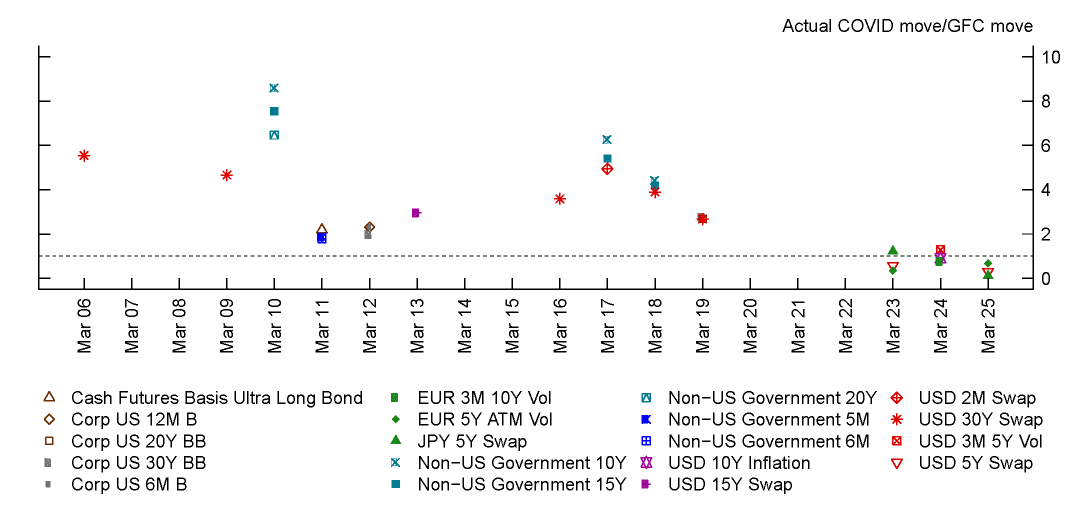
Source: Supervisory data from 9 systemic banks. Systemic banks are defined as those that are supervised by the Large Institution Supervision Coordinating Committee.
Figure 11: Equity LoB – Largest three ratios of COVID to Great Financial Crisis risk factor movements for systemic banks on exception dates
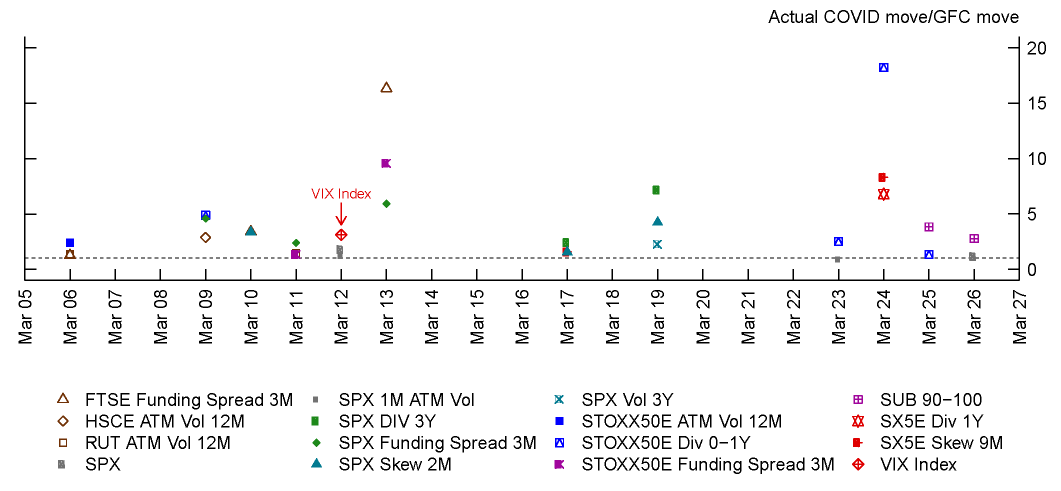
Source: Supervisory data from 9 systemic banks. Systemic banks are defined as those that are supervised by the Large Institution Supervision Coordinating Committee.
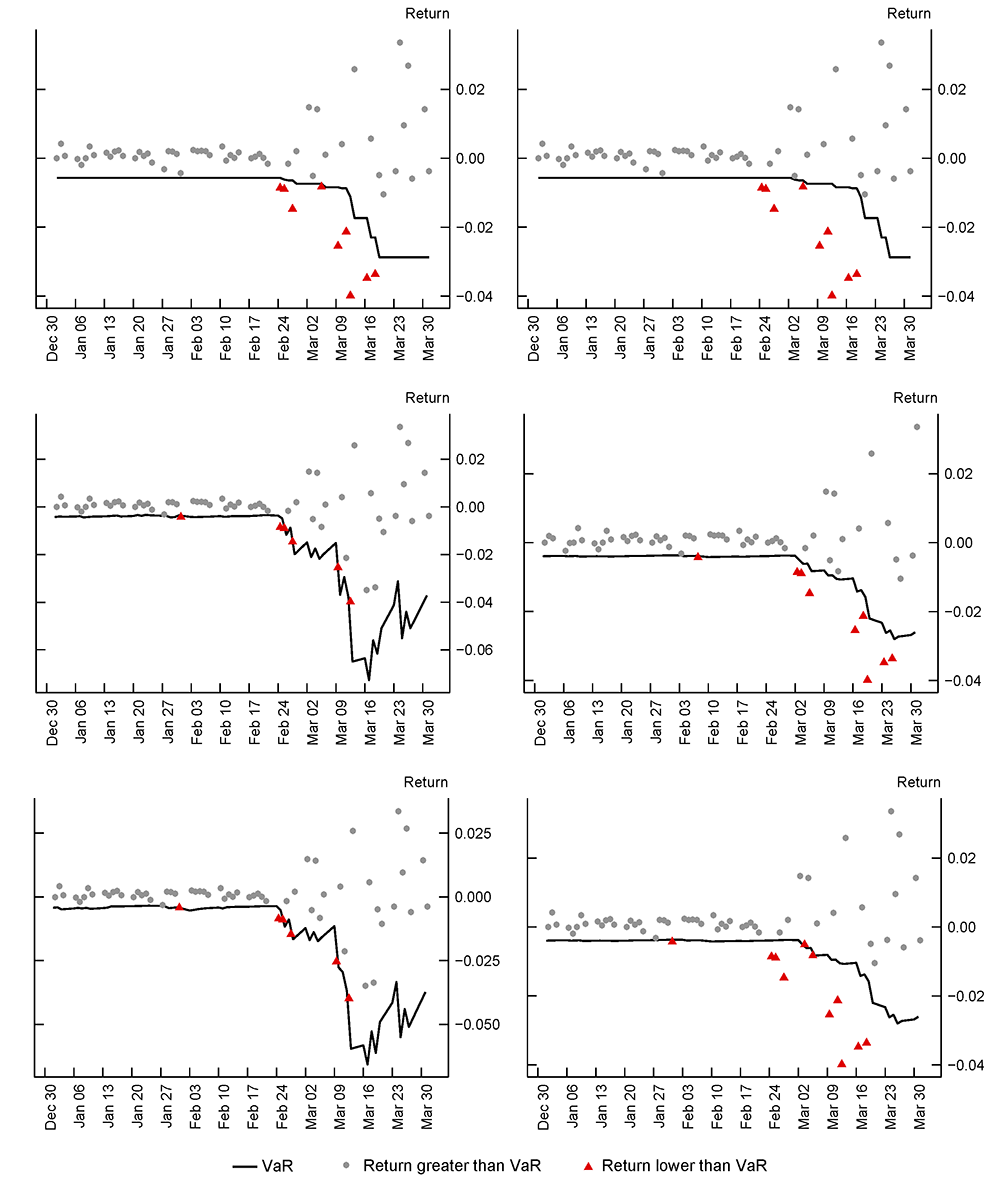
Source: Bloomberg and staff calculations.
Note: Black line represents the daily forecasted VaR and red points refer to returns lower than VaR. Portfolio proxy is calculated as an equal-weighted average of the S&P 500 Index, S&P U.S. Treasury Bond Total Return Index, and the Bloomberg Barclays U.S. Corporate Investment Grade (USD) Unhedged returns.
Source: Bloomberg and IHS Markit.
1. VaR is an estimate of a specified percentile of the loss distribution for a trading position over a fixed holding period. The 99th percentile 10-day VaR is used for regulatory purposes. Return to text
2. A backtesting exception occurs whenever a bank's daily losses exceed its VaR estimate. Return to text
3. For our analysis we define GFC as the period from 2007 to 2009. Return to text
4. In addition to the VaR and stressed VaR components, market risk capital requirements also include the sum of specific risk add-ons, the incremental risk capital requirement, the comprehensive risk capital requirement, and a capital requirement for de minimis exposures, plus any additional capital requirement established by the primary federal regulator. Return to text
5. For example, under the Volcker Rule Section 44.4(a)(2)(ii)(A), banks are permitted to act as market makers and hold inventory sufficient enough to meet Reasonably Expected Near Term Demand (RENTD). These market making activities lead to new intraday positions being initiated, and thus contributes to new position P&L. Return to text
6. The MRR uses "multiplication factor" in the rule text while the term "backtesting multiplier" is more widely used by the industry, hence we will use the latter throughout this note. Return to text
7. The Federal Reserve System (FRS) is responsible from supervising and regulating Bank Holding Companies (BHCs). This FEDS note summarizes data at the BHC level. Return to text
8. Since banks could have both positive and negative sensitivities to MRFs, we consider both large upward and downward movements of MRFs using the 1st and 99th percentile moves. Return to text
9. For the representative MRFs in Table 5, worst daily moves and worst peak-to-trough moves for the COVID-19 and worst daily moves for the GFC (2007-2009) period are downloaded from Bloomberg. For all other risk factors for which we provide the largest COVID-19 to GFC ratios (i.e., figures 3, 5-11), we used MRF data submitted by banks. Return to text
10. This was the first round of hypothetical scenarios for Federal Reserve's 2020 stress test exercises which were released on February 6, 2020, before the COVID-19 pandemic affected markets. Return to text
11. A credit default swap is a transaction that is effectively equivalent to buying insurance against a bond defaulting. One party pays a fixed spread while the other agrees to pay to cover any losses in the event of a default. Return to text
12. This sample consists of systemic banks that report the Volcker Metrics which is slightly different than previous data. Return to text
13. Trading losses were significant as reported in the FR Y9-C for the subset of banks that were bank holding companies in 2008-2009. Return to text
14. See announcement https://www.federalreserve.gov/COVID-19-supervisory-regulatory-faqs.htm. Return to text
15. In Q1-2020, 32 BHCs were subject to the MRR requirements. Of those 32, 11 of them are in Large Institution Supervision Coordinating Committee (LISCC), 17 of them are in Large and Foreign Banking Organization (LFBO) and 4 of them are in Regional Banking Organization (RBO) portfolios respectively. Return to text
16. The formula for the aggregate IMA capital requirement is $$\mathrm{max}({IMCC}_{t-1} + {SES}_{t-1}, m_c \cdot {IMCC}_{avg} + {SES}_{avg})$$, where $$IMCC$$ is the capital requirement for modellable risk factors, $$SES$$ is the capital requirement for non-modellable risk factors, $$m_c$$ is a multiplier, the $$t-1$$ subscript refers to the previous day, and the $$avg$$ subscript refers to an average over the previous 60 days. By default, $$m_c$$ is 1.5 and gradually rises to 2 as banks experience more BHC-level exceptions. See MAR 32.9 and MAR 33.42 in "Minimum capital requirements for market risk" (2019) for further details. Return to text
17. For details on special treatment for exceptional situations, see MAR 32.45 in "Mnimum capital requirements for market risk" (2019). Return to text
Abboud, Alice, Chris Anderson, Aaron Game, Diana Iercosan, Hulusi Inanoglu, and David Lynch (2021). "Banks' Backtesting Exceptions during the COVID-19 Crash: Causes and Consequences," FEDS Notes. Washington: Board of Governors of the Federal Reserve System, July 08, 2021, https://doi.org/10.17016/2380-7172.2939.
Disclaimer: FEDS Notes are articles in which Board staff offer their own views and present analysis on a range of topics in economics and finance. These articles are shorter and less technically oriented than FEDS Working Papers and IFDP papers.