


FEDS Notes
October 02, 2026
Beyond the factory gate: The continued importance of goods production
Goods-producing industries have accounted for a declining share of U.S. jobs and economic output in recent decades, which has long been a topic of intense policy and research focus. Some commonly cited facts are reported in figure 1.2 The share of private sector employment accounted for by the manufacturing sector (left panel) has declined from about 35 percent in the 1950s to less than 10 percent recently. And while growth of industrial production once kept up with GDP growth (right panel), after the mid-2000s industrial production growth effectively ceased while GDP continued to expand.
In this note, I highlight several underappreciated—though not necessarily novel—facts about U.S. goods production, arguing that physical goods remain a driving force in the U.S. economy and, perhaps, have not lost as much importance as the most closely watched indicators might suggest.
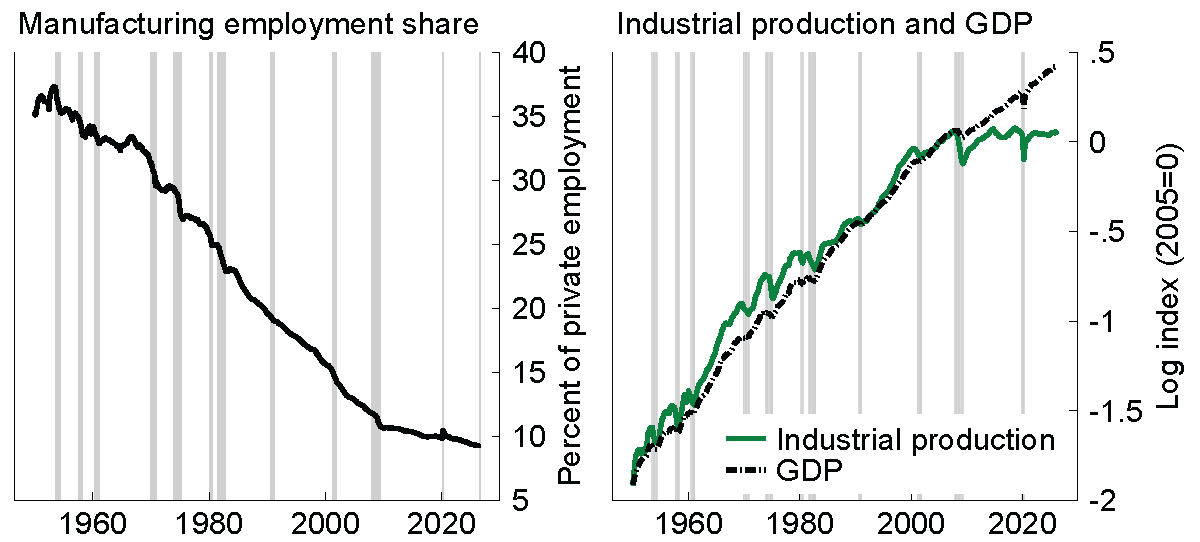
Note: Left panel shows monthly data; right panel shows quarterly data. Gray shading indicates NBER recession dates.
Source: Current Employment Statistics (Bureau of Labor Statistics), Industrial Production and Capacity Utilization (Federal Reserve Board), National Income and Product Accounts (Bureau of Economic Analysis).
Notably, there does remain widespread recognition of the importance of goods production for certain issues like innovation,3 national security,4 "good" jobs and labor market spillovers,5 recent inflation patterns,6 and the present AI-related datacenter investment boom. Leaving these topical issues aside, in this note I focus on broader macroeconomic points. In particular:
- In an accounting sense, physical goods production is the primary driver of U.S. business cycles; indeed, recessions are almost uniformly "goods" phenomena.
- While industrial production overall has seen no net growth in the last two decades, this underwhelming outcome hides considerable variation across types of goods and their end uses. For example, production of goods intended for use by businesses (as opposed to consumers) has seen substantial growth, led by growth of energy materials.
- Measures of goods-industry value added have grown considerably faster than measures of goods-industry gross output; this fact could reflect improved ability of producers to add value at lower cost in terms of intermediate inputs, industry composition effects, or increasing measurement challenges.
- Physical goods GDP—which includes the value added to final goods not only by traditional goods-producing industries but also by service activities like research & development, product design, transportation, or retail—has grown faster than the value added of the traditional goods-producing industries, has kept up with overall GDP growth for more than a decade, and still accounts for a sizeable one-quarter of overall GDP. That is, a broader view of goods production is less downbeat than narrower indicators.
Recessions are physical goods phenomena
I first consider the business cycle properties of goods production by studying fluctuations in gross domestic product (GDP). I focus on a measure of "goods GDP" composed of inventory investment, government and private investment in equipment, goods consumption, and goods net exports. I compare this measure to "services GDP" as defined by the Bureau of Economic Analysis (BEA) in the National Income and Product Accounts (NIPAs).7
Figure 2, left panel plots the contributions to 4-quarter GDP growth of goods GDP and services GDP since 1950. Both goods GDP and services GDP are highly procyclical, accelerating in expansions and decelerating in recessions. Indeed, there are negative and statistically significant pairwise relationships between each of those GDP components and the change in the unemployment rate, at both quarterly and annual frequency.8
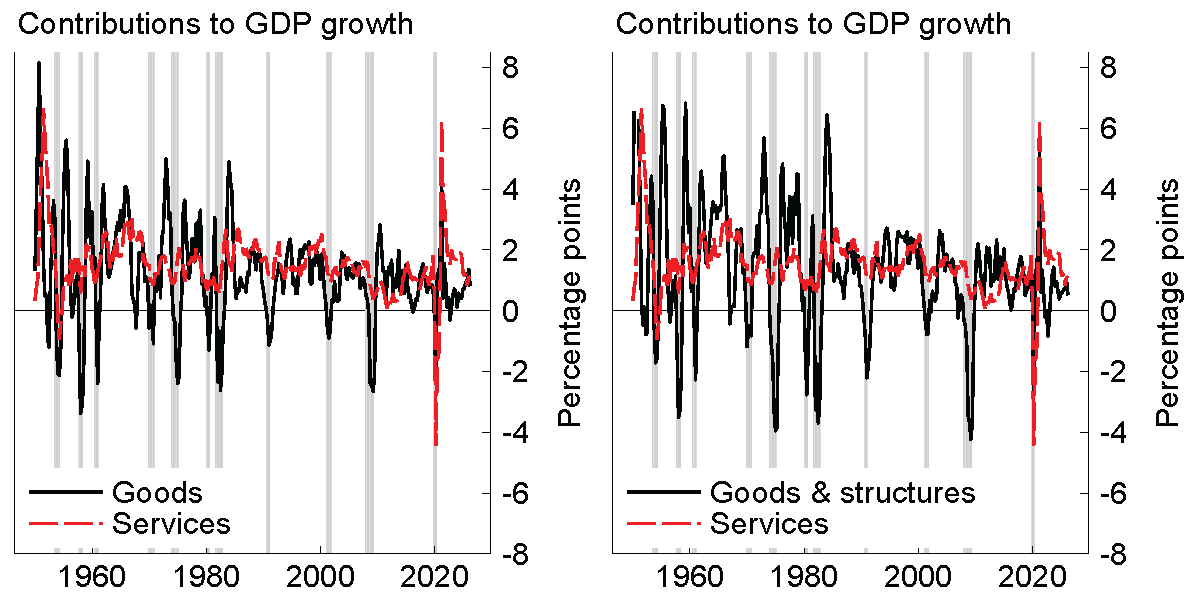
Note: Contributions to 4-quarter GDP growth. Goods GDP is NIPA goods GDP excluding intellectual property products. Gray shading indicates NBER recession dates.
Source: National Income and Product Accounts (Bureau of Economic Analysis).
The figure also reveals that, despite both goods and services being procyclical, the cyclical fluctuations in aggregate GDP are driven far more by goods than by services production, which is easily observed since the figure is specified in terms of contributions to aggregate GDP growth. The right panel adds structures investment (including housing) to the goods category, which enhances the result that physical products account for the business cycle.
Recessions—defined either according to the National Bureau of Economic Research (NBER) or to a simpler definition of negative GDP growth on a 4-quarter basis—are, in an accounting sense, almost always due entirely to contracting production of goods9 and, to a lesser extent, structures.10 In contrast, while services output growth slows down during recessions, outright contractions or recessions in services production are rare—almost unheard of. On a 4-quarter basis, services production contracted once in the 1950s then did not do so again until the pandemic recession of 2020.11
Flat industrial production hides variation across goods types and uses
Recall the right panel of figure 1, which reports the level of industrial production (IP) as published in the Industrial Production and Capacity Utilization release of the Federal Reserve Board. IP is published monthly and covers manufacturing (which is roughly 75 percent of industrial sector value added) as well as mining and utilities (each of which accounts for a bit more than 10 percent of value added).
The most striking feature of the IP chart is the period following the Global Financial Crisis (GFC) of the late 2000s. Production fell dramatically during that recession then recovered slowly. Since recovering to its pre-GFC level, production has oscillated around that level with essentially no net growth.
The (net) flatness of industrial production since the GFC hides rich variation within the industrial sector, as can be seen from figure 3. The left panel reports production for the main industry aggregates within IP: durable manufacturing (which accounts for about 35 percent of industrial value added), nondurable manufacturing (about 40 percent), and mining and utilities (a bit more than 10 percent each).
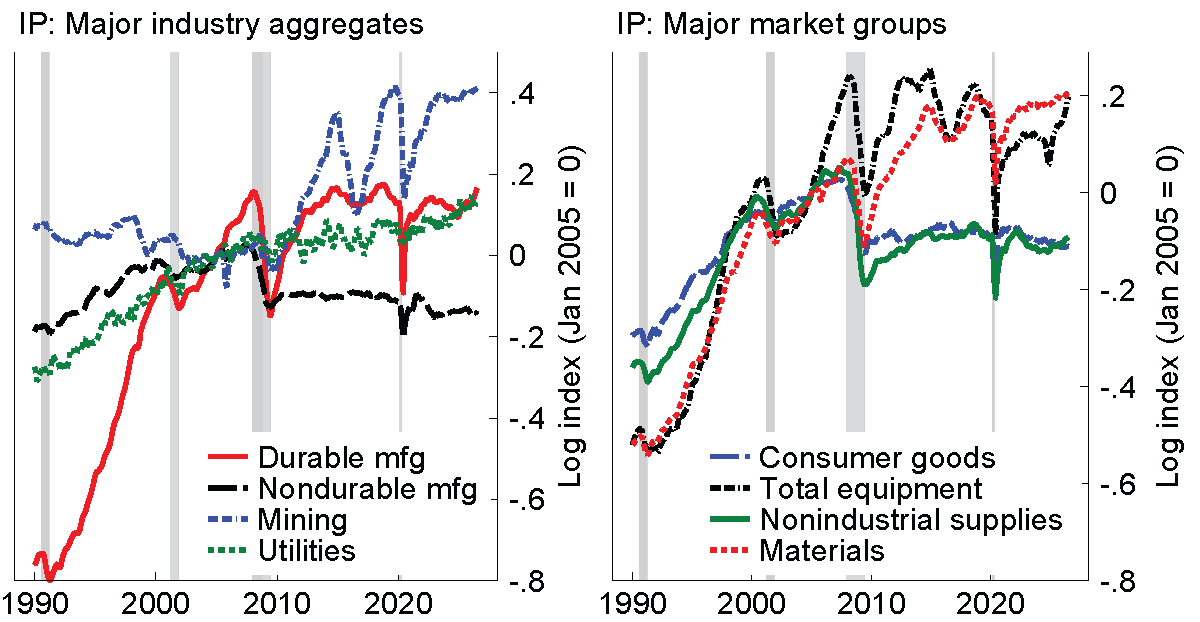
Note: Left panel is NAICS basis. Gray shading indicates NBER recession dates.
Source: Industrial Production and Capacity Utilization (Federal Reserve Board).
After the mid-2000s, only durable manufacturing saw significant growth into the GFC. Since the onset of the GFC: Durable manufacturing output has been roughly flat, on net, while nondurable manufacturing output has not recovered from its initial GFC contraction and has even trended gradually down. With flat durable production and lower nondurable production, overall manufacturing IP is lower now than it was just before the GFC. Mining output has risen substantially, albeit with sizeable swings driven largely by the oil and gas industry. Utilities output quickly recovered then has trended up at a pace a bit below its pre-GFC trend.
The right panel of figure 3 provides a different disaggregation of IP. The IP statistic features "market group" tabulations that classify measured output growth based on the end use of the products, as informed by the BEA NIPAs.12 IP consists of four major market groups: consumer goods (accounting for nearly 30 percent of industrial value added), total equipment (for use by businesses as well as defense and space purposes, just over 10 percent), nonindustrial supplies (inputs to production for industries outside the industrial sector, a bit more than 15 percent), and materials (inputs to production within the industrial sector, nearly 45 percent).
Since the onset of the GFC: The indexes for both consumer goods and nonindustrial supplies have not recovered from their sharp GFC contractions. Total equipment output has been volatile—in large part due to transit equipment (e.g., aircraft, motor vehicles)—and has not quite persistently returned to its pre-GFC level, though it has mostly stayed above its mid-2000s level. Output of materials rose notably by the mid-2010s but made little further progress after that. Within materials (and not shown on the figure), output of nondurable, nonenergy materials is still well below its pre-GFC level, while output of durable, nonenergy materials is close to its pre-GFC level, and output of energy materials has grown markedly.
In short, then, the lack of net growth of industrial production since before the GFC reflects wide-ranging underlying patterns for different types of goods and their end uses. Mining, durable goods, and energy-related goods have seen stable output or even substantial growth, especially among those goods being sold to businesses.
In goods industries, value added has grown more than gross output
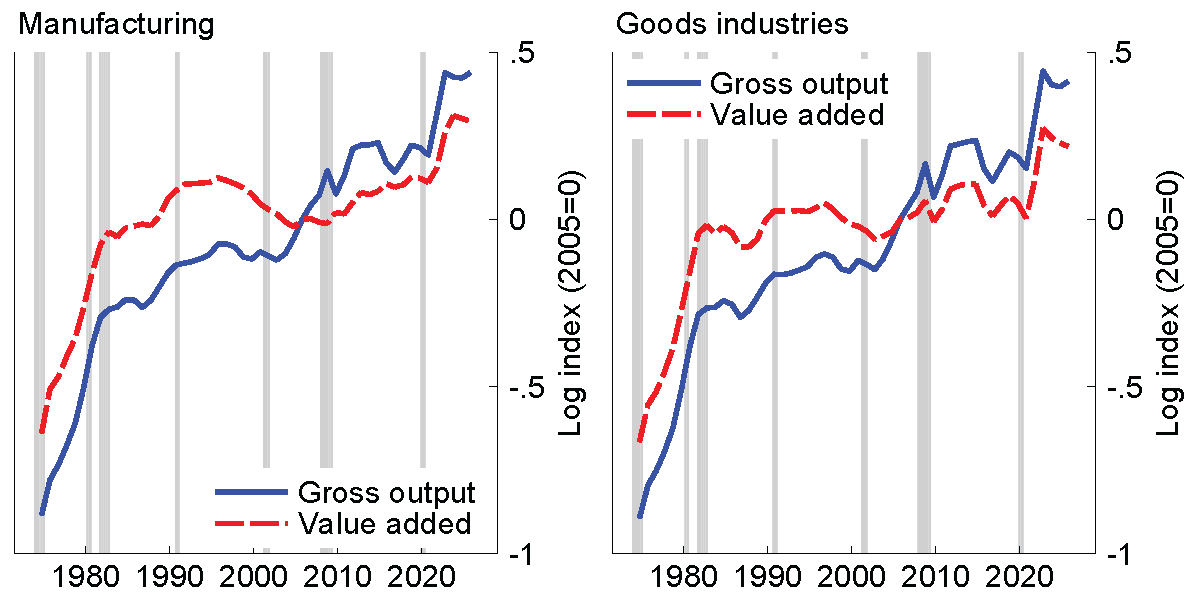
IP can be thought of as measuring growth of real gross output—that is, the total value of industry output as it leaves the factory gate without subtracting the value of inputs to production.13 Gross output is a good measure of overall production throughout the economy, providing a "top-line" view of the entire supply chain (see, e.g., Skousen 2024). Over the past couple decades the level of IP has moved closely with the BEA's NIPA-based measure of real gross output, as can be seen from the left panel of figure 4, which focuses on the manufacturing sector for simplicity.
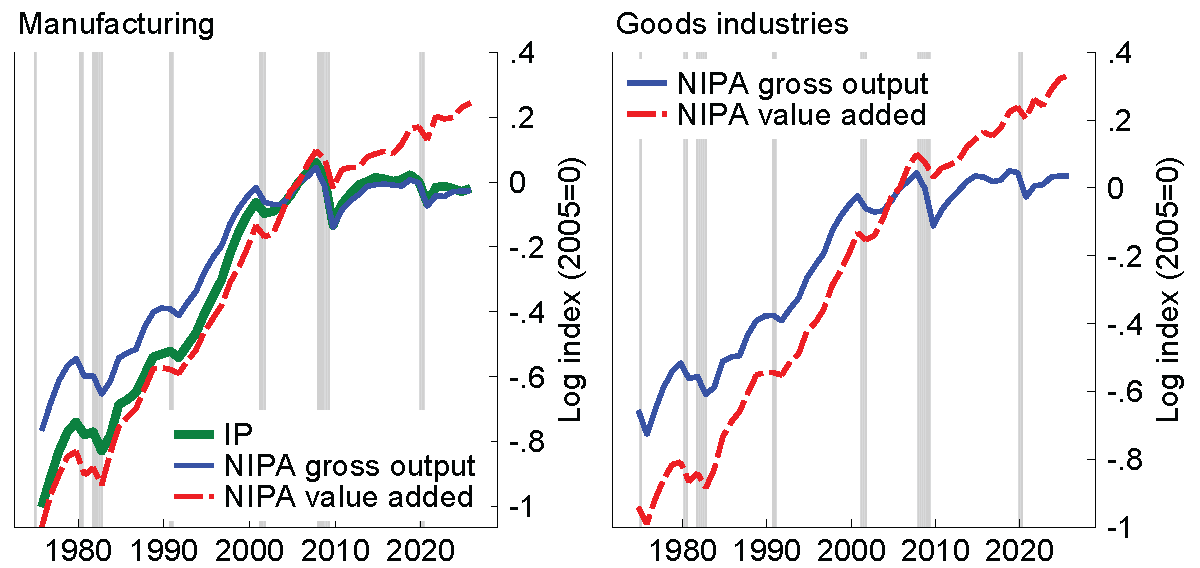
Note: Annual data. All series in real terms. IP is NAICS manufacturing. Goods industries are NAICS 11, 21, 31-33. Gray shading indicates NBER recession dates.
Source: Industrial Production and Capacity Utilization (Federal Reserve Board), National Income and Product Accounts (Bureau of Economic Analysis).
The left panel of figure 4 also reports another measure of manufacturing output: real value added (as measured in the NIPAs). Value added measures output net of intermediate inputs, specifically capturing the economic value that is added to products by the industry's installed capital, labor, and management; this is the measure that is directly relevant for the sector's contribution to GDP.
Both manufacturing IP and real NIPA manufacturing gross output have been roughly flat for about two decades and have recently been at levels below those reached just before the GFC; in contrast, real manufacturing value added recovered to its pre-GFC level by the late-2010s and has since grown further.
Growth of value added alongside flat gross output is observable not only for manufacturing but for goods industries generally; the right panel of figure 4 shows the real gross output and real value added of "goods" industries, that is, the industries responsible for harvesting, extraction, or manufacturing of goods: agriculture, forestry, fishing, and hunting; mining; and manufacturing (NAICS 11, 21, and 31-33).14
Why would value added grow while gross output is stagnant? I will briefly discuss a few possibilities, leaving definitive conclusions to future research: (1) genuine efficiency or cost improvements, (2) composition effects, and (3) measurement problems. The truth may be a combination of these three.
First, taking the data at face value, the relatively high growth of value added relative to gross output mechanically implies that there has been an increase in the value-added share of gross output (versus the share accounted for by intermediate inputs): for the goods-producing industries together, since the mid-2000s, the value-added share (in nominal terms) has risen from just above 35 percent to just above 40 percent. Perhaps U.S. goods producers15 have found ways to generate more value added from a given amount or cost of intermediate inputs—a kind of productivity improvement arising from, say, efficiency gains or lower input cost growth due to trade or expanding domestic energy supply.16 Indeed, within manufacturing, the industry for which (real) value-added growth most outstripped gross output growth is computer and electronics manufacturing (NAICS 334), which might illustrate productivity and cost improvements arising from technology.
Second, the relatively high growth of value added versus gross output could reflect composition effects. For example, suppose narrow industries in which value added is generally a large share of gross output have increased their "market share" of overall goods production activity; if so, aggregate value added could rise faster than gross output even without any increase in the value-added share within narrow industries.
In preliminary exercises I find a nuanced answer to the composition effect question. The nominal value-added share of gross output for the manufacturing sector rose by about 4-1/2 percentage points from 2005 to 2025. A simple within-industry vs. between-industry decomposition of this sector-wide rise using somewhat narrower industry-level data within manufacturing reveals that, on net, the aggregate rise is dominated by the within-industry component.17 But more than two-thirds of the manufacturing-wide rise can be accounted for by a single industry: chemical products (NAICS 325), one of the largest industries in manufacturing.18 The value-added share of gross output among chemical producers rose by nearly 20 percentage points from 2005 to 2025, contributing 2-1/2 percentage points to the rise in the manufacturing-wide value-added share.19 But the chemical industry, which has a high average value-added share, contributed another 3/4 percentage point via the between-industry channel because the industry gained market share in manufacturing.
Further highlighting the between-industry channel, two other industries contributed at least 1 percentage point each to the manufacturing-wide rise—the food, beverage, and tobacco industry (NAICS 311-312) and the transportation equipment industry (NAICS 336)—both of which are primarily between-industry stories because most of their contributions to the manufacturing-wide rise were due to gains in market share. The reason these large between-industry effects do not show through in my aggregate decomposition exercise is that other industries made sizeable negative between-industry contributions.20 Meanwhile, the computer and electronic product industry (NAICS 334) made no net contribution to the manufacturing-wide rise, as a large 1-1/2 percentage point contribution from its within-industry increase was offset by an equal-sized negative contribution due to loss of (nominal) market share.
In short, composition effects do play some role (in gross terms, at least), but industry-specific study will be critical.
Third, measurement challenges likely play an important role, with price measurement being particularly concerning. As shown in figure 5, deflators for gross output have risen faster than value-added deflators since the early 2000s, especially during the late-2000s and early 2010s. This implies that for a given path of the relevant nominal variables, real value added grows faster than real gross output. But, critically, the BEA does not measure value-added prices, instead inferring them from prices of gross output and intermediate inputs.21
Note: Annual data. Implied deflators. Goods industries are NAICS 11, 21, 31-33. Gray shading indicates NBER recession dates.
Source: National Income and Product Accounts (Bureau of Economic Analysis).
Houseman et al. (2011) find evidence for "offshoring bias" for inputs: price indexes for intermediate inputs have likely grown more than actual input costs due to new foreign, low-cost sources of those inputs, which would imply that real intermediate input use has risen more (and real value added less) than the BEA estimates suggest. Separately, price measurement for high-tech goods has suffered from numerous challenges over this period,22 and the computer and electronics manufacturing industry is the top industry within manufacturing for which real value-added growth has outstripped gross output growth.
Goods GDP has grown more than goods-industry value added
Here it is important to pause to understand how industry value added relates to GDP. GDP is equal to the sum of industry value added across all industries in the economy; but goods GDP is not simply the sum of industry value added across traditional goods-producing industries, because physical goods that originate in those specific industries may acquire additional value added from other, non-goods-producing industries.
Consider an example. A motor vehicle manufactured in a U.S. auto factory contributes to the value added of the manufacturing sector. Once the vehicle leaves the factory gate, it may be shipped on a train or truck (contributing to transportation industry value added) to a dealer lot, where it is sold to a consumer (contributing to retail industry value added). The final value of the vehicle—to be counted in GDP—includes the value that is added by each of the manufacturer, the shipper, and the dealer, as well as any value that was added prior to manufacturing, such as legal or product design services sold to the automaker by the professional services sector. The final purchaser—the buyer who is relevant for GDP accounting—pays for the total value added across the entire supply chain.
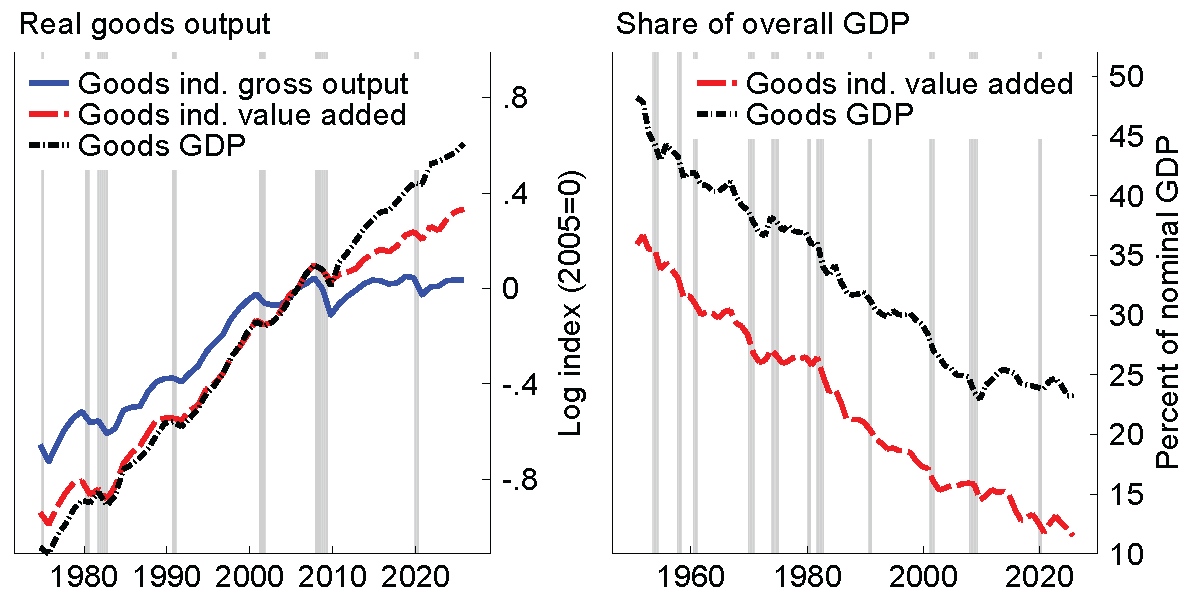
Figure 6, left panel reports goods-industry value added and goods GDP, where "goods GDP" is defined as earlier in this note.23 The two grew at remarkably similar rates prior to the mid-2000s, after which goods GDP grew much faster than goods value added. The right panel shows the share of overall (nominal) GDP that is accounted for by goods-industry value added and goods GDP, with a wider time window for context; both shares trended down fairly steadily from the 1950s through the mid-2000s—with no abrupt drops in reaction to notable events like the "China Shock"—but the goods GDP share has leveled off over the past two decades.
Note: Goods industry value added includes NAICS 11, 21, 31-33. Goods GDP is NIPA goods GDP excluding intellectual property products. Gray shading indicates NBER recession dates.
Source: National Income and Product Accounts (Bureau of Economic Analysis).
Given the explanation provided above of motor vehicle industry value added versus GDP, one plausible implication of figure 6 is that the share of the final value of goods that is accounted for by "services" industries, or industries not directly involved in the harvesting, extraction, or manufacturing of goods, has risen since the mid-2000s. A related perspective is provided by Ozimek (2025), who shows that the number of workers who report themselves as working in the manufacturing sector is more than 15 percent larger, and has fallen by less, than the number formally classified as such in business surveys and censuses, with opposite-sign discrepancies for sectors like wholesale trade and professional services.24
Services value can be added to physical goods at any point in the supply chain. Tito (2025) focuses on value added by wholesalers and retailers, which are largely (though not entirely) downstream of goods harvesting, extraction, and manufacturing; the author also finds that the growing gap between goods GDP and industrial production is most pronounced for consumer goods. Transportation and other industries could also be adding more value to physical goods than in the past.
Other research highlights the growing use of services as inputs to goods production; for examples, Berlingieri (2014) documents increased domestic "outsourcing" of services inputs, particularly in manufacturing, and Ding et al. (2022) document rising prevalence of nonmanufacturing establishments—especially high-tech services establishments—operating within "manufacturing" firms. These services inputs should be captured in goods-industry gross output, so the lack of goods-industry real gross output growth over the last two decades may suggest that the rise in services inputs to goods production is less important for figure 6 than the rise of downstream services content; but the measurement challenges discussed previously make that conclusion highly uncertain.
Finally, adding value both upstream and downstream of goods manufacturing are "factoryless goods producers"—for example, domestic firms that design physical goods in the U.S., have the goods manufactured in foreign establishments, then import the goods and arrange for domestic sales and distribution (see, e.g., Fort 2023 and Kamal 2023).25 These producers contribute to domestic goods GDP without contributing to domestic goods-industry value added.
Whatever the reason for the recent excess growth of goods GDP relative to goods-industry value added, the implication is that "goods production," when measured holistically to account for all the value that is embedded in final goods, has been more resilient than the other measures of goods production reviewed in this note (industrial production, NIPA gross output, and NIPA value added). Moreover, while the most comprehensive measure of goods production has not always kept pace with overall GDP—figure 6 shows that its share declined steadily prior to the mid-2000s—in more recent years, goods production has held its ground relative to the rest of the economy and still accounts for a sizeable share, about one-quarter, of U.S. economic activity.
Concluding thoughts
The argument of this note is that goods production is richer and more important than might be suggested by closely watched measures like manufacturing employment or industrial production, and the differences between the measures that I have highlighted point to important research questions. But readers should not infer that my final measure, goods GDP, is somehow a preferred or sufficient measure of the goods economy, nor that the other measures studied here are unimportant or redundant.
Each measure of the industrial sector noted here has key advantages and uses. For example, industrial production provides a read on industrial output growth that is granular, high frequency (monthly, as opposed to quarterly NIPA data), and timely (being released less than three weeks after the end of each month); and it combines production measures with capacity measures for assessing industrial sector "slack." NIPA-based output measures like value added and GDP lack IP's advantages, but they allow for studying the contributions of the entire goods production supply chain in a consistent economy-wide manner, as I have done here. Goods-industry employment indicators, while entirely lacking a view of production, are critical measures of productive inputs and have direct implications for businesses and households. Still other perspectives are available from comparative international data (e.g., Baldwin 2024).
A better understanding of the changing nature of U.S. goods production must rely on analysis of each of these measures, and others, together.
References
Baldwin, Richard. 2024. "China is the world's sole manufacturing superpower." VOXEU, January 17 (accessed August 31, 2026).
Bayard, Kimberly, Tomaz Cajner, Vivi Gregorich, and Maria D. Tito. 2024. "Are manufacturing jobs still good jobs? An exploration of the manufacturing wage premium." Finance and Economics Discussion Series no. 2022-011r1 (accessed August 24, 2026).
Berlingieri, Giuseppe. 2014. "Why the decline of manufacturing is overstated." World Economic Forum Financial and Monetary Systems, September 29 (accessed August 28, 2026).
Blonz, Joshua, Brigitte Roth Tran, and Erin Troland. 2026. "The canary in the coal decline: Appalachian household finance and the transition from fossil fuels." Journal of Financial Economics 175 (January).
Braun, Robin, Aaron Flaaen, and Sinem Hacıoğlu Hoke. 2024. "Supply vs demand factors influencing prices of manufactured goods." FEDS Notes, February 23 (accessed August 24, 2026).
Bureau of Economic Analysis. 2006. "What is double deflation?" At (accessed August 27, 2026).
Byrne, David and Carol Corrado. 2015. "Recent trends in communications equipment prices." FEDS Notes, September 19 (accessed August 28, 2026).
Byrne, David, Wendy Dunn, and Eugenio Pinto. 2016. "Prices and depreciation in the market for tablet computers." FEDS Notes, December 5 (accessed August 28, 2026).
Byrne, David, Stephen D. Oliner, and Daniel E. Sichel. 2017. "How fast are semiconductor prices falling?" The Review of Income and Wealth 64 no. 3:679-702.
Byrne, David, Stephen D. Oliner, and Daniel E. Sichel. 2017. "Prices of high-tech products, mismeasurement, and the pace of innovation." Business Economics 52:103-113.
Ding, Xiang, Teresa C. Fort, Stephen J. Redding, and Peter K. Schott. 2022. "Structural change within versus across firms: Evidence from the United States." NBER working paper no. 30127 (accessed August 28, 2026).
Dunne, J. Paul. 1995. "The defense industrial base." In Hartley and Sandler, eds., Handbook of Defense Economics chapter 14.
Field, Alexander J. 2022. The Economic Consequences of U.S. Mobilization for the Second World War. Yale University Press.
Fort, Teresa. 2023. "The changing firm and country boundaries of US manufacturers in global value chains." Journal of Economic Perspectives 37 no. 3:31-58.
Garin, Andrew and Jonathan Rothbaum. 2025. "The long-run impacts of public industrial investment on local development and economic mobility: Evidence from World War II." The Quarterly Journal of Economics 140 no. 1:459-520.
Herman, Arthur. 2012. Freedom's Forge: How American Business Produced Victory in World War II. Random House.
Houseman, Susan, Christopher Kurz, Paul Lengermann, and Benjamin Mandel. 2011. "Offshoring bias in U.S. manufacturing." Journal of Economic Perspectives 25 no. 2:111-132.
Juniewicz, Isabel, Daniel Carey, Phil Trammell, and Anson Ho. 2026. "The Nvidia-sized hole in US GDP statistics." Epoch AI, August 24 (accessed August 28, 2026).
Kamal, Fariha. 2023. "A portrait of US factoryless goods producers." In Challenges of Globalization in the Measurement of National Accounts, edited by Nadim Ahmad, Brent Moulton, J. David Richardson, and Peter Van De Ven, 425-450.
Leamer, Edward E. 2008. "Housing IS the business cycle." In Housing, Housing Finance, and Monetary Policy, A Symposium Sponsored by the Federal Reserve Bank of Kansas City.
Leamer, Edward E. 2009. Macroeconomic Patterns and Stories: A Guide for MBAs. Springer-Verlag Berlin Heidelberg.
Leamer, Edward E. 2015. "Housing really is the business cycle: What survives the lessons of 2008-2009?" Journal of Money, Credit, and Banking 47 no. S1:43-50.
Leamer, Edward E. 2024. "Data patterns that reliably precede US recessions." Journal of Forecasting 43:2522-2539.
Organization for Economic Co-operation and Development. 2026. "Trade in value-added." (accessed August 31, 2026).
Ozimek, Adam. 2025. "How many manufacturing workers are there?" Economic Innovation Group, December 8 (accessed August 31, 2026).
Peneva, Ekaterina, Jeremy Rudd, and Daniel Villar. 2025. "Retrospective on the Federal Reserve Board staff's inflation forecast errors since 2019." Finance and Economics Discussion Series no. 2025-069 (accessed August 24, 2026).
Pierce, Justin and Peter K. Schott. 2020. "Trade liberalization and mortality: Evidence from US counties." American Economic Review: Insights 2 no. 1:47-64.
Skousen, Mark. 2024. "Go beyond GDP: Introducing gross output, the 'top line' in national income accounting: The Schumpeter lecture." Mimeo, at https://papers.ssrn.com/sol3/papers.cfm?abstract_id=5002052 (accessed August 24, 2026).
Soto, Paul. 2025. "Research in commotion: Measuring AI research and development through conference call transcripts." Finance and Economics Discussion Series 2025-011 (accessed August 24, 2026).
Syverson, Chad. 2016. "The slowdown in manufacturing productivity growth (PDF)." Brief, Global Economy and Development at Brookings (accessed August 24, 2026).
Tito, Maria. 2025. "Industrial production vs. goods GDP: Two sides of the same coin?" FEDS Notes, January 10 (accessed August 25, 2026).
Whelan, Karl. 2000. "A guide to the use of chain aggregated NIPA data." Finance and Economics Discussion Series (unnumbered), August (accessed August 25, 2026).
Zolas, Nikolas, Zachary Kroff, Erik Brynjolfsson, Kristina McElheran, David N. Beede, Cathy Buffington, Nathan Goldschlag, Lucia Foster, and Emin Dinlersoz. 2020. "Advanced technologies adoption and use by U.S. firms: Evidence from the Annual Business Survey." NBER working paper no. 28290 (accessed August 24, 2026).
1. The views expressed here are solely those of the author and should not be interpreted as reflecting the views of the Board of Governors, its staff, or any other person associated with the Federal Reserve System. Without implication, I thank David Byrne, Fariha Kamal, Christopher Kurz, Norman Morin, and Maria Tito for helpful comments or discussions. Return to text
2. Each figure shown in this note features gray shading indicating NBER recession dates, where I define the recession as starting immediately after the NBER-identified "peak" period and continuing through the NBER-identified "trough" period. The recessions featured in figures showing quarterly data are: 1953:Q3-1954:Q2, 1957:Q4-1958:Q2, 1960:Q3-1961:Q1, 1970:Q1-Q4, 1974:Q1-1975:Q1, 1980:Q2-Q3, 1981:Q4-1982:Q4, 1990:Q4-1991:Q1, 2001:Q2-Q4, 2008:Q1-2009:Q2, and 2020:Q1-Q2. The recessions featured in figures showing monthly data are: August 1953-May 1954, September 1957-April 1958, May 1960-February 1961, January 1970-November 1970, December 1973-March 1975, February 1980-July 1980, August 1981-November 1982, August 1990-March 1991, April 2001-November 2001, January 2008-June 2009, March 2020-April 2020. Return to text
3. See, e.g., Syverson (2016), Zolas et al. (2020), and Soto (2025). Return to text
4. See, e.g., Dunne (1995), Herman (2012), and Field (2022). Return to text
5. See, e.g., Pierce and Schott (2020), Bayard et al. (2024), Garin and Rothbaum (2024), and Blonz et al. (2026). Return to text
6. See, e.g., Braun et al. (2024) and Peneva et al. (2025). Return to text
7. I use the BEA-defined "services GDP" as is reported, for example, in table 1.2.2 of the NIPAs. That table also provides a measure of "goods GDP" composed of inventory investment, government and private investment in equipment, government and private investment in intellectual property products (IPP), goods consumption, and goods net exports. I prefer omitting intellectual property products to focus on physical goods. I construct my bespoke goods GDP measure as a Fischer chained and aggregated index of real BEA goods GDP growth, (negative) real private IPP investment growth, and (negative) real government IPP investment growth; this approach (sometimes called the "chain-subtraction" procedure as in Whelan 2000) is a very close approximation to a finer-grained bottom-up approach. To calculate contributions to GDP growth I use Törnqvist approximation. Return to text
8. For example, on a 4-quarter basis, separate regressions of services, goods, and structures GDP growth components on the change in the unemployment rate produce negative and highly statistically significant coefficients, with t-statistics for services, goods, structures, and goods and structures together of -7, -8, -5, and -8, respectively. Return to text
9. Within goods, durable goods are more volatile and recession-prone than nondurable goods: On a 4-quarter basis, durable goods GDP has contracted meaningfully in all eleven NBER-identified recessions since 1950 (plus one other time in 1952), while nondurable goods GDP maintained positive growth or roughly flat output in seven of the eleven recessions. Return to text
10. There is a conventional wisdom that "housing is the business cycle" (e.g., Leamer 2008, 2015, 2024). But goods production tends to make larger contributions to recessions than structures production: On average since 1950, goods accounted for a larger share of both 1-quarter and 4-quarter GDP growth (or contraction) during NBER recessions, and of 4-quarter GDP growth when 4-quarter GDP growth was negative. Leamer focused on residential investment because of its relatively early business cycle peak and its large contribution to GDP downturns relative to other individual expenditure categories, and he found that various goods categories peak soon after residential investment; see Leamer (2009; start from page 177). Return to text
11. Since 1950, the services component of GDP growth has contracted on a 2-quarter basis on one other occasion (aside from 1953-1954 and 2020): 2011:Q4 (and just barely). The services component has contracted on a 1-quarter basis on many occasions, though these declines have usually been small. Importantly, prior to the 2000s and the introduction of the Quarterly Services Survey, the BEA lacked concrete quarterly data on most services spending; it is possible that the heavy use of modeling for estimating services GDP plays some role its measured business cycle behavior. Return to text
12. The market group tabulation of IP is an alternative to the industry group tabulation; they are separate ways to disaggregate the same total. Return to text
13. Monthly industrial production growth is measured as gross output growth at the narrow industry level then aggregated using value-added weights, which avoid double- or triple-counting the importance of inputs like steel, so it may be thought of as a "hybrid measure" with aspects of both gross output and value added. A further subtle point is that, for IP purposes, value added is calculated as gross output net of energy and materials for industrial production, while NIPA value added also nets out purchased business services. Return to text
14. I construct "goods-industry" value added and gross output using Fisher chained aggregation across the sector-level real value added and gross output, respectively, of agriculture, forestry, fishing, and hunting; mining; and manufacturing (NAICS 11, 21, and 31-33). Notably, the BEA provides gross output and value added for an aggregate of "goods" industries that includes those three industries plus construction (NAICS 23). In unreported exercises, I construct figure 4 using the BEA's definition of goods industries (i.e., including construction), with very similar results. Return to text
15. A potentially related fact is that, per the latest Organization for Economic Co-operation and Development (OECD) data, U.S. manufacturing's share of (nominal) global value added was about 17 percent in 2022, higher than its gross-output share of about 13 percent (a fact noted earlier by Baldwin 2024 using 2020 data). Moreover, the U.S.'s share of global gross output has fallen more than its share of value added (e.g., the share of gross output has fallen about 6.5 percentage points since 2005 while the share of value added has fallen about 4.5 percentage points). These data are from Organization for Economic Cooperation and Development (2026). Return to text
16. Per BEA KLEMS manufacturing data, the share in gross output for each of energy inputs, materials inputs, and purchased services inputs have declined over this period, with the largest declines in services and energy. Return to text
17. I focus on nominals for the composition discussion to abstract from price measurement challenges, which I return to below. At the broad sector level, (nominal) value added as a share of (nominal) gross output in year $$t$$ can be expressed as a gross-output-weighted average of the value-added share at the level of narrower industries: $$\sum_{i} {\theta }_{it}s_{it}$$ where $${\theta }_{it}$$ is industry $$i$$’s gross output as a share of overall manufacturing gross output in year $$t$$, and $$s_{it}$$ is industry $$i$$’s nominal value added as a share of that industry’s nominal gross output. Then the change in the sector-wide value-added share of gross output from time 0 to time $$T$$ is equal to $$\sum_{i} \bar{{\theta }_{i}}\left(s_{iT}-s_{i0}\right)+\sum_{i} ({\theta }_{iT}-{\theta }_{i0})\bar{s_{i}}$$, where an overbar indicates a two-period average (periods 0 and $$T$$). The first term is the “within-industry” term capturing the change in the value-added share within narrow industries, and the second term is the “between-industry” term capturing changes in the gross-output weights of industries (there are other ways to do within-between decompositions; this one is appropriately simple for this note). Using 18 (mostly) 3-digit NAICS industries within manufacturing, and examining the change from 2005 through 2025, I find that the within-industry term accounts for 115 percent of the rise in the sector-wide value-added share. The dominant share of the within-industry term is robust to varying the start and end years of the analysis and to a specification using narrower industry detail (37 industries) but covering 2005 to 2024 (the latest available in KLEMS data). I also conduct this exercise using the real value-added share—which conflates price indexes as well—and obtain a broadly similar result. Return to text
18. To calculate industry contributions to the total value-added share increase for manufacturing, for each industry I take the sum of the industry's within-industry and between-industry contributions as described in the decomposition above. Return to text
19. Within the chemicals industry, the largest contributors to the rise in the value-added share are pharmaceutical and other medicine manufacturing (NAICS 3254) and basic chemical manufacturing (NAICS 3251); each of these industries saw an increase in both their value-added share of gross output and their gross output as a share of the manufacturing sector. Separately, looking at the intermediate input share of gross output for chemicals in general, the largest declines are observed for, in order, materials inputs, purchased services inputs, and energy inputs. Return to text
20. The most notable example of a negative contribution is printing and related support activities (NAICS 323), which has a relatively high value-added share of gross output and saw its market share in manufacturing decline. Return to text
21. The BEA uses "double deflation" to measure real value added: gross output and intermediate inputs are separately deflated, then real value added is calculated as the difference between real gross output and real intermediate inputs (Bureau of Economic Analysis 2006). Return to text
22. Price measurement issues for high-tech goods are the subject of a vast literature. See, for examples, Byrne and Corrado (2015); Byrne, Dunn, and Pinto (2016); Byrne, Oliner, and Sichel (2017a, 2017b); and various other research by those authors. Return to text
23. Recall that I use NIPA goods GDP excluding investment in intellectual property products (IPP), but in unreported exercises I find results are broadly similar when I include structures in the GDP measure as well. I mention this because there is a modest tension in my analysis: goods industries produce inputs to structures investment. For example, in the Federal Reserve Board's industrial production statistic, roughly 6 percent of value added is accounted for by the "construction supplies" market group. In unreported exercises, I construct figure 6 including construction among "goods industries" and using goods and structures GDP instead of goods GDP, finding similar results: After the mid-2000s goods and structures GDP grows faster than goods-industry value added, which grows faster than goods-industry gross output, though GDP and value added have not grown as much as in my narrower "goods" formulation. Of course, both goods and structures GDP and goods-industry value added account for higher shares of overall GDP than their narrower counterparts; but similar to my narrower approach, goods and structures GDP's share flattened out after the GFC while goods-industry value added's share continued to move down. Return to text
24. I highlight this fact not to suggest that self-reported industry classifications are more accurate than business-reported classifications but simply to observe that many workers apparently think of themselves as being involved in goods manufacturing despite not working at establishments that meet classification criteria to be counted under manufacturing. In the most recent data reported, Ozimek (2025) finds that household-reported manufacturing employment in the American Community Survey (ACS) was 15.1 million in 2023, while establishment-reported manufacturing employment in the Current Employment Statistics (CES) was 12.9 million. From 2005 to 2023, "manufacturing" employment fell by 6 percent in the ACS and 9 percent in the CES. Each of manufacturing, mining, and construction exhibit positive gaps between household- and establishment-reported employment, while large negative gaps are seen for wholesale trade, professional services, information, and arts and hospitality. Return to text
25. See Juniewicz et al. (2026) for an argument that even goods GDP may fail to capture some arrangements of factoryless goods production. Return to text
Decker, Ryan A. (2026). "Beyond the factory gate: The continued importance of goods production," FEDS Notes. Washington: Board of Governors of the Federal Reserve System, October 02, 2026, https://doi.org/10.17016/2380-7172.4184.
Disclaimer: FEDS Notes are articles in which Board staff offer their own views and present analysis on a range of topics in economics and finance. These articles are shorter and less technically oriented than FEDS Working Papers and IFDP papers.