FEDS Notes
January 19, 2024
Changes in the U.S. Economy and Rural-Urban Employment Disparities
In the United States, long-term changes in the nature of the economy – including advances in technological innovation and automation, declines in the extraction of certain energy resources, increases in globalization, and a shift to the "knowledge-based" economy – have coincided with disproportionately negative employment outcomes in many rural, or "nonmetro," communities, especially for prime working-age men and those with less than a high school degree.1 These relatively large, negative employment effects may be due, in part, to differences in the historical industrial composition of nonmetro economies (e.g., a relatively large concentration in manufacturing), as well as the lower levels of educational attainment of their residents. In addition to these historical factors, remote places may face an inherent disadvantage in the modern knowledge economy where the clustering of highly skilled workers and firms in dense areas generate increasing returns.
Recent Changes in the U.S. Economy
Over the past several decades, the U.S. economy has changed in ways that have had disproportionately large negative employment effects in several industries that have historically been more prevalent in nonmetro communities than metro ones. One such change that has affected numerous nonmetro-centric industries is the increase of technological innovation and automation, which has exerted downward pressure on employment in the agriculture, manufacturing, and mining industries, all of which have long been more prevalent in the nonmetro economy.2
Agriculture
Between 2000 and 2021, farm proprietor and farm wage employment decreased by just over 500,000, going from 3.1 million jobs to 2.6 million (see Figure 1). This represents a 17% decrease in agricultural employment over the last two decades. Over this same time, the value of agricultural production increased $152 billion, going from $331 billion to $478 billion, representing a 47% increase. Recent research exploring the drivers of this increase in productivity has found major drivers to be the use of improved technology and modernized farming practices.3
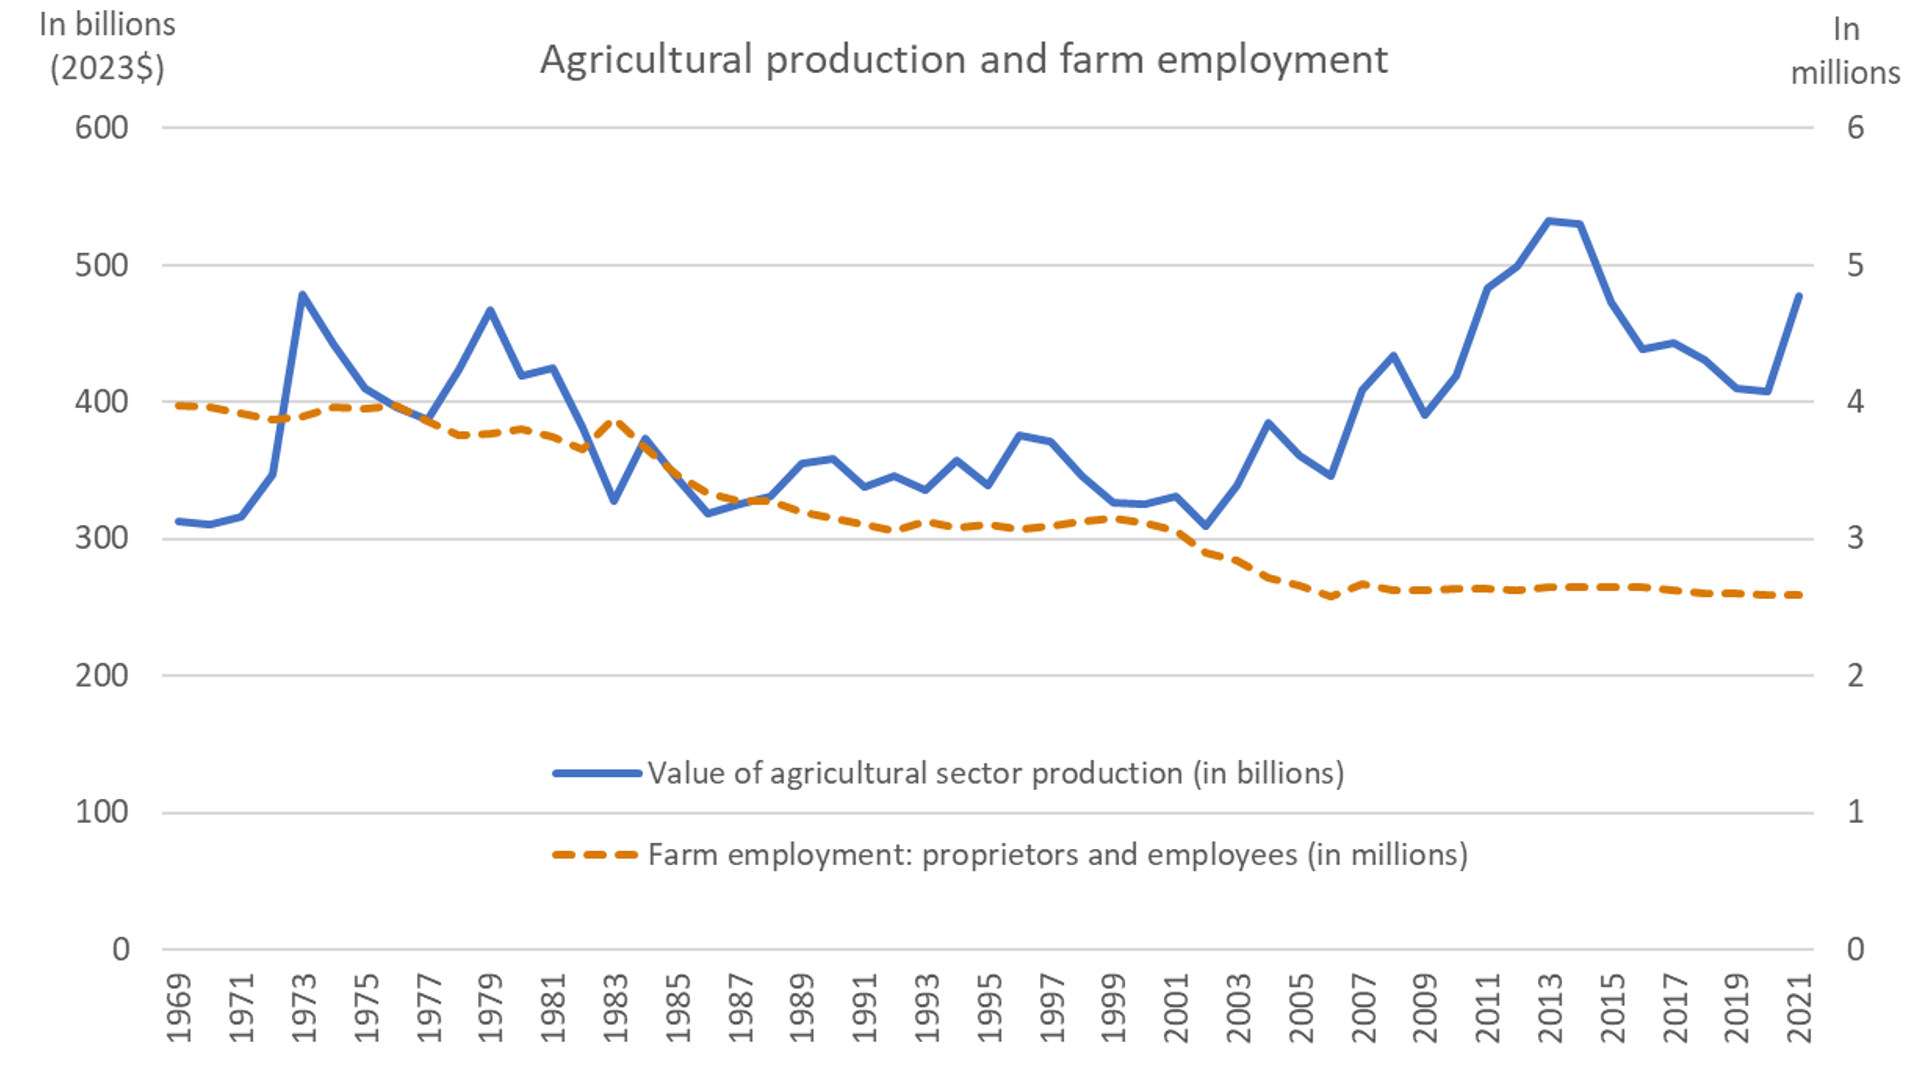
Sources: U.S. Bureau of Economic Analysis, USDA Farm Income and Wealth Statistics
While agricultural employment made up just 1.3% of overall employment in 2021, it represented 5.6% of employment in nonmetro areas. Not surprisingly, more than half (51%) of farm employment is in nonmetro areas, so these long-term employment declines in the agricultural industry have had disproportionately large effects on nonmetro areas.4
Despite the long-term employment decline in the agriculture industry, research has shown that nonmetro communities with above-average concentrations in agricultural employment had lower increases in unemployment during the Great Recession, recovered more quickly afterwards, and as a whole have been associated with lower levels of poverty.5
The long-term decline in agricultural employment in nonmetro areas was more than offset by an increase in manufacturing employment between at least the early-1970s and the mid-1990s, primarily in regions of the U.S. that offered low labor costs.6 However, in the mid-1990s, manufacturing employment in both metro and nonmetro areas began to erode, as the next section explores.
Manufacturing
As with the agricultural industry, in recent years the U.S. manufacturing industry has increased output while simultaneously decreasing employment (see Figure 2). Indeed, value-add (gross output minus intermediate inputs) in the manufacturing industry increased 40% in real terms between 2001 and 2021, while manufacturing employment in both metro and nonmetro areas declined by over 20%. Manufacturing employment was especially hard-hit during the Great Recession and has only partially recovered since then.
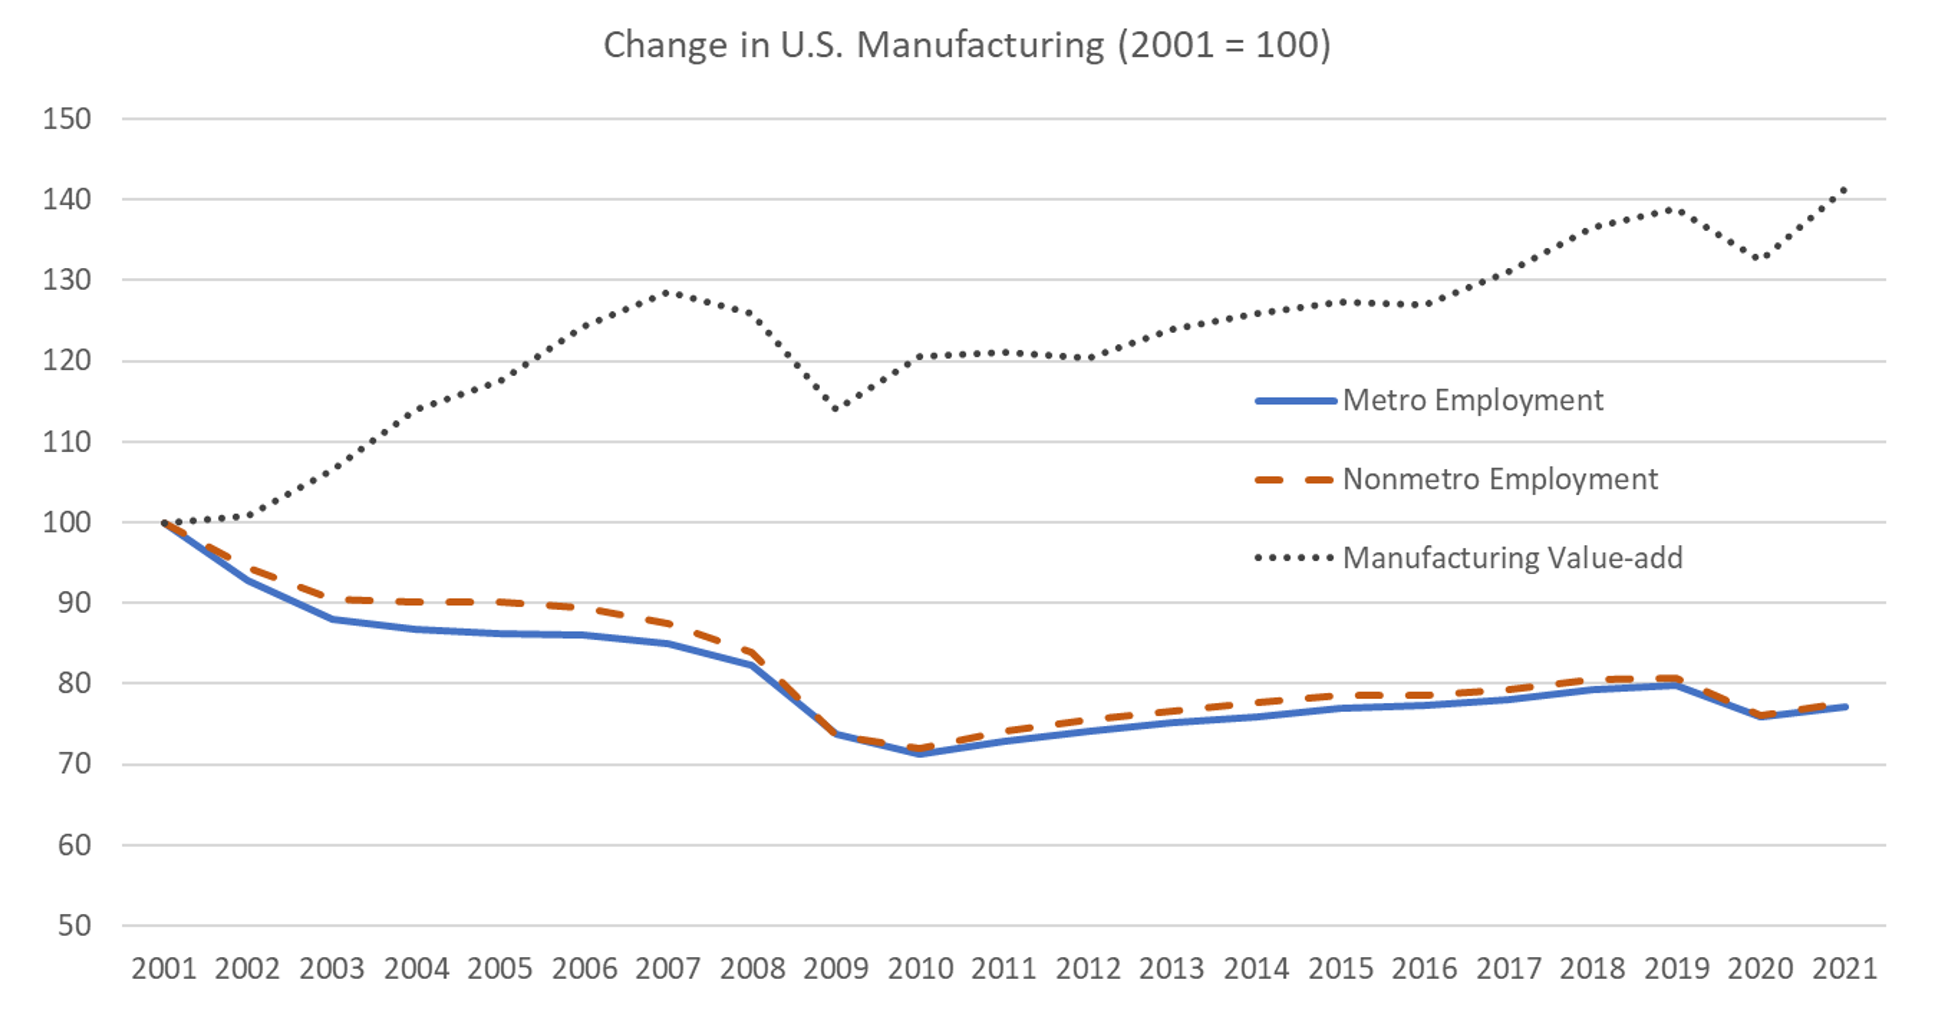
Sources: U.S. Bureau of Economic Analysis, U.N. Industrial Development Organization
While metro and nonmetro areas experienced nearly equivalent percentage declines in manufacturing employment over the past two decades, nonmetro areas were more exposed to the manufacturing industry in terms of the share of employment and personal income that each type of area derived from the manufacturing industry (see Figure 3). Therefore, this decline represented a greater share of overall employment and income in nonmetro areas than it did in metro areas. This finding on the relative concentration of manufacturing in nonmetro areas is consistent with recent research by others.7 Other recent research has found that the manufacturing employment declines experienced in the mid-1990s and 2000s were more severe in outlying, less-dense counties that had significant shares of employment in manufacturing and lower levels of educational attainment. Thus, these nonmetro counties had fewer opportunities to diversify their economy when these declines hit relative to the denser, more highly educated metro areas that were hit by manufacturing employment declines in earlier decades.8
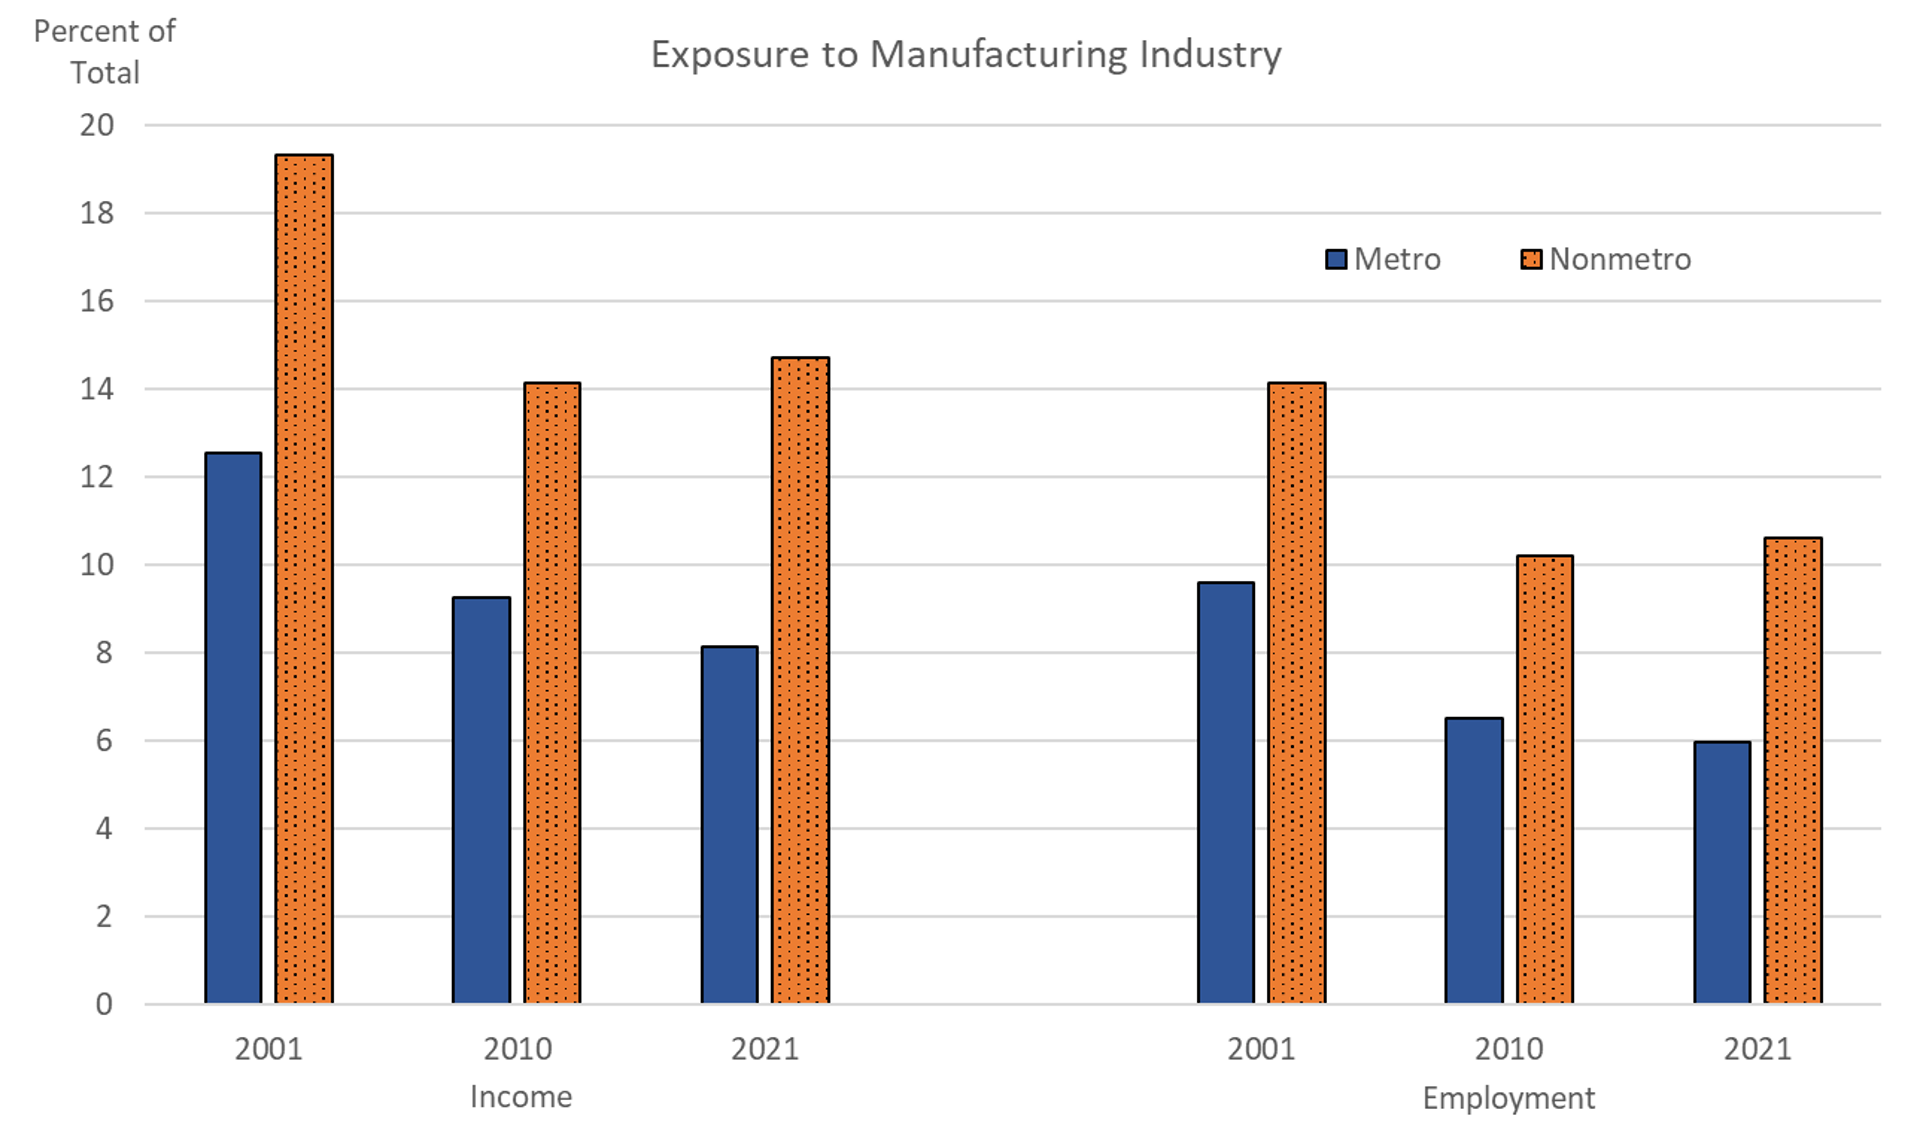
Source: U.S. Bureau of Economic Analysis
Contrary to the recent challenges facing manufacturing communities outlined above, research has found that between the mid-1960s and the mid-1990s, local concentrations in the manufacturing industry were associated with lower poverty rates and more robust overall employment growth, with the exception of the two recessionary periods during the late 1970s and early 1980s.9 However, recent research has also shown that manufacturing employment declines over the past couple decades have been associated with increasingly adverse effects relative to earlier periods, and that the protective effect of higher concentrations in manufacturing have largely eroded.10
Mining
Over the past couple decades, the natural resource industry has seen a similar pattern of growth in productivity alongside shrinking demand for workers. Between 2011 and 2021, crude oil production in the U.S. nearly doubled and natural gas production increased by more than half. While the boom in oil and gas extraction initially led to a significant increase in related employment, those employment gains have since completely reversed, even as the higher levels of production have remained (see Figure 4). This has been due, in part, to increased drilling productivity.11
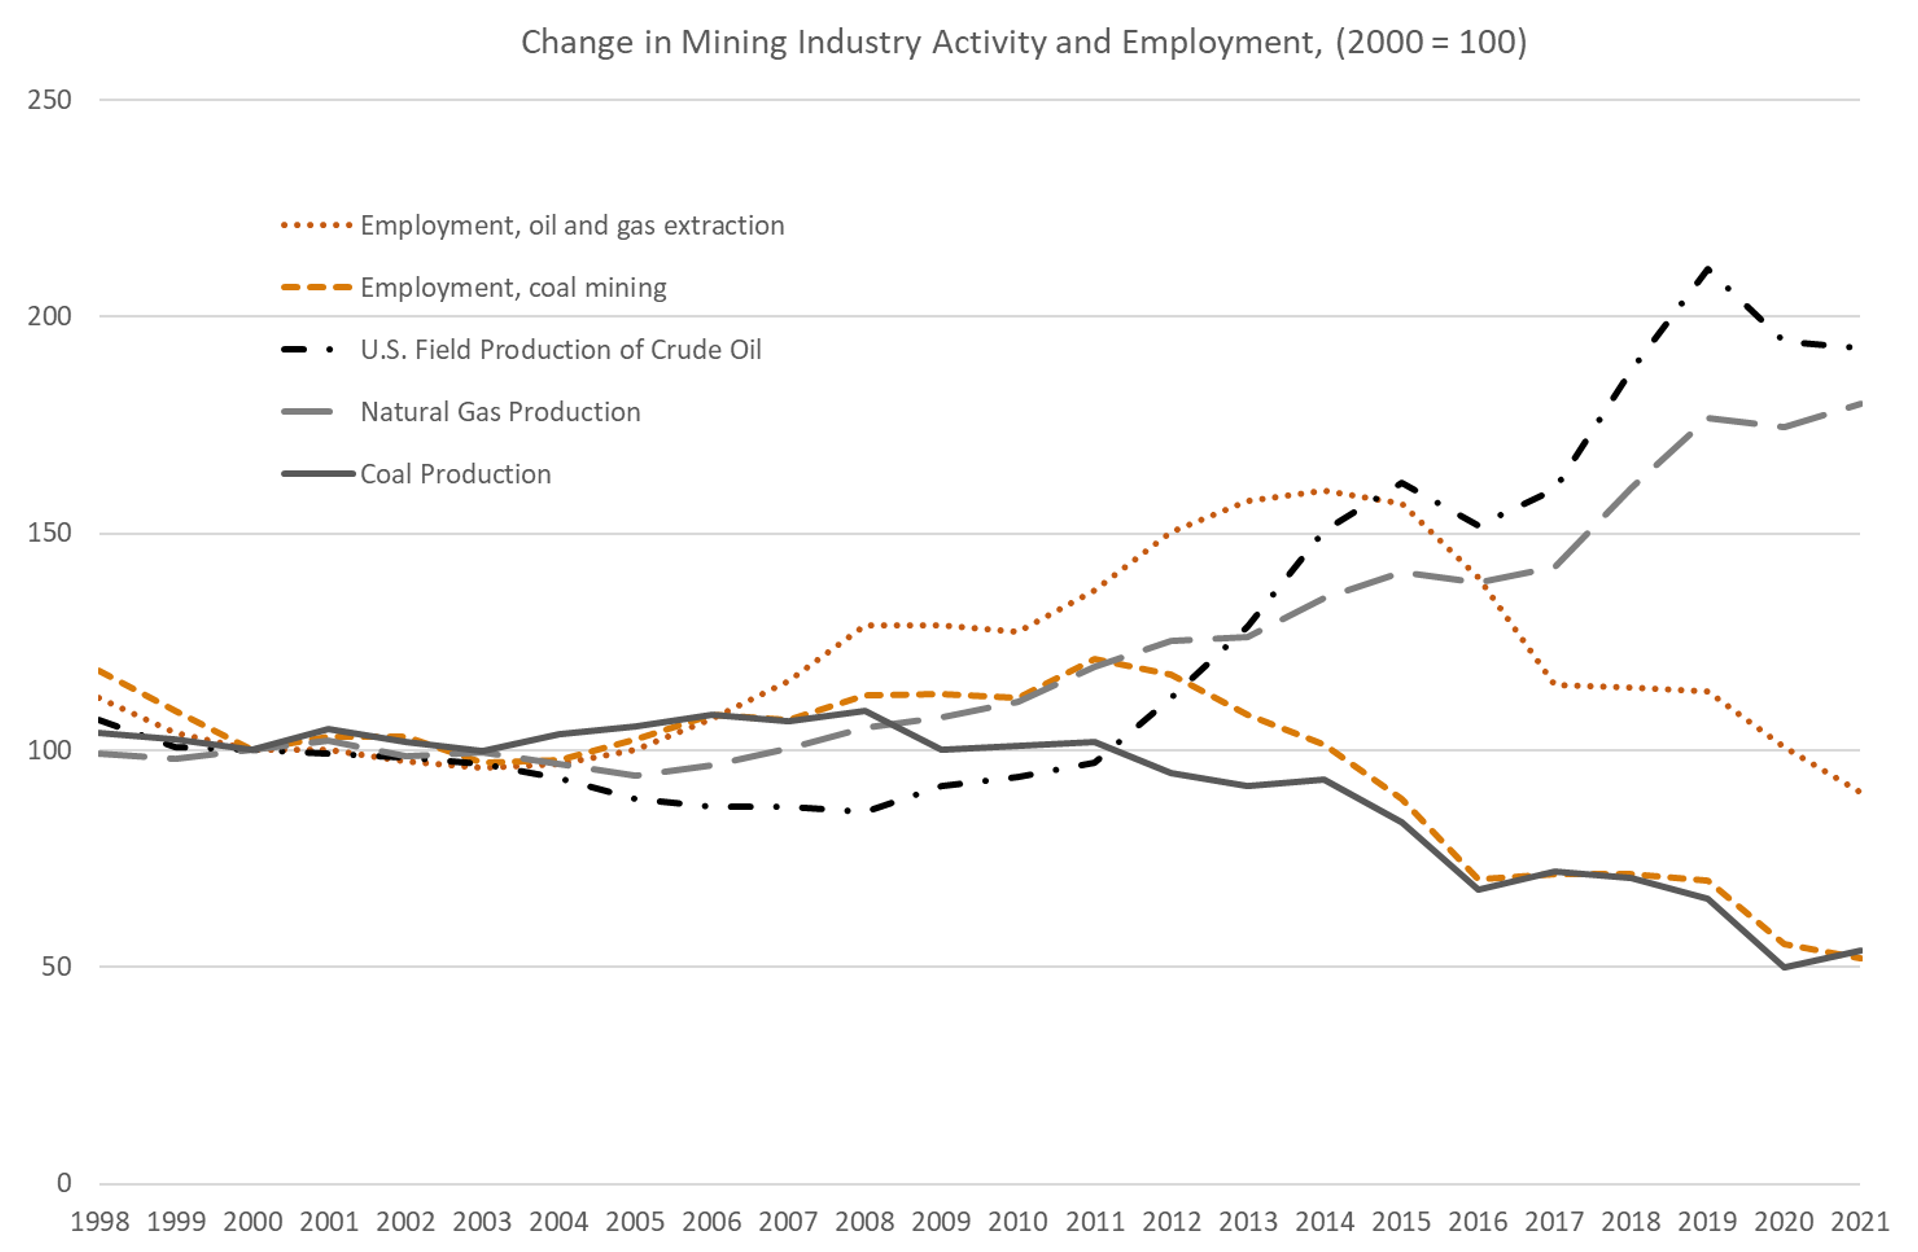
Sources: U.S. Bureau of Economic Analysis, U.S. Energy Information Administration
Over this same period, coal production and coal mining employment declined by almost half. This decline in coal mining employment reflects two trends. The first is the overall decline in coal production as a result of weaker demand. The second is the shift in production from Appalachian mines, most of which use more labor-intensive underground mining techniques, to mines in the Interior and Western regions that use more machinery-intensive mining techniques, such as longwall mining and surface mining.12
While mining employment makes up a very small share of employment in both metro and nonmetro areas (0.3% and 1.4% of overall employment, respectively), its share of employment in nonmetro areas is four times larger than in metro areas. In addition, mining employment is highly concentrated, with the top ten states containing more than 70% of overall mining industry employment.13
The "knowledge-based" economy
In recent years, high-skilled work has become an increasing share of the overall U.S. economy and a larger driver of economic growth.14 The segment of the economy that relies on such high-skilled work is commonly referred to as the "knowledge-based" economy. The growth in the knowledge-based economy has not been evenly distributed across the U.S., with dense metro having higher shares of their employment in high-skilled occupations relative to less dense areas (see Figure 5).
Figure 5. Occupational employment shares among working-age adults by commuting zone population density and occupational skill-level, relative to 1970 mean: 1970-2015
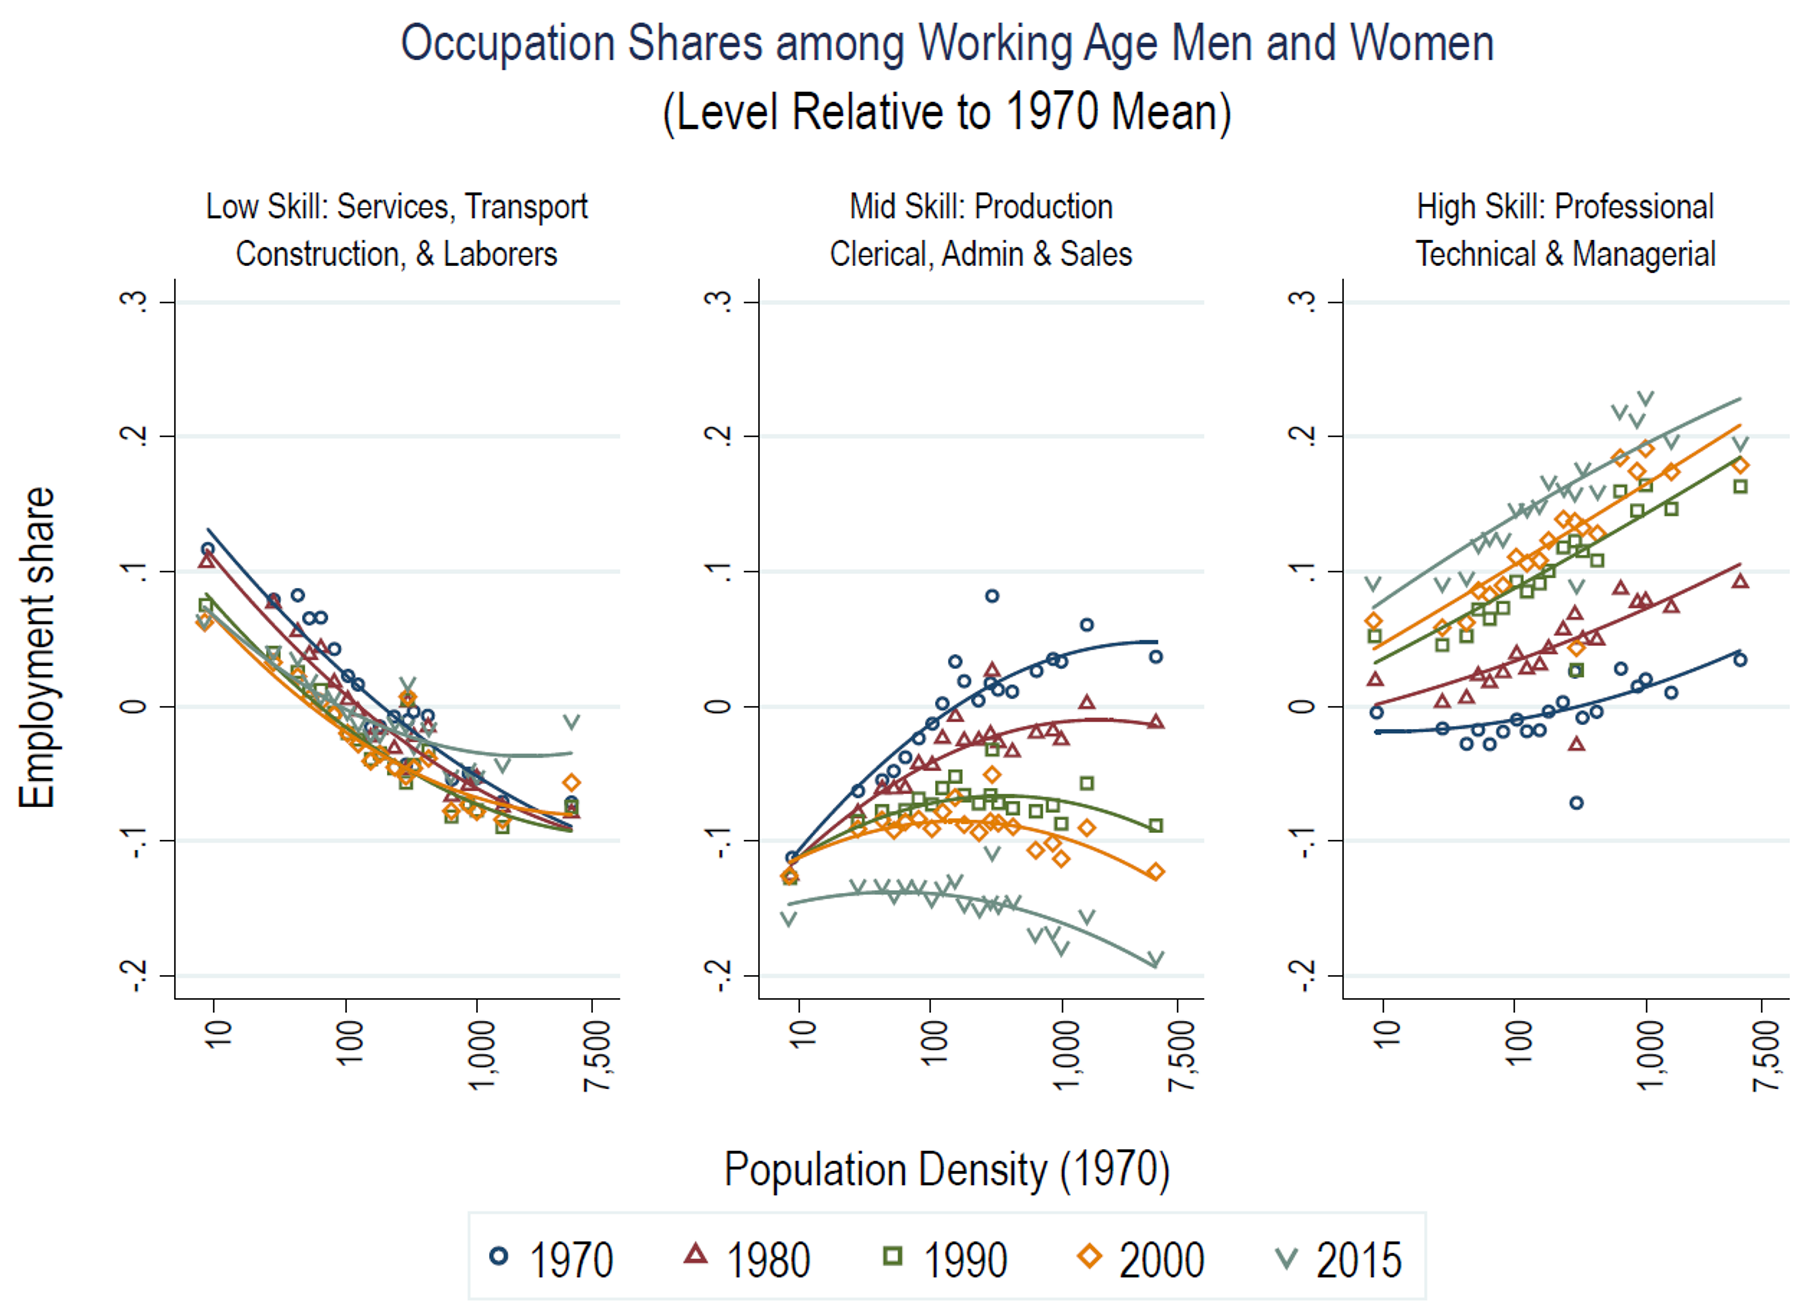
Notes: Figure is constructed using U.S. Census of Population data for 1970, 1980, 1990, and 2000, and pooled American Community Survey (ACS) data for years 2014 through 2016, sourced from IPUMS (Ruggles et al. 2018). Occupational classifications are harmonized across decades using the classification scheme developed by Dorn (2009) and distilled to the level of 722 consistent local labor markets (AKA, Commuting Zones) following the procedures in Autor and Dorn (2013). Each plotted point represents approximately 5 percent of the working-age population in the relevant year.
Source: David H. Autor. (2019). Work of the Past, Work of the Future. AEA Papers and Proceedings, 109, pgs. 1-32.
This bias for high-skill occupations to concentrate in denser areas has increased over the past 50 years and has coincided with a decline in the share of middle-skill occupations across all areas, regardless of population density. This loss of middle-skill occupations has been more profound in denser areas given that such occupations were highly concentrated in denser areas at the beginning of this period (see the middle panel of Figure 5).
This concentration of high-skill occupations coincides with a greater prevalence of more highly educated workers (see Table 1), which may be drawn to dense areas by the greater returns to locating in an urban area for higher-skill workers relative to the return for lower-skill workers.15 While nonmetro areas experienced a large increase in the share of the population with a bachelor's degree or higher between 2000 and 2021 (an increase of 6.2 percentage points), metro areas saw even larger gains (an increase of 9.5 percentage points), such that by the end of the period, the gap between metro and nonmetro areas had grown by 3.3 percentage points.
Table 1. Share of the population with a bachelor’s degree or higher, 2000 and 2021
| Metro Status | 2000 | 2021 | Change |
|---|---|---|---|
| Metro | 26.1 | 35.6 | 9.5 |
| Nonmetro | 14.9 | 21.1 | 6.2 |
| Total | 24.3 | 33.6 | 9.3 |
| Metro-Nonmetro Difference | 11.2 | 14.6 | 3.3 |
Source: U.S. Census Bureau, American Community Survey, 5-year Estimates, 2017-2021; Decennial Census, 2000
This increase in relative education levels for metro areas is at least partly a result of unequal access to institutions of higher education, whereby individuals living in metro areas have greater access to such institutions.16 This disparity in access, as well as lower returns to investing in higher education in nonmetro areas, causes fewer nonmetro residents to obtain higher education and forces many of those that do to move to metro areas.17 Nonmetro youth also appear more likely than metro youth to attend two-year institutions and those that focus primarily on sub-baccalaureate credentials, and less likely to attend four-year institutions, more-selective institutions, and those that confer graduate degrees.18 Once nonmetro students move to metro areas for education, many end up staying or moving to other metro areas to earn the greatest return on their human capital investment, among other reasons.19 While some nonmetro-to-metro migrants that obtain higher education eventually return to nonmetro communities, many also remain in metro areas and thereby contribute to metro-nonmetro disparities in rates of educational attainment.
Employment Trends
Partly as a result of these changes in the U.S. economy, nonmetro communities have experienced less employment growth over at least the past two decades.20 In fact, nonmetro communities overall had not yet recovered the jobs they lost during the Great Recession when the COVID-19 pandemic hit in 2020 (see Figure 6).
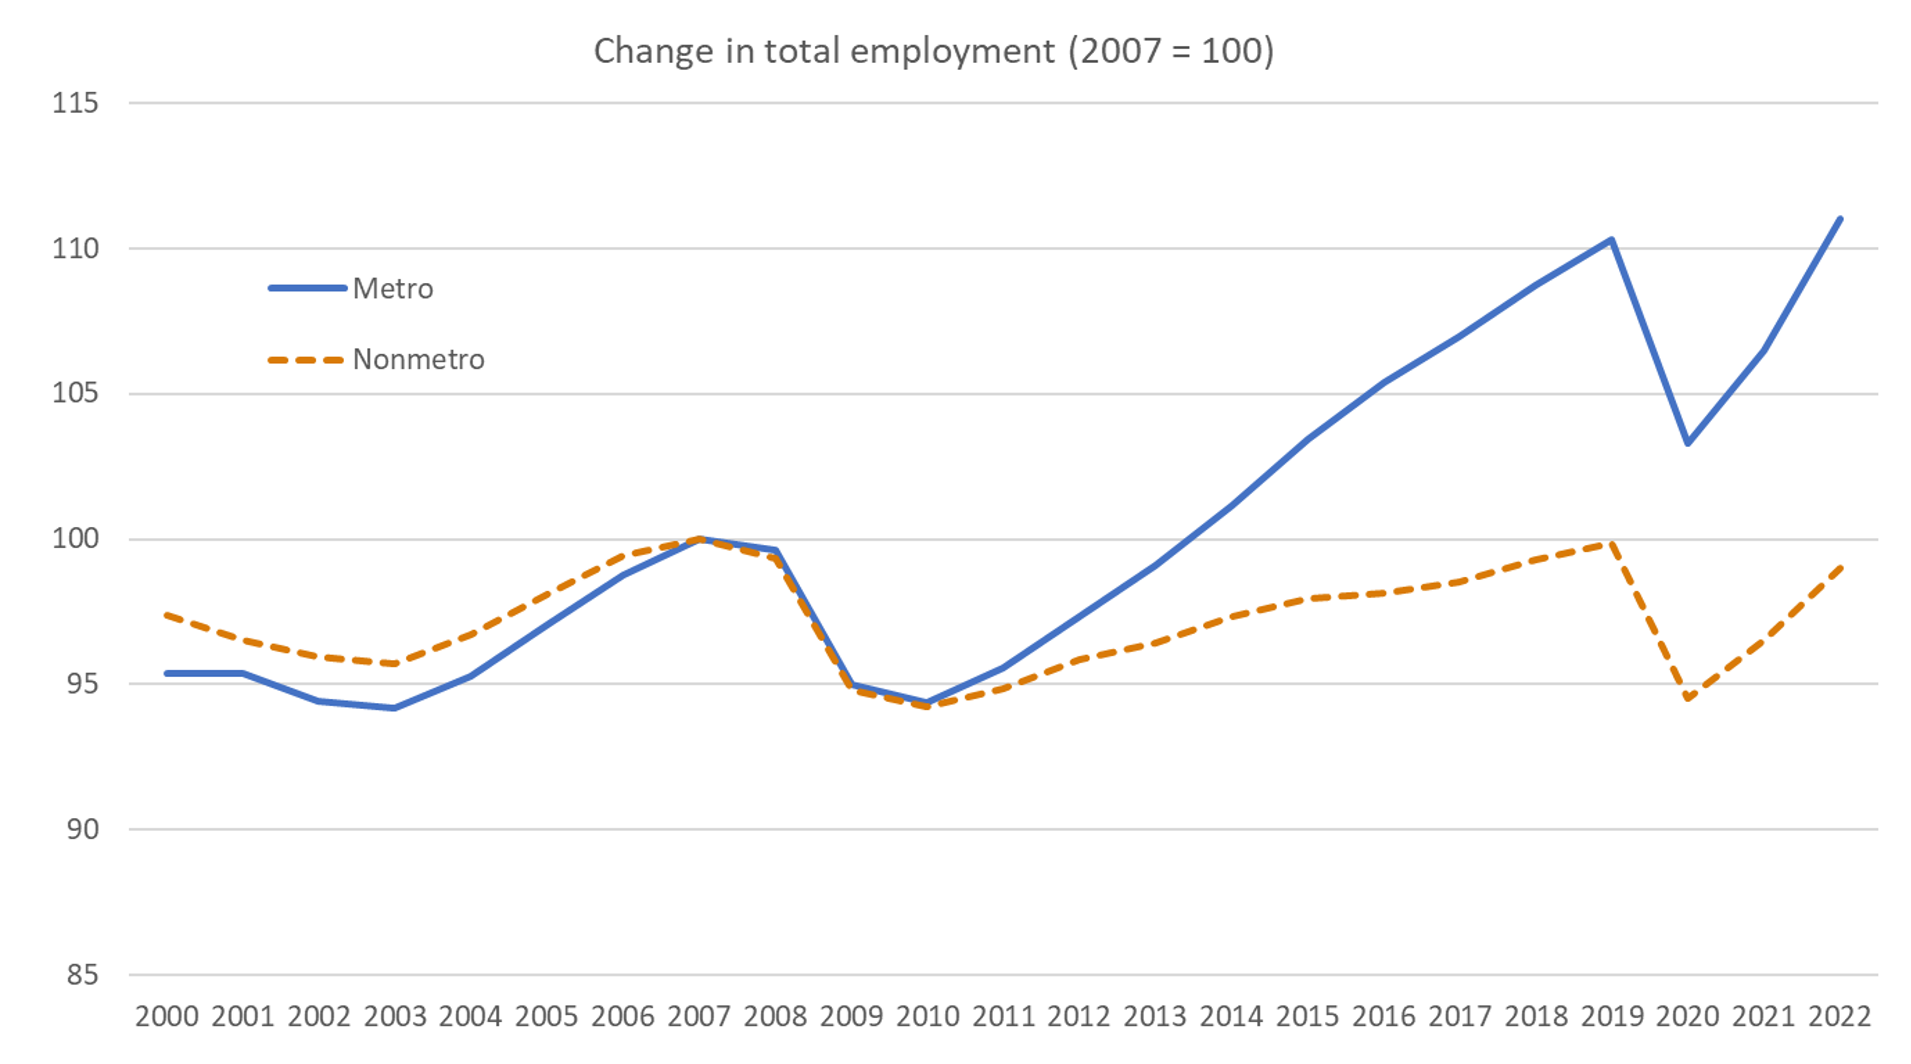
Source: BLS, Quarterly Census of Employment and Wages, Annual Averages
While illustrative, these metro-nonmetro differences in overall employment do not tell the whole story. Importantly, employment levels are affected by changes in the size of the overall population as well as the population's age, sex, and educational composition.21 Thus, aggregate employment differences may mask the differential effects that recent changes in the economy have had on specific groups, such as prime working age men and those with lower levels of educational attainment. As such, these aggregate figures obscure differences in employment trends across population groups.
To explore these important nuances, the section below reviews the employment-to-population rates of metro and nonmetro communities by age, sex, and the majority-minority and persistent poverty status of the county, as well as how those rates have changed over the past 20 years.
While it is beyond the scope of this FEDS Note, it is important to acknowledge that the employment rate itself does not tell the whole story of how these economic shifts have affected workers and communities. Recent changes in the type of jobs and industries people are employed in, the number of hours they work, the predictability of their schedules, and the structure of their employment relationship with their employer, have had significant effects on worker incomes and overall well-being in recent years, which is another key indicator of individual and community health. While having a disproportionate effect in nonmetro areas, these broader shifts in the nature of employment have affected workers in both metro and nonmetro areas.22
Employment-to-population rates by age, sex, and community majority-minority and persistent poverty status
As shown in Table 2, in 2021, metro areas had higher employment-to-population rates for most age groups, with the exception being those between 16 and 24 years old.23 These metro-nonmetro differences were much larger for men than they were for women. The differences between metro and nonmetro areas were even greater for majority-minority counties than they were for all counties (see Table 3), especially for prime working-age men (age 25-54), whose employment rates were 15 percentage points lower in nonmetro majority-minority counties than they were in metro majority-minority counties. Metro-nonmetro differences were also stark for prime working-age men in persistently poor counties (see Table 4). The finding that recent changes in employment rates have been worse for men than for women, and have been negative for the most disadvantaged populations, is consistent with recent research, including on the effect of exposure to automation on future income mobility.24
Table 2. Employment-to-population rate by age and sex, all counties, 2021
| Age Group | Male | Female | ||||||
|---|---|---|---|---|---|---|---|---|
| (n=1,251) | (n=1,970) | (n=1,251) | (n=1,970) | |||||
| Metro | Nonmetro | Diff. | Stat. Sign. | Metro | Nonmetro | Diff. | Stat. Sign. | |
| 16 to 24 years | 50.9 | 52.0 | -1.1 | *** | 52.3 | 52.6 | -0.3 | |
| 25 to 54 years | 84.2 | 76.2 | 8.0 | *** | 74.3 | 70.7 | 3.6 | *** |
| 55 to 64 years | 69.1 | 61.1 | 8.0 | *** | 59.1 | 54.0 | 5.1 | *** |
| 65 years and over | 22.5 | 19.5 | 3.0 | *** | 14.8 | 13.4 | 1.4 | *** |
| 16 years and over | 65.7 | 57.3 | 8.4 | *** | 56.2 | 50.4 | 5.7 | *** |
Note: *** = significant at the 99% level
Source: U.S. Census Bureau, American Community Survey, 5-year Estimates, 2017-2021
Table 3. Employment-to-population rate by age and sex, majority-minority counties, 2021
| Age Group | Male | Female | ||||||
|---|---|---|---|---|---|---|---|---|
| (n=249) | (n=232) | (n=249) | (n=232) | |||||
| Metro | Nonmetro | Diff. | Stat. Sign. | Metro | Nonmetro | Diff. | Stat. Sign. | |
| 16 to 24 years | 46.2 | 42.9 | 3.3 | *** | 46.6 | 40.9 | 5.7 | *** |
| 25 to 54 years | 83.1 | 68.1 | 15.0 | *** | 72.5 | 65.8 | 6.7 | *** |
| 55 to 64 years | 68.2 | 55.4 | 12.8 | *** | 57.4 | 50.7 | 6.6 | *** |
| 65 years and over | 22.9 | 19.5 | 3.5 | *** | 14.8 | 13.5 | 1.3 | *** |
| 16 years and over | 65.7 | 52.5 | 13.1 | *** | 55.4 | 47.3 | 8.1 | *** |
Note: *** = significant at the 99% level
Source: U.S. Census Bureau, American Community Survey, 5-year Estimates, 2017-2021
Table 4. Employment-to-population rate by age and sex, persistent poverty counties, 2021
| Age Group | Male | Female | ||||||
|---|---|---|---|---|---|---|---|---|
| (n=139) | (n=334) | (n=139) | (n=334) | |||||
| Metro | Nonmetro | Diff. | Stat. Sign. | Metro | Nonmetro | Diff. | Stat. Sign. | |
| 16 to 24 years | 38.3 | 41.8 | -3.6 | *** | 39.4 | 40.7 | -1.4 | |
| 25 to 54 years | 75.7 | 65.0 | 10.7 | *** | 67.8 | 63.7 | 4.2 | *** |
| 55 to 64 years | 56.7 | 50.0 | 6.7 | *** | 48.8 | 45.6 | 3.2 | *** |
| 65 years and over | 17.3 | 16.7 | 0.5 | 10.8 | 11.9 | -1.1 | *** | |
| 16 years and over | 56.6 | 49.0 | 7.6 | *** | 48.9 | 44.7 | 4.2 | *** |
Note: *** = significant at the 99% level
Source: U.S. Census Bureau, American Community Survey, 5-year Estimates, 2017-2021
This may be because the industries experiencing some of the most significant employment declines in nonmetro areas in recent years have included things like manufacturing and farming, as discussed above, which have traditionally been male-dominated industries.25 In contrast, the industries experiencing some of the most significant employment gains in nonmetro areas in recent years have included things like health care, social assistance, and accommodation and food services, which have traditionally been female-dominated industries.26
There are also significant metro-nonmetro differences in employment-to-population rates by educational attainment (see Table 5). The metro-nonmetro difference is largest for those with less than a high school degree and gets smaller the more education one has. This pattern also generally holds true when looking at majority-minority counties and persistent poverty counties (see Table 6 and Table 7, respectively).27
Table 5. Employment-to-population rate by educational attainment, all counties, 2021
| (n=1,251) | (n=1,970) | |||
|---|---|---|---|---|
| Educational Attainment | Metro | Nonmetro | Diff. | Stat. Sign. |
| Less than high school graduate | 57.2 | 46.2 | 11.0 | *** |
| High school graduate (including equivalency) | 68.5 | 64.2 | 4.3 | *** |
| Some college or associate's degree | 76.0 | 73.3 | 2.8 | *** |
| Bachelor's degree or higher | 84.6 | 82.7 | 1.9 | *** |
| Total population 25 to 64 years | 75.5 | 68.9 | 6.6 | *** |
Note: *** = significant at the 99% level
Source: U.S. Census Bureau, American Community Survey, 5-year Estimates, 2017-2021
Table 6. Employment-to-population rate by educational attainment, majority-minority counties, 2021
| (n=249) | (n=232) | |||
|---|---|---|---|---|
| Educational Attainment | Metro | Nonmetro | Diff. | Stat. Sign. |
| Less than high school graduate | 58.5 | 44.9 | 13.6 | *** |
| High school graduate (including equivalency) | 67.3 | 58.7 | 8.6 | *** |
| Some college or associate's degree | 74.7 | 69.5 | 5.3 | *** |
| Bachelor's degree or higher | 84.0 | 80.2 | 3.8 | *** |
| Total population 25 to 64 years | 74.4 | 63.3 | 11.0 | *** |
Note: *** = significant at the 99% level
Source: U.S. Census Bureau, American Community Survey, 5-year Estimates, 2017-2021
Table 7. Employment-to-population rate by educational attainment, persistent poverty counties, 2021
| (n=139) | (n=334) | |||
|---|---|---|---|---|
| Educational Attainment | Metro | Nonmetro | Diff. | Stat. Sign. |
| Less than high school graduate | 47.1 | 36.7 | 10.4 | *** |
| High school graduate (including equivalency) | 59.7 | 55.4 | 4.3 | *** |
| Some college or associate's degree | 69.4 | 67.1 | 2.3 | *** |
| Bachelor's degree or higher | 82.2 | 79.7 | 2.5 | *** |
| Total population 25 to 64 years | 67.4 | 59.9 | 7.5 | *** |
Note: *** = significant at the 99% level
Source: U.S. Census Bureau, American Community Survey, 5-year Estimates, 2017-2021
As discussed above with respect to male-female differences, these disparities are consistent with the recent economic shifts described in the first section of this note, whereby employment has declined in industries that have not traditionally required higher education (i.e., manufacturing) and which are more highly concentrated in nonmetro areas, while increasing in industries that do require higher education (i.e., professional and technical services), which are more highly concentrated in metro areas. The remaining job opportunities for those with low levels of education (i.e., low-skill service-oriented occupations) tend to be more readily available in metro areas where there is a denser customer base.
Table 8 and Table 9 show how the employment-to-population rate changed between 2000 and 2021 in metro and nonmetro areas for men and women, respectively. The tables also break this down for majority-minority and persistent poverty counties. A few things stand out from these tables. First, employment-to-population rates improved for men 25 years and over in metro areas and improved for men 55 years and over in nonmetro areas. Notably, while employment rates improved for prime working age men in metro areas over this period, they declined for this group in nonmetro areas from an already-lower rate.
Table 8. Employment-to-population rates by age, Men only, 2000 and 2021
| All Counties | Metro | Nonmetro | ||||||
|---|---|---|---|---|---|---|---|---|
| Age Group | 2000 | 2021 | Diff. | Stat. Sign. | 2000 | 2021 | Diff. | Stat. Sign. |
| 16 to 24 years | 56.5 | 50.9 | -5.5 | *** | 53.7 | 52.0 | -1.6 | *** |
| 25 to 54 years | 82.2 | 84.2 | 2.0 | *** | 78.7 | 76.2 | -2.5 | *** |
| 55 to 64 years | 63.9 | 69.1 | 5.3 | *** | 58.1 | 61.1 | 3.0 | *** |
| 65 years and over | 17.5 | 22.5 | 4.9 | *** | 16.9 | 19.5 | 2.6 | *** |
| 16 years and over | 67.3 | 65.7 | -1.6 | *** | 61.7 | 57.3 | -4.5 | *** |
| Majority-Minority Counties | ||||||||
| 16 to 24 years | 51.7 | 46.2 | -5.5 | *** | 41.7 | 42.9 | 1.2 | |
| 25 to 54 years | 78.0 | 83.1 | 5.0 | *** | 69.4 | 68.1 | -1.3 | ** |
| 55 to 64 years | 62.1 | 68.2 | 6.1 | *** | 54.7 | 55.4 | 0.7 | |
| 65 years and over | 17.8 | 22.9 | 5.1 | *** | 17.3 | 19.5 | 2.2 | *** |
| 16 years and over | 64.6 | 65.7 | 1.1 | *** | 55.0 | 52.5 | -2.5 | *** |
| Persistent Poverty Counties | ||||||||
| 16 to 24 years | 39.7 | 38.3 | -1.4 | *** | 42.1 | 41.8 | -0.3 | |
| 25 to 54 years | 67.5 | 75.7 | 8.2 | *** | 68.5 | 65.0 | -3.4 | *** |
| 55 to 64 years | 48.9 | 56.7 | 7.7 | *** | 49.4 | 50.0 | 0.6 | |
| 65 years and over | 13.6 | 17.3 | 3.7 | *** | 15.2 | 16.7 | 1.5 | *** |
| 16 years and over | 52.7 | 56.6 | 3.8 | *** | 53.3 | 49.0 | -4.3 | *** |
Note: ** = significant at the 95% level, *** = significant at the 99% level
Sources: U.S. Census Bureau, Decennial Census, 2000, and American Community Survey, 5-year Estimates, 2017-2021
Table 9. Employment-to-population rates by age, Women only, 2000 and 2021
| All Counties | Metro | Nonmetro | ||||||
|---|---|---|---|---|---|---|---|---|
| Age Group | 2000 | 2021 | Diff. | Stat. Sign. | 2000 | 2021 | Diff. | Stat. Sign. |
| 16 to 24 years | 53.9 | 52.3 | -1.6 | *** | 52.0 | 52.6 | 0.6 | * |
| 25 to 54 years | 69.9 | 74.3 | 4.4 | *** | 69.7 | 70.7 | 1.0 | *** |
| 55 to 64 years | 49.4 | 59.1 | 9.6 | *** | 45.5 | 54.0 | 8.5 | *** |
| 65 years and over | 9.0 | 14.8 | 5.8 | *** | 8.5 | 13.4 | 4.9 | *** |
| 16 years and over | 54.4 | 56.2 | 1.7 | *** | 50.7 | 50.4 | -0.2 | |
| Majority-Minority Counties | ||||||||
| 16 to 24 years | 47.8 | 46.6 | -1.2 | *** | 38.1 | 40.9 | 2.8 | *** |
| 25 to 54 years | 65.6 | 72.5 | 6.9 | *** | 61.7 | 65.8 | 4.1 | *** |
| 55 to 64 years | 47.4 | 57.4 | 10.0 | *** | 41.0 | 50.7 | 9.8 | *** |
| 65 years and over | 9.1 | 14.8 | 5.7 | *** | 8.5 | 13.5 | 5.0 | *** |
| 16 years and over | 51.7 | 55.4 | 3.7 | *** | 45.2 | 47.3 | 2.2 | *** |
| Persistent Poverty Counties | ||||||||
| 16 to 24 years | 37.1 | 39.4 | 2.3 | *** | 39.2 | 40.7 | 1.6 | * |
| 25 to 54 years | 55.7 | 67.8 | 12.2 | *** | 59.7 | 63.7 | 3.9 | *** |
| 55 to 64 years | 35.4 | 48.8 | 13.5 | *** | 37.6 | 45.6 | 8.1 | *** |
| 65 years and over | 6.6 | 10.8 | 4.1 | *** | 7.4 | 11.9 | 4.5 | *** |
| 16 years and over | 41.7 | 48.9 | 7.3 | *** | 43.3 | 44.7 | 1.4 | ** |
Note: * = significant at the 90% level, ** = significant at the 95% level, *** = significant at the 99% level
Sources: U.S. Census Bureau, Decennial Census, 2000, and American Community Survey, 5-year Estimates, 2017-2021
This disparity was particularly stark for prime working age men in persistently poor nonmetro counties, where the difference between the change they experienced (a decline of 3.4 percentage points) and the change experienced by their peers in metro areas (an increase of 8.2 percentage points) was 11.6 percentage points. Over this period, men in nonmetro persistent poverty counties went from being employed at a slightly greater rate than their peers in metro areas to being employed at a significantly lower rate. The same pattern of change occurred for men aged 55 to 64 years, although the difference was not quite as extreme.
While there were slight disparities in employment rate changes over this period between women living in metro areas and those living in nonmetro areas, they tended to be much less stark than for men. The one exception to this was for prime working age women in persistent poverty counties, where the employment rate gains for women were much larger in metro areas than they were in nonmetro areas.
An analysis of changes in employment-to-population rates by educational attainment is not possible for the same time period as that used above to assess changes by age and sex, as the Census Bureau did not publish county-level employment figures by educational attainment for the 2000 Census. Therefore, the analysis below is limited to the changes that occurred between 2010 and 2021, roughly equivalent to comparing employment rates around the Great Recession to those just prior to the onset of the COVID-19 pandemic.
Table 10 highlights how changes in employment rates by education in metro areas have been more advantageous in recent years than they have been in nonmetro areas. These relatively better changes in employment rates apply across all levels of education. For instance, employment rates for those with less than a high school degree increased 2.5 percentage points in metro areas but did not increase a statistically significant amount in nonmetro areas. Employment rates for those with a high school degree or equivalent declined in both areas, but declined much more in nonmetro areas than they did in metro areas. Employment rates for those with some college or an associate's degree increased slightly in metro areas but declined in nonmetro areas. Metro-nonmetro disparities in employment trends by education are generally similar for majority-minority and persistent poverty communities.
Table 10. Employment-to-population rates by educational attainment, 2010 and 2021
| All Counties | Metro | Nonmetro | ||||||
|---|---|---|---|---|---|---|---|---|
| Educational attainment | 2010 | 2021 | Diff. | Stat. Sign. | 2010 | 2021 | Diff. | Stat. Sign. |
| Less than high school graduate | 54.7 | 57.2 | 2.5 | *** | 46.0 | 46.2 | 0.2 | |
| High school graduate (incl. equivalency) | 68.9 | 68.5 | -0.4 | *** | 66.8 | 64.2 | -2.6 | *** |
| Some college or associate's degree | 75.8 | 76.0 | 0.3 | *** | 73.9 | 73.3 | -0.6 | *** |
| Bachelor's degree or higher | 82.9 | 84.6 | 1.7 | *** | 81.8 | 82.7 | 0.9 | *** |
| Total population 25 to 64 years | 73.6 | 75.5 | 1.9 | *** | 68.7 | 68.9 | 0.2 | |
| Majority-Minority Counties | ||||||||
| Less than high school graduate | 55.5 | 58.5 | 3.0 | *** | 43.5 | 44.9 | 1.4 | ** |
| High school graduate (incl. equivalency) | 67.2 | 67.3 | 0.2 | 60.9 | 58.7 | -2.2 | *** | |
| Some college or associate's degree | 74.6 | 74.7 | 0.2 | * | 70.9 | 69.5 | -1.5 | *** |
| Bachelor's degree or higher | 82.5 | 84.0 | 1.5 | *** | 80.7 | 80.2 | -0.5 | |
| Total population 25 to 64 years | 72.1 | 74.4 | 2.2 | *** | 63.0 | 63.3 | 0.4 | |
| Persistent Poverty Counties | ||||||||
| Less than high school graduate | 44.1 | 47.1 | 2.9 | *** | 37.3 | 36.7 | -0.6 | |
| High school graduate (incl. equivalency) | 60.7 | 59.7 | -1.0 | *** | 58.9 | 55.4 | -3.5 | *** |
| Some college or associate's degree | 70.3 | 69.4 | -0.9 | *** | 68.5 | 67.1 | -1.4 | *** |
| Bachelor's degree or higher | 81.3 | 82.2 | 0.9 | *** | 80.1 | 79.7 | -0.4 | |
| Total population 25 to 64 years | 64.6 | 67.4 | 2.8 | *** | 59.8 | 59.9 | 0.1 | |
Note: * = significant at the 90% level, ** = significant at the 95% level, *** = significant at the 99% level
Sources: U.S. Census Bureau, American Community Survey, 5-year Estimated, 2006-2010, and American Community Survey, 5-year Estimates, 2017-2021
Conclusion
The analyses above explored several changes in the economy in recent decades – including advances in technological innovation and automation, declines in the extraction of certain energy resources, and a shift to the "knowledge-based" economy – alongside disproportionately negative changes in employment rates in many nonmetro communities. The employment rates of prime working age men and those with less than a high school degree in nonmetro areas were the weakest relative to their metro counterparts over this period. While not a causal analysis, the discussion above raises important questions about the possible effects that changes to the U.S. economy might be having on nonmetro employment relative to metro areas.
While these analyses signal a challenge for many nonmetro communities, local leaders in many nonmetro communities are identifying strategies and working with partners to reverse these trends and create resilient economic opportunities aligned with the economy of the future. Some oft-used strategies are upskilling incumbent workers to both increase productivity and create entry-level job opportunities for those with less education and lower skill levels.28 Others include supporting and investing in rural technology-based entrepreneurs, and identifying ways to leverage local assets, such as lumber industry byproducts and chicken waste, in ways that could promote the local development of future industries, like biomass energy production and renewable airline fuels.29 Some communities have sought to reduce employment barriers by addressing things like a lack of childcare availability and access to affordable, high-speed internet.30
Rural communities have many assets that are critical to the future of the U.S. economy, including their human capital. By combining local vision with the right supports and aligned policies, the future of employment in these communities can be brighter than it has been recently.
1. Throughout this article, I primarily use the term "nonmetro" to refer to "rural" communities and use the term "metro" to refer to "urban" communities. Metro areas are defined throughout the analysis as those counties that were classified by the Office of Management and Budget as being in a Metropolitan Statistical Area in 2020. Nonmetro areas are all counties not classified as being in a Metropolitan Statistical Area by the OMB. Return to text
2. For a further discussion of the employment effects of increasing automation, see Daron Acemoglu and Pascual Restrepo, "Robots and Jobs: Evidence from US Labor Markets," Journal of Political Economy 128, no. 6 (2020): 2188-2244. Return to text
3. Philip G. Pardey and Julian M. Alston, "The Drivers of U.S. Agricultural Productivity Growth." Paper presented at the Federal Reserve Bank of Kansas City's 2021 Agricultural Symposium: The Roots of Agricultural Productivity Growth, Webcast, May 2021. Return to text
4. Author tabulations of U.S. Bureau of Economic Analysis data. Return to text
5. See, for example, Tom Hertz, Lorin Kusmin, Alex Marré, and Tim Parker, "Rural Employment Trends in Recession and Recovery," Economic Research Service Report, no. 172 (2014). See also, Katherine J. Curtis, Junho Lee, Heather A. O'Connell, and Jun Zhu, "The Spatial Distribution of Poverty and the Long Reach of the Industrial Makeup of Places: New Evidence on Spatial and Temporal Regimes," Rural Sociology 84, no. 1 (2019): 28-65. Return to text
6. For a further discussion of these historical shifts, see Brian Thiede, Tim Slack, and Jill Ann Harrison, "The Old Versus the New Economies and Their Impacts," in Rural Poverty in the United States, ed. Ann R. Tickamyer, Jennifer Sherman, and Jennifer Warlick (New York: Columbia University Press, 2017), 231-256. Return to text
7. See, for example, Benjamin K. Couillard and Christopher L. Foote, "Recent Employment Growth in Cities, Suburbs, and Rural Communities," Working Papers, no. 19-20 (2019). Return to text
8. Couillard and Foote, "Recent Employment Growth in Cities, Suburbs, and Rural Communities." Return to text
9. See, for example, Curtis, Lee, O'Connell, and Zhu, "The Spatial Distribution of Poverty and the Long Reach of the Industrial Makeup of Places." See also, Couillard and Foote, "Recent Employment Growth in Cities, Suburbs, and Rural Communities." Return to text
10. See, for example, Kerwin Kofi Charles, Erik Hurst, and Mariel Schwartz, "The Transformation of Manufacturing and the Decline in U.S. Employment," in NBER Macroeconomics Annual 2018, ed. Martin Eichenbaum and Jonathan Parker, vol. 33 (Chicago: University of Chicago Press, 2018), 307-372. See also, Curtis, Lee, O'Connell, and Zhu, "The Spatial Distribution of Poverty and the Long Reach of the Industrial Makeup of Places." See also, Couillard and Foote, "Recent Employment Growth in Cities, Suburbs, and Rural Communities." Return to text
11. For a further discussion of increases in oil and gas drilling productivity, see Jason P. Brown, David Rodziewicz, and Colton Tousey, "Drilling Productivity in the United States: What Lies Beneath," Economic Bulletin (May 2019). Return to text
12. U.S. Energy Information Administration, "U.S. Coal Production Employment has Fallen 42% since 2011," Today in Energy (December 2019), https://www.eia.gov/todayinenergy/detail.php?id=42275. Return to text
13. The ten states are Texas, Oklahoma, Louisiana, Colorado, Pennsylvania, California, Kansas, New Mexico, West Virginia, and Wyoming. Author tabulations of U.S. Bureau of Economic Analysis data. Return to text
14. "High-skilled work" is used here as defined in David H. Autor, "Work of the Past, Work of the Future," AEA Papers and Proceedings 109 (2019): 1-32. It is based on, among other things, the amount of time an occupation typically spends on more abstract tasks such as managing others, problem solving, using math that is at a high school level or above, and reading, relative to tasks that are of a more repetitive, routine nature. Return to text
15. For a further discussion of the intersection of human capital and urbanization in high-tech employment growth, see Belal Fallah, Mark D. Partridge, and Dan S. Rickman, "Geography and High-Tech Employment Growth in U.S. Counties," Journal of Economic Geography 14 (2014): 683-720. For a discussion of the benefits of locating in an urban area for high-skill workers, see Martin Andersson, Johan Klaesson, and Johan P. Larsson, "The Sources of the Urban Wage Premium by Worker Skills: Spatial Sorting or Agglomeration Economies?" Papers in Regional Science 93, no. 4 (2014): 727-747. Return to text
16. See, for example, Nicholas Hillman, Jared Colston, Joshua Bach-Hanson, and Audrey Peek, "Mapping Rural Colleges and their Communities," (working paper, University of Wisconsin-Madison, 2021). Return to text
17. For a discussion of education-based rural-urban migration, see Xiao Li, "Migration Behaviors and Educational Attainment of Metro and Non-Metro Youth," Rural Sociology 87, no. 4 (2022): 1302-1339. Return to text
18. For a discussion of the effects of rurality on the odds of attending an institution of higher education, and differences in the types of institutions attended by rural vs urban students, see Andrew Koricich, Xi Chen, and Rodney P. Hughes, "Understanding the Effects of Rurality and Socioeconomic Status on College Attendance and Institutional Choice in the United States," The Review of Higher Education 41, no. 2 (2018): 281-305. Return to text
19. For a discussion of the urban wage premium and its drivers, see Francisco Rowe, Jonathan Corcoran, and Martin Bell, "The Returns to Migration and Human Capital Accumulation Pathways: Non-metropolitan Youth in the School-to-Work Transition," The Annals of Regional Science 59 (2017): 819-845. See also, John V. Winters, "Do Earnings by College Major Affect Graduate Migration?" The Annals of Regional Science 59 (2017): 629-649. See also, Alessia Matano and Paolo Naticchioni, "What Drives the Urban Wage Premium? Evidence Along the Wage Distribution," Journal of Regional Science 56, no. 2 (2016): 191-209. Return to text
20. For a further discussion of the impacts of industry mix on disparities in the metro-nonmetro employment growth rate, see Mark D. Partridge, Rodrigo Pérez-Silva, and Sydney Schreiner, "Employment and Wages in the Places Left Behind," in Rural Families and Communities in the United States: Facing Challenges and Leveraging Opportunities, ed. Susan M. McHale, Valarie King, and Jennifer E. Glick (Cham, Switzerland: Springer Nature, 2020), 47-85. For a brief discussion of the impacts of industry mix on overall economic growth, see Charles S. Gascon and Brian Reinbold, "Industry Mix May Help Explain Urban-Rural Divide in Economic Growth," Regional Economist (June 2019). Return to text
21. For a discussion of the effect of age, education, industrial structure, and population growth on unemployment rates during the Great Recession and employment growth thereafter across rural America, see Hertz, Kusmin, Marré, and Parker, "Rural Employment Trends in Recession and Recovery." Return to text
22. For a discussion of recent metro-nonmetro trends in underemployment, see Thiede, Slack, and Harrison, "The Old Versus the New Economies and Their Impacts." For a discussion of recent metro-nonmetro trends in income, see Partridge, Pérez-Silva, and Schreiner, "Employment and Wages in the Places Left Behind." For a discussion of changes in the nature of work and employee-employer relations, see Marybeth J. Mattingly, "Changes in Work and Family Across the Rural U.S.," in Rural Families and Communities in the United States: Facing Challenges and Leveraging Opportunities, ed. Susan M. McHale, Valarie King, and Jennifer E. Glick (Cham, Switzerland: Springer Nature, 2020), 27-45. Return to text
23. For ease of reading, throughout the text I refer to the Census Bureau's ACS 5-year estimates by the last year in the series. Readers should be cognizant that such figures do not represent estimated figures for that individual year, but an estimate of the figure across the five-year period. The 2021 figures include 2017-2021 and so may best be interpreted as the employment rate just prior to and during the COVID-19 pandemic, while the figures for 2010 include 2006-2010, and so may best be interpreted as the employment rate just before and during the Great Recession. Return to text
24. For a further discussion of gender disparities in rural employment, see Kristin Smith, "Changing Gender Roles and Rural Poverty," in Rural Poverty in the United States, ed. Ann R. Tickamyer, Jennifer Sherman, and Jennifer Warlick (New York: Columbia University Press, 2017), 117-140. See also, Marybeth Mattingly, Kristin Smith, and Jessica A. Bean, "Unemployment in the Great Recession: Single Parents and Men Hit Hard," Carsey Institute Issue Brief No. 35 (2011). For a discussion of the differential effects of automation on men and low-income communities, see Thor Berger and Per Engzell, "Industrial Automation and Intergenerational Income Mobility in the United States," Social Science Research 104 (2022). Return to text
25. For a more complete exploration of the factors impacting changes in the employment-to-population rate, including among prime working-age men, see Ariel J. Binder and John Bound, "The Declining Labor Market Prospects of Less-Educated Men," Journal of Economic Perspectives 33, no. 2 (2019): 163-190. See also, Katharine G. Abraham and Melissa S. Kearney, "Explaining the Decline in the US Employment-to-Population Ratio: A Review of the Evidence," Journal of Economic Literature 58, no. 3 (2020): 585-643. Return to text
26. Author tabulations of U.S. Bureau of Economic Analysis data and U.S. Census Bureau, American Community Survey data, 2017-2021. Return to text
27. For a further discussion of recent trends in employment-to-population rates by educational attainment in nonmetro areas, see Partridge, Pérez-Silva, and Schreiner, "Employment and Wages in the Places Left Behind." Return to text
28. See John Molinaro, "A Model for Rural Workforce Development that Works," in Investing in Rural Prosperity, ed. Andrew Dumont and Daniel Paul Davis (St. Louis: Federal Reserve Bank of St. Louis, 2021), 251-264. Return to text
29. See Matt Dunne, "Small-Town Tech Towns: Where Scalable Entrepreneurship Is Propelling Rural Growth," in Investing in Rural Prosperity, ed. Andrew Dumont and Daniel Paul Davis (St. Louis: Federal Reserve Bank of St. Louis, 2021), 317-332. See also, Nathan Ohle and Joseph Kapp, "Building Locally Rooted Wealth: Achieving Results by Leveraging Community Assets, Leadership Development and Collaboration," in Investing in Rural Prosperity, ed. Andrew Dumont and Daniel Paul Davis (St. Louis: Federal Reserve Bank of St. Louis, 2021), 383-396. Return to text
30. For an example of a community effort to address childcare access, see Erika Bell and Sierra Latham, "Rural Spotlight: A Technical College and Child Care Center Unite in Cheraw, South Carolina," Rural Spotlights (August 2023). For an example of efforts to address access to affordable high-speed internet, see Jeremy Hegle, "Bringing Broadband to Rural America: The Role for Philanthropy," in Investing in Rural Prosperity, ed. Andrew Dumont and Daniel Paul Davis (St. Louis: Federal Reserve Bank of St. Louis, 2021), 223-235. Return to text
Dumont, Andrew (2023). "Changes in the U.S. Economy and Rural-Urban Employment Disparities," FEDS Notes. Washington: Board of Governors of the Federal Reserve System, January 19, 2024, https://doi.org/10.17016/2380-7172.3428.
Disclaimer: FEDS Notes are articles in which Board staff offer their own views and present analysis on a range of topics in economics and finance. These articles are shorter and less technically oriented than FEDS Working Papers and IFDP papers.