FEDS Notes
May 16, 2025
Chinese Banks' Dollar Lending Decline1
Laurie DeMarco and Joshua Walker
1. Introduction
The dominant international role of the U.S. dollar has received renewed attention in recent years, but across many measures, the dollar's dominance in international finance has changed little.2 However, there has been a notable change in one statistic. Dollar-denominated cross-border bank lending to emerging market economies (EMEs) declined almost 10 percent between the start of 2022 and early 2024.3 According to our analysis using both public and restricted BIS banking statistics, this is largely because of a shift in the currency composition of lending abroad by Chinese banks. With both economic and geopolitical considerations supportive of the trend, Chinese banks have notably reduced their dollar lending to other emerging market economies (EMEs), increasing lending in renminbi (RMB).
We find that this recent decline in dollar-denominated lending by Chinese banks is outsized compared to that by other banks. Although Chinese bank incentives are opaque, we suggest two potential and complementary reasons for this difference: (1) Increasing U.S. and euro-area interest rates, which substantially raised funding costs in the two currencies most commonly used in cross-border lending (dollar and euro) and left Chinese banks in the unusual position of having one of the lowest-cost home currencies among major international banks and (2) a reported intensification, in the wake of the West's 2022 sanctions on Russia, of China's longstanding desire to de-dollarize international transactions.
2. Sustained dollar lending declines, concentrated in Asia, can be attributed to Chinese banks
The sustained decline in dollar lending to EMEs since the start of 2022 can be distinguished from brief declines in broader measures such as total lending to EMEs in all currencies and total global cross-border lending denominated in dollars (Figure 1).4 Both of those broader declines were brief, widespread, and likely attributable to global macro and financial factors. In contrast, the decline in dollar lending to EMEs continued into 2024, is concentrated in emerging Asia, and can be attributed substantially to a change in the currency composition of Chinese bank lending abroad, as we will show below. Although the lending of Chinese banks to EMEs cannot be directly identified in public data, a shift in Chinese bank lending from dollars to RMB lines up with a similar shift in the currency of lending to EMEs in emerging Asia, where Chinese banks are important lenders.
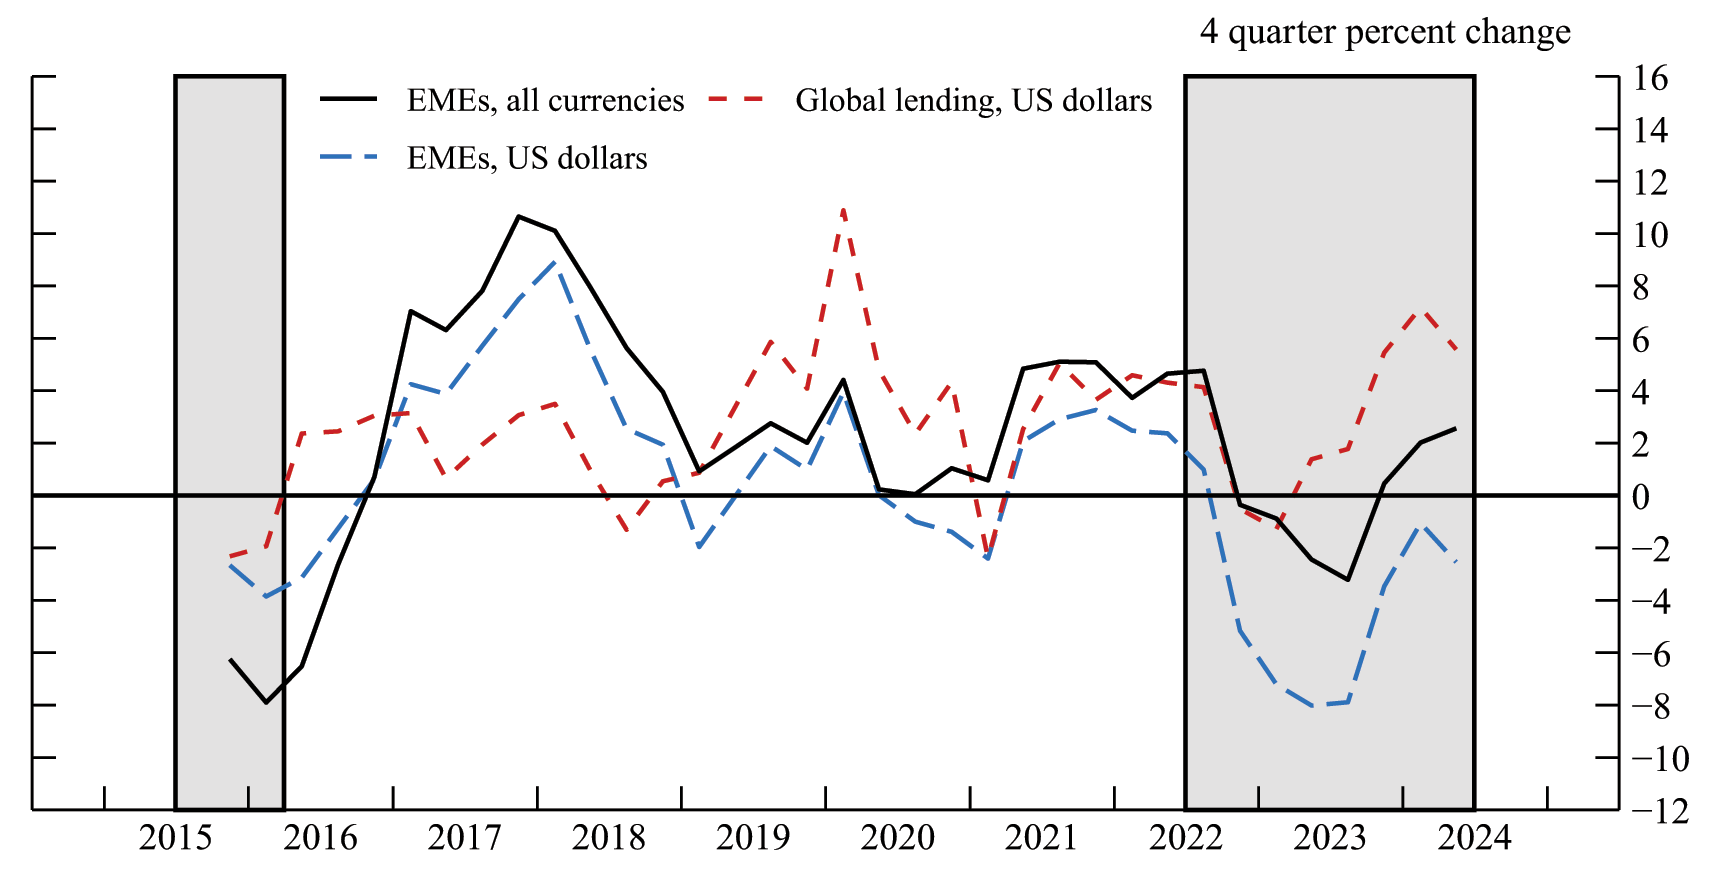
Notes: The 2015:Q3−2016:Q1 shaded area marks the China scare and the 2022:Q2−2024:Q2 shaded area marks the current episode. Changes in positions are adjusted for exchange rate changes and series breaks using BIS−provided adjusted flows. China and Russia entered the BIS reporting population in 2015:Q4.
Source: BIS locational banking statistics.
Global factors drove brief widespread lending declines
Many factors likely contributed to an initial drop in total cross-border bank lending to EMEs (in all currencies) in 2022 and early 2023 (black line in Figure 1), which was widespread across regions except Latin America (not shown). As the IMF noted in 2022, Russia's war in Ukraine, a slowdown in China, and tighter financial conditions all weighed on the global growth outlook that year.5 Higher interest rates increased borrowing costs and led to concerns over potential EME vulnerabilities related to such factors as currency depreciation and higher foreign currency-denominated debt burdens. However, growth in overall lending to EMEs turned positive again by late 2023 as EMEs weathered the rate hikes without a major crisis.
Similarly, global cross-border lending denominated in dollars (the red line) fell only very briefly in late 2022 to early 2023 as dollar funding costs rose with U.S. interest rates. The steep rise in U.S. interest rates and the accompanying appreciation of the dollar likely decreased the profitability of lending in dollars by raising dollar funding costs.6 During this period, U.S. rates initially rose faster than rates in most other major currencies, thus discouraging lending denominated in dollars. However, as interest rates also rose for other major currencies and the value of the dollar retreated in 2023, global dollar-denominated bank lending stabilized or rebounded in most regions except emerging Asia.
In emerging Asia, declines in dollar-denominated lending were sustained
Even as global dollar lending and total lending to EMEs started to recover, dollar-denominated lending to EMEs continued to decline at an even faster annual rate over the subsequent 5 quarters (the blue line). This sustained decline was concentrated in emerging Asia, which accounted for almost all of the cumulative decline in cross-border dollar lending to EMEs since 2023Q1 (Figure 2).7
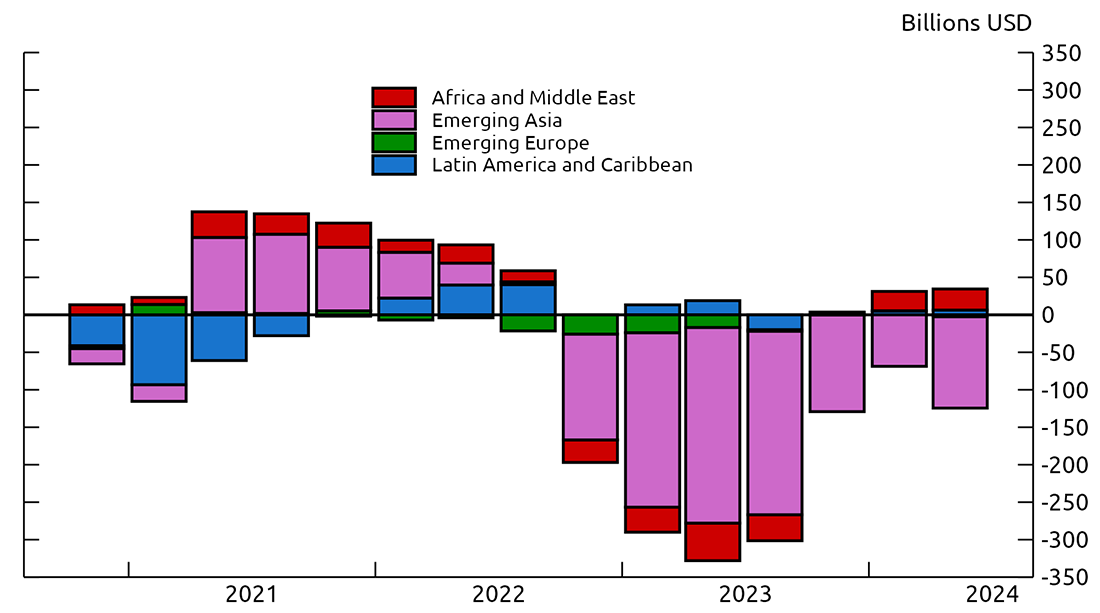
Last date: 2024:Q2.
Notes: Bars show 4 quarter level changes. Changes in positions are adjusted for exchange rate changes and series breaks using BIS−provided adjusted flows. For positive values, the key identifies bars in order from top to bottom, and for negative values, the key identifies bars in order from bottom to top.
Source: BIS locational banking statistics.
Cross-border lending in dollars to emerging Asia fell a total of 16 percent from the start of 2022 through 2024Q2, more than during the "China scare" of 2015-2016, a period that similarly featured concerns about slow Chinese growth and strong dollar appreciation.8 However, the currency composition of the two declines is quite different. As can be seen in Figure 3, during the "China scare", lending declines to emerging Asia occurred across major and non-major currencies, roughly proportional to their share of lending at the time. In contrast, over the period starting in 2022, the decline in dollar-denominated lending in emerging Asia was largely offset by a rise in lending denominated in "non-major" currencies, where "non-major" currencies are any other than dollar, euro, Japanese yen, British pound and the Swiss franc.9 In other words, dollar lending accounts for nearly all of the recent decline in foreign bank lending to emerging Asia. As a result, the dollar share of cross-border bank lending to emerging Asia has fallen faster than in other EM regions in recent years (Figure 4).
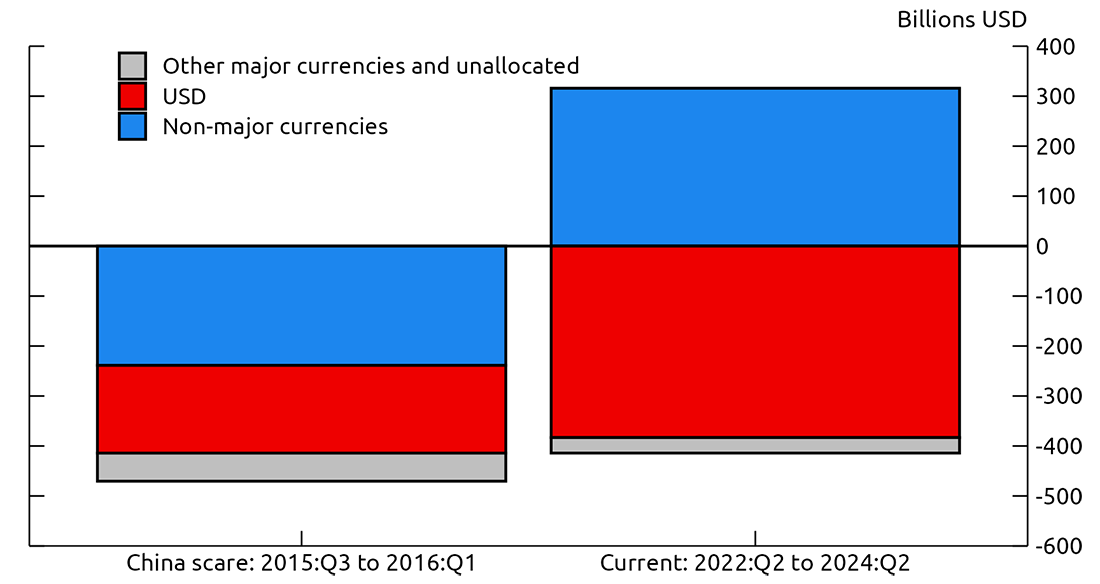
Notes: Non−major currencies include all currencies other than USD, EUR, JPY, GBP, and CHF. Other major currencies and unallocated include major currencies other than USD (EUR, JPY, GBP, and CHF) and positions unallocated by currency. Changes in positions are adjusted for exchange rate changes and series breaks using BIS−provided adjusted flows. China and Russia entered the BIS reporting population in 2015:Q4. The key identifies bars in order from bottom to top.
Source: BIS locational banking statistics.

Notes: The 2015:Q3−2016:Q1 shaded area marks the China scare and the 2022:Q2−2024:Q2 shaded area marks the current episode. Levels are constructed starting with the most recent level and cumulating adjusted flows backwards, using BIS−provided flows adjusted for exchange rate changes and series breaks. China and Russia entered the BIS reporting population in 2015:Q4.
Source: BIS locational banking statistics.
Chinese banks, important lenders in emerging Asia, shifted rapidly out of dollar lending
The faster drop in the dollar share of lending to emerging Asia relative to other EM regions is likely due to the role of Chinese banks. Without directly observing Chinese banks' dollar-denominated lending to EMEs or emerging Asia, we reach this conclusion based on two steps. First, we establish the importance of Chinese banks' lending in overall bank lending to emerging Asia. We then show that the shift in the currency denomination of Chinese banks' global cross-border lending tracks very closely the shift in the currency of total cross-border lending to emerging Asia described above.
Chinese banks are important lenders to emerging Asia and emerging Asia also appears to account for a large share of Chinese bank lending abroad. The role of Chinese banks in lending to EMEs, and particularly to other countries in emerging Asia, has increased in recent years.10 Data on the exact size of Chinese banks' lending to specific countries are not publicly available. However, a recent article that draws on confidential BIS data shows the rapid growth in Chinese bank market share in lending to EMEs, reaching about 26 percent of cross-border lending to all EMEs and about 35 percent of cross-border lending to emerging Asia (outside China) as of 2021.11 Calculations using these shares and publicly-available total lending quantities by region also suggest that lending to emerging Asia accounts for the bulk of Chinese bank lending to EMEs (very roughly 80-90 percent).12 Although this measure includes potentially sizeable Chinese bank lending to related jurisdictions (such as Hong Kong), Chinese banks presumably also lend substantial amounts to other countries in Asia.13 Our analysis in the final section below uses restricted data to remove lending to Hong Kong and Macao and thus focus primarily on lending to unrelated EMEs.
The currency denomination of cross-border lending by Chinese banks globally shifted suddenly away from dollars to RMB starting in 2022, parallel to the developments in emerging Asia discussed above. Prior to 2022, Chinese banks generally increased their dollar-denominated cross-border lending at only a slightly slower pace than their lending in all currencies (Figure 5). After 2022 Q1, however, although Chinese banks' lending in all currencies was little changed, their dollar denominated lending fell notably, largely offset by a rise in lending denominated in "non-major" currencies. As a result, the dollar share of Chinese banks' cross-border lending fell rapidly and steadily (Figure 6).14 Most of this currency shift by Chinese banks appears to be into RMB lending (Figure 7), reflected in the share of RMB in Chinese overseas lending more than doubling, to nearly 40 percent, since 2021.15
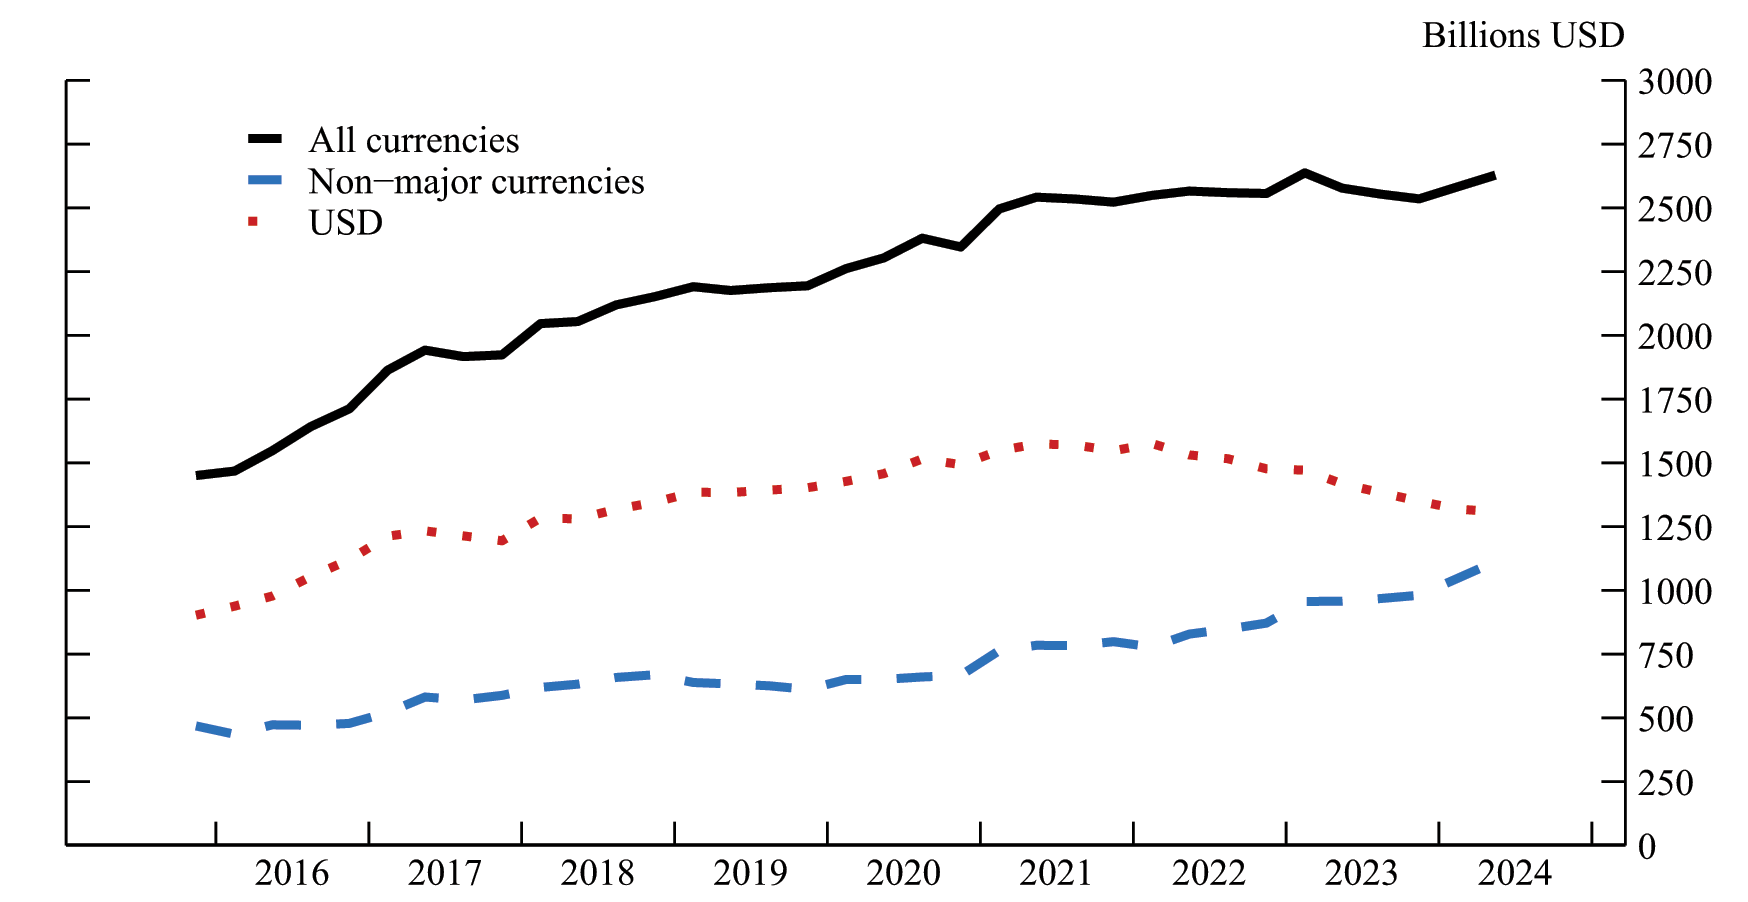
Notes: Levels are constructed starting with the most recent level and cumulating adjusted flows backwards, using BIS−provided flows adjusted for exchange rate changes and series breaks. China and Russia entered the BIS reporting population in 2015:Q4.
Source: BIS locational banking statistics.
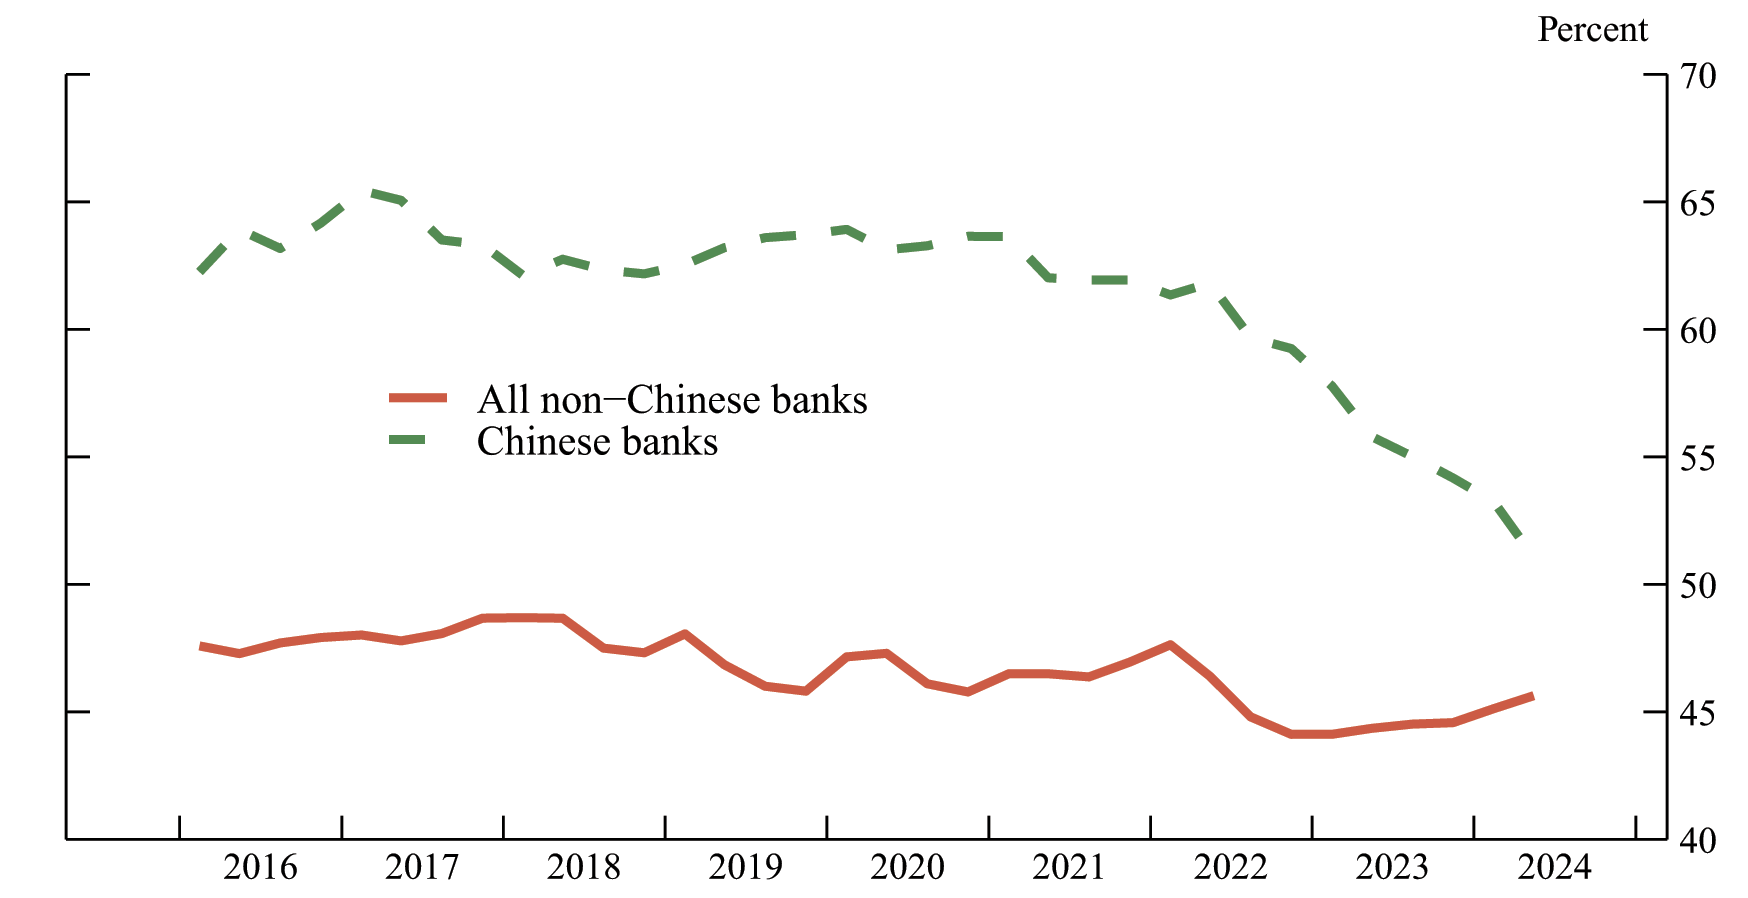
Notes: The dollar share of non−Chinese banks’ cross−border lending is depressed by the large amount of intra−euro area lending denominated in Euro by euro area banks. Levels are constructed starting with the most recent level and cumulating adjusted flows backwards, using BIS−provided flows adjusted for exchange rate changes and series breaks.
Source: BIS locational banking statistics.

Source: People’s Bank of China, Haver Analytics.
The simultaneous shift of Chinese banks' global cross-border lending away from dollars into RMB and the similar sustained shift from dollars to "other" currency lending in emerging Asia, where Chinese banks are important lenders, strongly suggests Chinese banks are primarily responsible for the latter.16 Although the dollar share of the stock of Chinese bank cross-border lending remains substantial, the rapid decline in that share suggests that much of their new lending is in RMB, not dollars. This constitutes a rapid de-facto de-dollarization of new Chinese bank cross-border lending in the region.
3. Chinese banks' dollar lending decline is unique, as economic and geopolitical considerations coincide
The decline in the dollar share of cross-border lending by Chinese banks is notably steeper and more persistent than for other banks and thus cannot be easily explained by many typical lending supply and demand factors that would apply equally to other banks. We suggest instead that two coinciding factors may have led to a de-facto de-dollarization of new EME lending by Chinese banks: (1) increasing U.S. and euro area interest rates left Chinese banks uniquely positioned with one of the lowest cost home currencies among major international banks and (2) a reported intensification, in the wake of the West's 2022 sanctions on Russia, of China's longstanding desire to de-dollarize international transactions.
Chinese banks' dollar lending decline is outsized compared to other banks and history
First, given that interest rate hikes, and thus higher funding costs, incentivized all banks to move away from dollar lending briefly, we use a simple regression to formally test the observation that the decline in Chinese banks' dollar share of lending appears steeper than that of other banks. We use granular restricted BIS data on bank lending by currency, by nationality of lending bank, and by borrower country within emerging Asia from 2015Q4 to 2024Q2. Our regression specification uses fixed effects to control widely for any unobserved lending supply or lending demand factor that applies in common across pairs of bank nationality, borrower country, or currency in each period.17 To isolate the lending in question, we estimate the coefficient for the three-way interaction of a Chinese bank dummy, a dollar denomination dummy, and a dummy for the period starting in 2022Q1 (see the Appendix for more details and robustness checks).
As shown in Table 1, the significant negative interaction term suggests that the recent changes in dollar lending of Chinese banks are significantly different than each of the following: recent Chinese bank lending in all currencies, other banks' recent lending denominated in dollars, and Chinese bank lending in dollars earlier in the sample. This rules out explanations such as effects of interest rates on banks' dollar funding costs that are common across all banks, or demand effects such as a preference shift away from dollars by borrowers in countries that Chinese banks lend more to (across all banks that lend to those borrowing countries).18
Table 1. Bank lending to EMEs by currency
|
Dependent variable: |
Lending by currency as share of total lending to a country by a bank nationality
EMEs ex. mainland China, Hong Kong, and Macao |
|---|---|
| Interaction: Chinese bank lender x USD denomination | 0.008* |
| (0.003) | |
| Interaction: Chinese bank lender x USD denomination x Post-2021 period | -0.018** |
| (0.006) | |
| Lagged dependent variable | 0.978** |
| (0.002) | |
| Fixed effects | Currency x Time Bank Nationality x Time Borrower Country x Time |
| N | 18,204 |
** p<.01, * p<.05.
Note: Sample from 2015:Q4-2024:Q2; excludes lending to mainland China, Hong Kong, and Macao; more sample details in appendix table. Bilateral lending is lending by bank nationality and borrower country pair. Bank lending includes all cross-border and local claims except claims on the home country of the parent bank and cross-border claims on related offices. Levels are calculated starting with the most recent value and cumulating BIS-provided adjusted flows backwards in time, where flows are adjusted for exchange rate changes and series breaks. Results are subject to the caveat that a significant share of confidential data is not available because reporting countries do not allow sharing confidential data outside the BIS.
Changes in interest rates of major currencies leaves Chinese banks with lower-cost home currency
The exercise above does not account for some unique circumstances of the recent period, which may help explain Chinese banks' shift from dollar to RMB, specifically, the combination of: the rise of Chinese banks as international lenders to EMEs; the significantly higher funding costs for both major international lending currencies, dollar and euro, that left the RMB relatively cheap; and the relatively limited accessibility of RMB funding to non-Chinese banks.
Cross-border lending to EMEs is primarily done by large international banks from a handful of jurisdictions, mainly euro area, U.K., U.S., Switzerland, and Japan. As noted above, Chinese banks have entered these ranks over the past decade. In addition, lending to EMEs is mostly denominated in a small number of major currencies, predominantly dollars, but also euro, both of which are accessible to international banks through established funding and FX markets that cross borders and bank nationalities. Chinese bank lending to EMEs initially followed this pattern, with Belt and Road initiative lending denominated primarily in dollars. We assume that Chinese banks face a similar cost of funding dollars as other non-U.S. international banks, at least on the margin.19
With this backdrop, when U.S. interest rates first rose in early 2022, the higher funding costs incentivized banks to substitute away from dollars, but for lending to EMEs, there are few alternate currencies that have proven desirable to both banks and borrowers. Once interest rates also rose for the euro, pound, and Swiss franc, both the dollar and the home currencies of most international lending banks were similarly expensive. The largest exception was Chinese banks, as the RMB interest rate became cheaper than rates for the dollar and other major currencies (Figure 8), an unusual occurrence.20
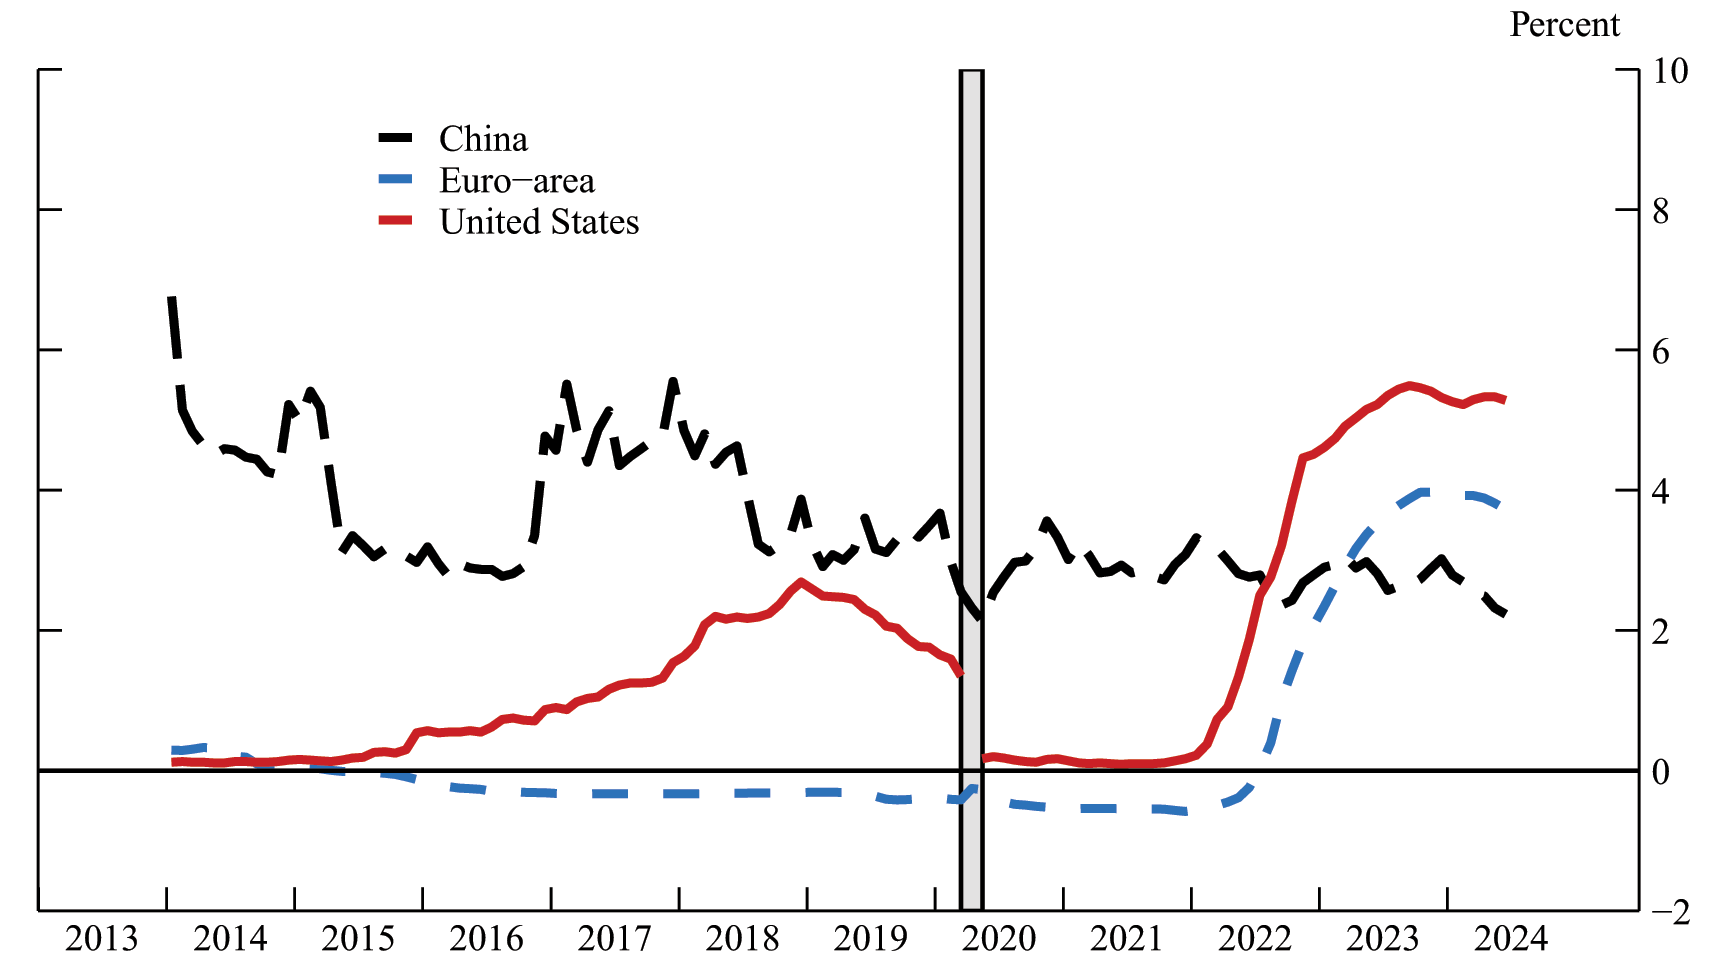
Note: The U.S., Euro−area, and China interbank rates are LIBOR/SOFR, Euribor, and Shibor, respectively. The April 2020 shaded area marks a series break in data for the U.S. interbank rate during a shift from LIBOR to SOFR.
Source: OECD, FRED.
Loans in cheaper funding currencies support profitability margins for banks while allowing banks to potentially offer lower rates to borrowers. Although we do not have data on loan terms, with substantial lending relationships with EME borrowers already in place, Chinese banks were uniquely positioned to offer more favorable rates through RMB lending when dollar rates rose. Furthermore, some borrowing EMEs have experienced financial strain in recent years. At least one study has highlighted China's rescue lending to countries in debt distress, primarily Belt and Road Initiative borrowers; under such circumstances, a switch to RMB could be part of the terms of renegotiated debt.21
Why would other international banks not also shift into lower-cost RMB lending, as they might shift between dollars and euro? Funding in RMB may not be as accessible and substitutable for other banks as it is for Chinese banks for a variety of reasons. Currency controls or simply a lack of established funding markets, funding relationships, or hedging options in RMB could restrain funding for non-Chinese banks. Inexperience with risk management around lending in RMB could also make non-Chinese banks hesitant or slow to shift.
Economic considerations coincide with geopolitical goals
In addition to the other developments in 2022, the timing of the change in trend for Chinese banks' dollar lending coincided with the West's financial sanctions on Russia and growing US-China tensions (over Taiwan and China's tacit support for Russia). China's interest in establishing alternatives to dollar-based financial institutions and networks over the last decade is well known, but, by most measures, changes in the dollar's international role have been quite gradual.22 However, the 2022 financial sanctions on Russia may have intensified China's efforts to insulate itself from exposure to the dollar-dominated financial system.23 The coincident rise of the cost of funding and lending in most major currencies may have helped this goal, providing a catalyst to lending in RMB as an alternative.
References
Aldasoro, Inaki, E. Eren, and W. Huang (2021). "Dollar funding of non-US banks through Covid-19," BIS Quarterly Review.
Ali, Ghulam (2024). "Chinese yuan gains currency in the Gulf states," East Asia Forum.
Bank for International Settlements (2024). "Statistical release: BIS international banking statistics and global liquidity indicators at end-June 2024", October 31, 2024.
Bertaut, Carol, B. von Beschwitz, and S. Curcuru (2023). "The International Role of the U.S. Dollar: Post-COVID Edition," FEDS Notes.
Bertaut, Carol, B. von Beschwitz, and S. Curcuru (2021). "The International Role of the U.S. Dollar," FEDS Notes.
Cerutti, Eugenio, C. Casanova, and S.K. Pradhan (2024). "Chinese banks and their EMDE borrowers: have their relationships changed in times of geoeconomic fragmentation?" BIS Working Paper #1213.
Cerutti, Eugenio, C. Casanova, and S.K. Pradhan (2023). "Banking across borders: Are Chinese banks different?" Journal of Banking and Finance.
Cerutti, Eugenio, C. Casanova, and S.K. Pradhan (2021). "The global footprint of Chinese banks," November 24, 2021, VoxEU, Center for Economic Policy and Research.
Chortane, Sana and D. Pandey (2022). "Does the Russia-Ukraine war lead to currency asymmetries? A US dollar tale," The Journal of Economic Asymmetries.
Dawson, Jeff (2022). "A Closer Look at Chinese Overseas Lending," Liberty Street Economics, Federal Reserve Bank of New York.
De Mott, Filip (2023). "China-based BRICS bank aims to de-dollarize debt by expanding local currency lending," Business Insider. https://markets.businessinsider.com/news/bonds/china-brics-bank-dedollarization-dollar-dominance-debt-local-currency-lending-2023-8.
Greene, Robert (2024). "China's Dollar Dilemma," Carnegie Endowment for International Peace.
Habib, Maurizio and A. Mehl (2022). "The Russian invasion of Ukraine and international currencies," European Central Bank.
Horn, Sebastian, C.M. Reinhart, and C. Trebesch (2021). "China's overseas lending," Journal of International Economics.
Horn, S., B.C. Parks, C.M. Reinhart, C. Trebesch (2023). "China as an International Lender of Last Resort," Kiel Working Papers 2244, Kiel Institute for World Economy, March 2023.
Khwaja, Asim Ijaz and A. Mian. 2008. "Tracing the Impact of Bank Liquidity Shocks: Evidence from an Emerging Market." American Economic Review, 98 (4): 1413–42.
Kodres, Laura E., L.S. Shen, and D. Duffie. (2022). "Dollar Funding Stresses in China," Federal Reserve Bank of Boston Working Paper, SRA 22-03.
Liu, Zongyuan Zoe and M. Greenberg (2022). "China is quietly trying to dethrone the dollar," Foreign Policy. https://foreignpolicy.com/2022/09/21/china-yuan-us-dollar-sco-currency/
McGuire, Patrick, M. Santos, G. von Peter, and S. Zhu (2024). "The currency dimension in international financial statistics," BIS Quarterly Review.
Organization for Economic Co-operation and Development, Interest Rates: 3-Month or 90-Day Rates and Yields: Interbank Rates: Total for China [IR3TIB01CNM156N], retrieved from FRED, Federal Reserve Bank of St. Louis; March 10, 2025.
Organization for Economic Co-operation and Development, Interest Rates: 3-Month or 90-Day Rates and Yields: Interbank Rates: Total for Euro Area (19 Countries) [IR3TIB01EZM156N], retrieved from FRED, Federal Reserve Bank of St. Louis; March 10, 2025.
Organization for Economic Co-operation and Development, Interest Rates: 3-Month or 90-Day Rates and Yields: Interbank Rates: Total for United States [IR3TIB01USM156N], retrieved from FRED, Federal Reserve Bank of St. Louis; March 10, 2025.
World Economic Outlook (2022), IMF.
Appendix: Fixed effects regression specification
To test the relative size of Chinese banks' dollar lending decline, we use restricted BIS data on bank lending by currency, by nationality of lending bank, and by borrower country within EMEs from 2015Q4 to 2024Q2. Inspired by a Khwaja-Mian specification that uses fixed effects to control for unobserved factors, we include currency-time fixed effects, nationality of lender-time fixed effects, and borrower country-time fixed effects. The dependent variable is lending by currency as a share of total lending to that country by that bank nationality, although the results are robust to the dependent variable being the change in level of lending by bank nationality-borrower-currency.
The currency-time fixed effects control for any changes in dollar-specific (or any currency-specific) lending conditions that are common across all lending nationality-borrowing country pairs in each quarter (such as cost of funding). The nationality of lender-time fixed effects similarly controls for any changes in lending that are specific to a lending bank nationality but common across that nationality's borrowing relationships and across all currencies (such a bank lending supply), for each quarter. The borrower country-time fixed effects controls for any changes in lending to a specific borrowing country but in common across that country's lending banks and across all currencies (such as loan demand), for each quarter.
To isolate the lending in question, we estimate the coefficient for the three-way interaction of a Chinese bank dummy, a dollar denomination dummy, and a dummy for the period starting in 2022Q1. Each of these dummies separately are absorbed by the fixed effects, but the combination is not. The coefficient on this interaction indicates whether the dollar denominated share of lending during this period for Chinese banks is significantly different than all of: Chinese bank lending in other currencies for those quarters, other banks' lending shares denominated in dollars for those quarters, and Chinese bank lending share in dollars earlier in the sample. Our results show that the interaction has a significant negative coefficient. The appendix table shows robustness tests compared our main specification from the text. The main specification includes large EME borrower countries or jurisdictions except mainland China, Hong Kong, and Macao – to exclude any effects of changes in RMB lending to mainland China and its largest related jurisdictions – although the interaction coefficient has similar size and significance if we were to include these borrowers (-0.016, not shown). Column 2 shows that the Chinese bank interaction coefficient is stronger with only emerging Asian borrowing countries.
Appendix Table 1. Bank lending to EMEs by currency
| Dependent variable: | Lending by currency as share of total lending to a country by a bank nationality | |||
|---|---|---|---|---|
| Borrowing countries or jurisdictions included: |
(1) Main. EMEs ex. mainland China, Hong Kong, and Macao |
(2) Emerging Asia ex. mainland China, Hong Kong, and Macao |
(3) EMEs ex. mainland China, Hong Kong, and Macao |
(4) |
| Interaction: Chinese bank lender x USD denomination | 0.008* | 0.019** | 0.009* | |
| (0.003) | (0.005) | (0.004) | ||
| Interaction: Chinese bank lender x USD denomination x Post-2021 period | -0.018** | -0.027** | -0.014** | |
| (0.006) | (0.010) | (0.007) | ||
| Lagged dependent variable | 0.978** | 0.961** | 0.976** | 0.970** |
| (0.002) | (0.003) | (0.002) | (0.001) | |
| Currency value (broad nominal index) | -0.009 | |||
| (0.011) | ||||
| Interaction: Japanese bank lender x. USD denomination | -0.001 | |||
| (0.003) | ||||
| Interaction: Japanese bank lender x. USD denomination x Post-2021 period | -0.008 | |||
| (0.006) | ||||
| Fixed effects | Currency x Time Bank Nationality x Time Borrower Country x Time |
Currency x Time Bank Nationality x Time Borrower Country x Time |
Currency Bank Nationality x Time Borrower Country x Time |
Currency x Time Bank Nationality x Time Borrower Country x Time |
| N | 18,204 | 8,519 | 11,684 | 22,515 |
** p<.01, * p<.05.
Notes: Bank lending includes all cross-border and local claims except claims on the home country of the parent bank and cross-border claims on related offices. Levels are calculated starting with the most recent value and cumulating BIS-provided adjusted flows backwards in time, where flows are adjusted for exchange rate changes and series breaks. Sample from 2015:Q4-2024:Q2, includes the 21 parent bank nationalities in the BIS locational banking statistics with the largest claims on EMEs and the following emerging market borrowing countries or jurisdictions with the largest borrowing from foreign banks: 27 EMEs in column 4; 24 EMEs excluding mainland China, Hong Kong, and Macao in columns 1 and 3; 8 emerging Asian countries or jurisdictions in column 2. Currencies include USD, EUR, JPY, GBP, and "other" (non-major) currencies. Column 3 is restricted to claims denominated in USD, JPY, and EUR to match the currency value to the denomination. Results are subject to the caveat that a significant share of confidential data is not available because reporting countries do not allow sharing confidential data outside the BIS.
Although the currency-time fixed effects should fully absorb factors such as the higher U.S. rates and value of the dollar, we also try including currency values in the regression (Column 3). For this specification, we limit the sample to lending denominated in dollars, euro, and yen, and use the nominal broad index for each currency as a regressor. We also can have only currency fixed effects, not currency-time fixed effects, but we keep the bank nationality-time and borrower country- time fixed effects. For these results, the coefficient on currency value is negative, as expected, but the triple interaction for Chinese banks is largely unchanged.
Finally, given that Japanese banks also have a home currency with low funding costs and had a larger decline in the dollar share of lending to emerging Asia in the recent period relative to other advanced country banks, we test the same specification, substituting a Japanese bank dummy for the Chinese bank dummy. The three-way interaction with Japanese banks is smaller than the one with Chinese banks and is insignificant (Column 4).
1. We would like to thank William Barcelona, Albina Khatiwoda, Anil Jain, Pinar Uysal, Colin Weiss, and Swapan-Kumar Pradhan for helpful comments and analytical support. Return to text
2. Bertaut, von Beschwitz, Curcuru (2023). Return to text
3. Percentage change calculations use flows and levels that have been adjusted for exchange rate valuation and series breaks. Return to text
4. Bank lending in this note refers to claims from public BIS locational banking statistics unless otherwise noted; these claims include loans, securities, repurchase agreements and other financial assets. Conclusions based on public or even public and restricted data (the latter used only in our regressions) may differ from those based on the full data, which is not available outside the BIS. Return to text
5. World Economic Outlook, IMF, 2022 (https://www.imf.org/en/Publications/WEO/Issues/2022/10/11/world-economic-outlook-october-2022). Return to text
6. As noted in McGuire et al. (2024), the growth rate of international credit in a currency is negatively correlated over time with the value of that currency and interest rates in that currency. Meanwhile the average USD/JPY cross-currency basis, a "premium" or excess cost of funding in dollars through FX swaps, was also somewhat higher in 2022 and 2023 than it had been during the previous two years, adding further to the cost of dollar funding. Return to text
7. Eastern Europe also experienced a large percent decline in dollar denominated lending, which is not surprising given Russia's war in Ukraine. However, the quantity of dollar lending to Eastern Europe is small compared to other EME regions. Return to text
8. During the "China scare", total cross-border lending decreased sharply to China but fell by 8 percent to the region as a whole. Dollar-denominated cross-border lending fell by a similar percentage as total cross-border lending. Return to text
9. Non-major currencies are not identified individually in the BIS data, but in this case, as discussed below, increased lending appears to be mostly in RMB, but possibly also other local EME currencies. Return to text
10. This increase is partly due to China's Belt and Road Initiative, launched in 2013, which provides Chinese financing for infrastructure development in EMEs. Its implementation has mostly aligned with surges in external Chinese lending; see Dawson (2022) and Horn et al (2021). Return to text
11. See Figure 1 in Cerutti, Pradhan, Casanova (2021). Cerutti, Casanova, Pradhan (2023) indicate that Chinese banks have become the main cross-border creditor for a significant portion of emerging markets and provide evidence that Chinese cross-border lending to EMEs differs from other big lenders. See Cerutti, Pradhan, Casanova (2024) for an update on the scope of Chinese lending to EMEs. Return to text
12. In the BIS locational banking statistics, emerging Asia represents $4 trillion out of the $6.3 trillion total cross-border lending to EMEs by all banks (as of 2024Q2). We multiply the quantity of total lending by the published market shares for Chinese banks in these regions to find the share of Chinese lending to emerging Asia. Return to text
13. Jurisdictions such as Hong Kong and Macao are measured separately from mainland China and therefore lending between these jurisdictions is recorded as cross-border in these data. Return to text
14. Relative to other banks, Chinese banks actually had a high share of cross-border lending denominated in dollars over the past decade. Return to text
15. Although RMB lending is not identified in public BIS banking statistics, the October 2024 BIS statistical release summary also identified RMB as the main growth currency in lending to emerging and developing economies. Return to text
16. The quantity of Chinese banks' global dollar cross-border lending decline, $267 billion, is substantial compared to the decline in dollar cross-border lending to emerging Asia by all banks, $388 billion. Given that Chinese banks' dollar lending to non-EMEs could have actually increased, to take advantage of newly attractive yields on U.S. or European assets, it is plausible that all of their $267 billion decline, or even more, is with EMEs. Return to text
17. Robustly estimating the expected effect of higher U.S. rates and the higher dollar on the dollar share of cross-border lending is beyond the scope of this note given that recent history provides a poor model, with a relatively flat Fed Funds rate and no recent hiking cycles that were accompanied by dollar appreciation. Return to text
18. However, fixed effects do not absorb factors unique to the combination of a specific currency and bank nationality, such as Chinese banks and RMB lending, and would only absorb a general currency preference shift by borrowers to a lower-cost currency, such as RMB, to the extent that banks of multiple nationalities are able to cater to that preference shift with RMB-denominated lending. Return to text
19. Although Chinese banks' sources of dollar funding are somewhat opaque, we assume they have an interest rate that is significantly influenced, at least, by prevailing rates in global dollar money markets. Although Chinese banks do have some domestic deposit base in dollars, our assumption is consistent with Chinese banks issuing hundreds of billions of short-term dollar-denominated international debt securities (Aldasoro et al, 2021) and is also consistent with assumptions discussed in Kodres et al (2022) regarding Chinese banks' covering dollar assets with synthetic dollar liabilities from FX derivative markets. Return to text
20. Japanese banks also have a low-cost home currency during this period, with low rates and yen depreciation; indeed, yen-denominated cross-border lending to emerging Asia rose 28 percent over the period, though from a low level. Japanese banks also experienced an unusually large decline in their dollar share of cross-border lending (not shown), although less sudden and less steep than that of Chinese banks. We ran the same fixed effects regression on Japanese bank lending as for Chinese bank lending. Japanese banks also had a negative interaction term on dollar lending since 2021, but it was not as large as that of Chinese banks and was not statistically significant (see Appendix). These facts support interest rates as a primary explanation for currency shifts across banks, including Chinese banks, but still suggest the Chinese bank shift is larger than that of other banks. Return to text
21. See Horn et al. (2023), which suggests RMB bridge loans and drawings on RMB swap lines could enable distressed countries to service debt to China that was originally denominated in dollars. The data for the Horn et al study ends in 2021, before our period of interest, therefore quantities are not comparable. However, most of the swap line drawings they analyze are by countries outside Asia, making it unclear if distressed debt servicing and swap lines play a significant role in the lending we focus on. Return to text
22. Examples of China's actions towards dollar alternatives in international finance include establishing the Cross-Border Interbank Payment System (CIPS), the New Development Bank with the BRICS, the Sino-Russian Financial Alliance, and economic goals for the regional security organization Shanghai Cooperation Organization (SCO); see Liu and Greenberg (2022) and De Mott (2023). Greene (2024) explores the difficulties de-dollarizing. For a discussion of changes in the international role of the dollar, see Bertaut, von Beschwitz, and Curcuru (2021). Return to text
23. See Liu and Greenberg (2022), De Mott (2023), and Greene (2024). Return to text
DeMarco, Laurie, and Joshua Walker (2025). "Chinese Banks' Dollar Lending Decline," FEDS Notes. Washington: Board of Governors of the Federal Reserve System, May 16, 2025, https://doi.org/10.17016/2380-7172.3761.
Disclaimer: FEDS Notes are articles in which Board staff offer their own views and present analysis on a range of topics in economics and finance. These articles are shorter and less technically oriented than FEDS Working Papers and IFDP papers.