FEDS Notes
July 13, 2022
Decomposing Changes in Higher Education Return on Investment Over Time
Introduction
The economic returns to attending college are a crucial aspect of discussions surrounding student debt and rising tuition. As higher quality data on student outcomes has become available, studies have attempted to quantify the financial value of a college degree across different dimensions and contexts (Webber, 2014; Webber, 2016; Itzkowitz, 2021; Cooper, 2021; Miller and Akabas, 2022).
Using newly available data, this note demonstrates an increase in the returns to attending college for most students in recent decades. I find that, after controlling for the school attended, median student earnings ten years after entering college were significantly higher for those who started college during the 2007-08 academic year than they were for those who started in 1996-97. Even when adjusting for increases in tuition over this time, the return on investment (ROI) increased by three percent for the typical student. There is, however, significant heterogeneity in these trends, with roughly 30% of students attending schools where ROI prospects diminished.
The median student in both the public and private non-profit sectors attended institutions where earnings increased over this period (3.1% and 3.3% respectively). However, earnings declined by 5.8% for the median student at for-profit institutions. I document that these changes are not shared equally across race/ethnicity, with inequality worsening across the sample period. White and Asian students tended to attend schools that saw disproportionate gains, while Black and Hispanic students disproportionately attended institutions that left students worse off financially than earlier cohorts.
I also demonstrate the importance of compositional changes in where students attend college to the overall college premium. Even had within-school returns remained constant, shifts in enrollment patterns (driven largely by the rise and fall of for-profit enrollments) between the late 1990's and late 2010's would have caused a fluctuation of more than ten percentage points in the national college premium for young workers. This paints a more complex narrative than the oft-discussed stagnation of the college premium.
The most important context for interpreting these results is that the earnings boost from attending college is still very large and worth the time and monetary investment for the average student. But many students will fare either better or worse than this average, and so the risk1 of attending college and it not working out financially has likely increased considerably, particularly for underrepresented minority students.
Data and Methodology
The College Scorecard,2 a dataset produced by the Department of Education, contains a wealth of information about student composition and outcomes for every institution that participates in Title IV (e.g. student loans, Pell Grants). Most relevant for this note is that the College Scorecard contains administrative data on the earnings of students measured up to 10 years following their first enrollment at each institution. The earliest cohort earnings data exist for students who enrolled in the 1996-97 academic year, with earnings measured in 2007-08.
After several years of data releases, institutional earnings data were discontinued in favor of program-level metrics (e.g. Economics majors from a particular university). Given the importance of major choice on future earnings, the shift to program-level earnings was a positive development, but because of data limitations these new metrics can only be calculated for the most recent cohorts and only apply to earnings 1-2 years after graduation (though more years will be added in the future).
The Department of Education recently resurrected institution-level outcome data, and in early 2022 provided updated 10-year earnings outcomes (students enrolled in 2007-08 with earnings measured in 2018-19). This allows us to measure outcomes for cohorts 11 years apart to assess how institution-level outcomes have evolved over time.
There are two aspects of data coverage that provide crucial context for any analysis using College Scorecard data. First, earnings metrics are calculated for enrolled students rather than only those who graduated. Comparing a given institution's earnings outcomes to some counterfactual, such as median earnings among high school graduates without any college experience, therefore provides the premium associated with attending that institution (but not necessarily graduating). It therefore implicitly incorporates the likelihood of graduation into the calculation, thereby giving a more complete picture of how well each institution is supporting their students.
Second, the College Scorecard only covers institutions that accept Title IV funds,3 and the earnings metrics only cover students who receive Title IV funds. If a school dramatically alters their financial aid policies, it will alter the mix of students who are covered by the earnings metric. Consequently, a decline in measured earnings could be due to a compositional change rather than a reduction in the labor market premium. While this may be true for some subset of schools in the sample, this concern is alleviated because the percentage of students who had ever received a student loan was virtually unchanged between the earnings cohorts studied in this note.4
I present the change in ROI over time in two distinct ways. First, I take the within-institution change in median earnings5 between cohorts and subtract the implied annual increase (decrease) in payments that students would face based on the increase (decrease) in net tuition and fee revenue per student under the assumption that all of this increase (decrease) were financed through the terms and interest rates available through the federal student loan program in 2007.6
Second, I show how compositional effects of where students attend can have a large effect on the national college earnings premium. I present the ratio of median earnings among college attenders (measured in 2018-19, college enrollment cohort 2007-08) to median earnings among individuals with only a high school diploma.7 I then show how this ratio changes if it is reweighted by the undergraduate enrollment composition in different years.
For example, imagine there are two institutions, A and B. A has a constant ROI ratio of 2 and B has a ratio of 1.2. If enrollments were split equally between A and B in 2000, then the national ratio would be 1.6. However, if by 2010 enrollments at institution B had increased to 60% of the total, the national ROI ratio would appear to have fallen to 1.52. In other words, the premium to attending college would have appeared to decline even though the return to attending each school stayed constant. By performing this type of decomposition using the College Scorecard data, I illustrate how such compositional shifts can have a significant effect on the returns to education measured in standard household surveys.
Results
Table 1 presents the distribution of the most recent ROI premiums weighted by enrollment, broken down both by sector and by the predominant degree offered. It is important to remember that the underlying variables available in the College Scorecard refer to median earnings within an institution. So the interpretation of the cell in the top-left corner of Table 1 is that 10 percent of students attend a school where the median ROI premium is 1.5 or less. Figure 1 illustrates the distributions of ROI across sectors, with a line placed at 1 to indicate that when students are no better off than the typical high school graduate.
Table 1: Distribution of Median College Investment Premiums
| Sample | 10th percentile institution | 25th percentile institution | Median percentile institution | 75th percentile institution | 90th percentile institution |
|---|---|---|---|---|---|
| Overall | 1.5 | 1.71 | 1.95 | 2.32 | 2.72 |
| Public | 1.57 | 1.72 | 1.94 | 2.3 | 2.64 |
| Private non-profit | 1.38 | 1.75 | 2.08 | 2.56 | 3.25 |
| Private for-profit | 0.93 | 1.14 | 1.36 | 1.64 | 2.27 |
| Public four-year | 1.8 | 2 | 2.28 | 2.53 | 2.94 |
| Public two-year | 1.5 | 1.63 | 1.78 | 1.92 | 2.1 |
| For-profit four-year | 1.27 | 1.35 | 1.64 | 1.68 | 2.66 |
| For-profit two-year | 0.88 | 1.06 | 1.26 | 1.55 | 1.96 |
Note: Each cell represents the enrollment-weighted ratio of earnings among individuals who attended college to the earnings of median high school graduates at age 30. College earnings are measured in 2018-19, and correspond to students who enrolled in 2007-08. Earnings are reduced by the measured tuition/fees that the average student paid at each school, assuming these costs were financed by the student loan terms/interest rates available at the time they were enrolled. Source: College Scorecard.
Figure 1. Distribution of Median College/HS Earnings Ratio in 2018-19 for the 2007-08 Enrollment Cohort
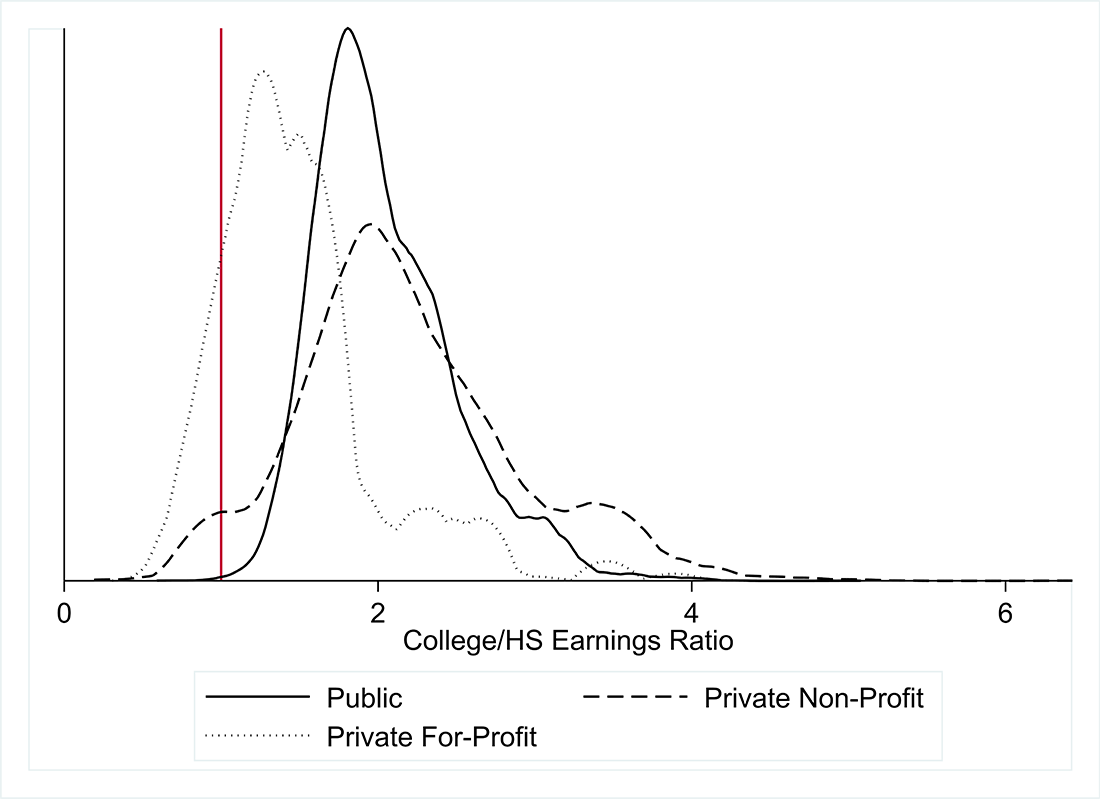
Source: Author's calculations from College Scorecard
While the results above may appear to provide overwhelmingly strong evidence in support of college as an upward driver of economic mobility, the reality is much more complex. To see this, rather than focusing on the median student, consider the (enrollment-weighted) return for the 25th percentile of students at each institution in Table 2. This table shows the importance of thinking of college attendance as a financial investment with uncertain returns, rather than a static premium that every student receives. The downside risk is very low at public institutions, particularly public four-year schools. At over 75 percent of private for-profit institutions, the return on investment for the 25th percentile student is negative.
Table 2: Distribution of 25th Percentile College Investment Premiums
| Sample | 10th percentile institution ratio | 25th percentile institution ratio | Median percentile institution ratio | 75th percentile institution ratio | 90th percentile institution ratio |
|---|---|---|---|---|---|
| Overall | 0.79 | 0.94 | 1.12 | 1.42 | 1.63 |
| Public | 0.85 | 0.97 | 1.13 | 1.42 | 1.62 |
| Private non-profit | 0.6 | 0.91 | 1.18 | 1.48 | 1.81 |
| Private for-profit | 0.4 | 0.52 | 0.65 | 0.83 | 1.27 |
| Public four-year | 1.03 | 1.21 | 1.41 | 1.58 | 1.84 |
| Public two-year | 0.81 | 0.89 | 0.99 | 1.1 | 1.18 |
| For-profit four-year | 0.36 | 0.56 | 0.77 | 0.84 | 1.52 |
| For-profit two-year | 0.42 | 0.51 | 0.63 | 0.79 | 1.08 |
Note: Each cell represents the enrollment-weighted ratio of earnings among individuals who attended college to the earnings of median high school graduates at age 30. College earnings are measured in 2018-19, and correspond to students who enrolled in 2007-08. Earnings are reduced by the measured tuition/fees that the average student paid at each school, assuming these costs were financed by the student loan terms/interest rates available at the time they were enrolled. Source: College Scorecard.
Taken together, there is generally greater variability (both upside and downside risk) at private non-profits. At the high end this is due to very selective institutions, while at the low end the cost of attendance exceeds the benefits of commensurate labor market outcomes. For-profit institutions offer the weakest ROI prospects, but it is important to note the heterogeneity in returns across this sector, as there are clearly some institutions delivering value to students.8
It is important to be clear that the figures in Tables 1 and 2 do not necessarily represent causal estimates. The literature on returns to college quality generally finds large disparities across schools (Hoekstra, 2009; Cohodes and Goodman, 2014; Andrews, Li, and Lovenheim, 2016; Scott-Clayton, 2018; Canaan and Mouganie, 2018). A notable exception to this finding comes from Dale and Krueger (2014) which finds no differences in returns on average across a set of relatively selective schools. An excellent reconciliation of this literature can be found in Hoxby (2018) which examines value-added and productivity (return on spending) across most of the higher education landscape. She finds practically no differences among highly selective schools, but significant dispersion in quality among non/less selective schools.
Table 3 shows the within-institution change in ROI between the 96-97 and 07-08 college cohorts. Somewhat surprisingly, given rising tuition and the popular narrative of a stagnating college premium, the overall financial prospects for the typical college students have actually improved over time (at least up through the most recent measurement in 2018-19). There is significant heterogeneity in these changes though, with roughly 30 percent of students attending an institution with at least slightly worse prospects than students attending the same institution just over a decade earlier would have had. Additionally, a greater share of enrollment-weighted private for-profit institutions saw declining ROI than was the case for either public or private non-profit institutions. Figure 2 plots the entire distribution of changes in within-institution returns.
Table 3: Distribution of Within-Institution Changes in Financial Return on Investment for the Median Student
| Sample | 10th percentile institution change | 25th percentile institution change | Median percentile institution change | 75th percentile institution change | 90th percentile institution change |
|---|---|---|---|---|---|
| Overall | -6.5% | -1.2% | 3.0% | 8.2% | 12.7% |
| Public | -4.8% | -0.7% | 3.1% | 8.0% | 11.7% |
| Private non-profit | -9.6% | -4.3% | 3.3% | 10.0% | 16.1% |
| Private for-profit | -27.4% | -16.4% | -5.8% | 9.9% | 19.0% |
| Public four-year | -4.7% | -0.7% | 3.2% | 7.8% | 11.9% |
| Public two-year | -4.8% | -0.5% | 2.9% | 8.3% | 11.3% |
| For-profit four-year | -27.4% | -27.4% | -12.9% | 7.9% | 10.1% |
| For-profit two-year | -22.4% | -13.3% | -2.4% | 11.4% | 23.3% |
Note: Each cell represents the enrollment-weighted change in median earnings between 2007-08 and 2018-19, which includes students who enrolled in each institution ten years prior. Earnings are reduced by the measured change in tuition/fees that the average student paid at each school, assuming these costs were financed by the student loan terms/interest rates available at the time they were enrolled. Source: College Scorecard.
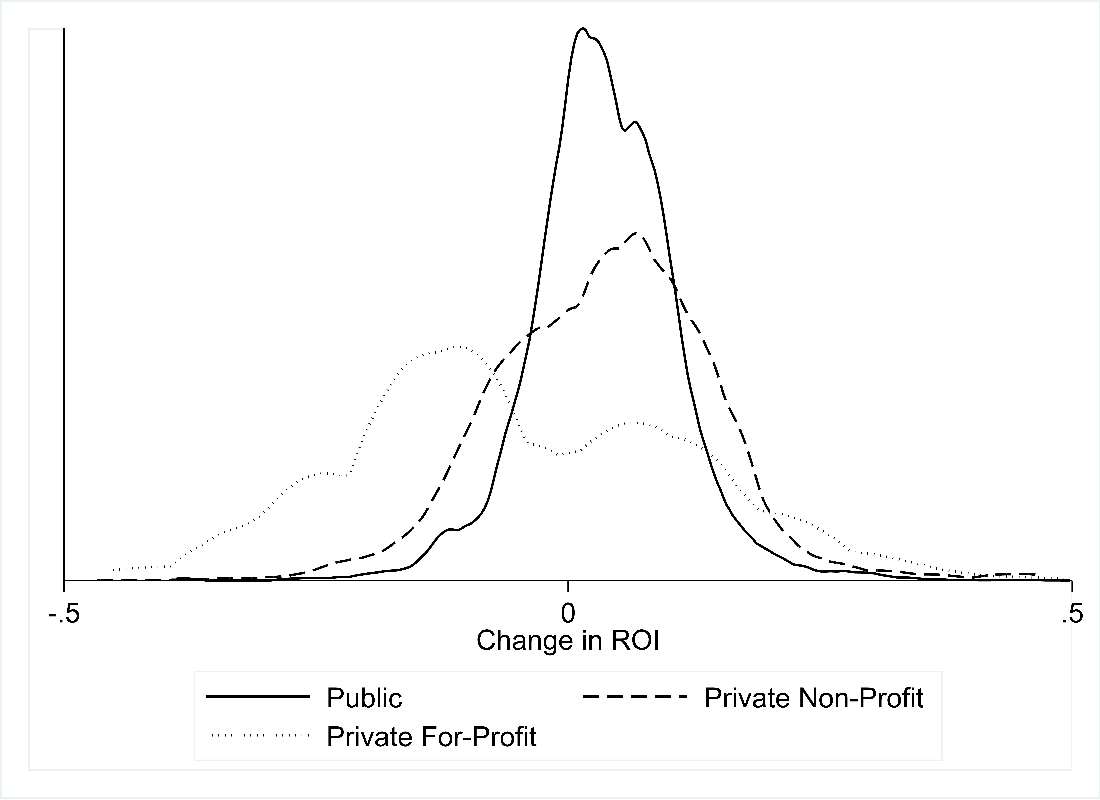
Source: Author's calculations from College Scorecard
It is important to point out that changes in both aggregate labor market conditions, and the past experience of workers, provide important context to this analysis. Earnings for the earliest cohort are measured close to the onset of the Great Recession, while those for the most recent cohort are measured late in the subsequent expansion. The overall worse economic conditions during the first measurement would tend to overstate positive changes over time. On the other hand, compositional differences in the labor force would likely lead to an understatement of the differences over time. Finally, a large literature has noted the persistent negative effects of graduating into a recession.9 With the later cohort graduating into the Great Recession, this mechanism would also lead to an understatement of earnings gains over time.
Another way to decompose the change in institutional returns is to weight based on race/ethnicity-specific enrollment rather than all undergraduates. Table 4 illustrates that inequality in returns is growing across the dimension of race. White and Asian students attend institutions that are yielding disproportionately stronger labor market returns over time. The median change in school-level ROI among White students was +4.9 percent over this period and among Asian students it was +8.3 percent. By contrast, Black and Hispanic students tend to be enrolled in institutions that are leaving students worse off than earlier cohorts. The median change in school-level ROI among Black students was -0.3 percent and among Hispanic students it was -0.9 percent.
Table 4: Distribution of Within-institution Changes in Financial Return on Investment for the Median Student (Weighted by Enrollment Within Each Race/Ethnicity)
| Sample | 10th percentile institution change | 25th percentile institution change | Median percentile institution change | 75th percentile institution change | 90th percentile institution change |
|---|---|---|---|---|---|
| Overall | -6.5% | -1.2% | 3.0% | 8.2% | 12.7% |
| White | -5.5% | -0.1% | 4.9% | 9.4% | 14.1% |
| Black | -13.8% | -8.6% | -0.3% | 6.3% | 12.8% |
| Hispanic | -17.0% | -9.7% | -0.9% | 9.6% | 19.0% |
| Asian | -5.7% | 1.9% | 8.3% | 14.1% | 14.1% |
Note: Each cell represents the race/ethnicity-enrollment-weighted change in earnings between 2007-08 and 2018-19, which includes students who enrolled in each institution ten years prior. Earnings are reduced by the measured change in tuition/fees that the average student paid at each school, assuming these costs were financed by the student loan terms/interest rates available at the time they were enrolled. Source: College Scorecard.
This is not a surprising finding given prior work on student loans (Addo and Houle, 2016), education (Addo and Darity, 2021), and upward economic mobility in general (Andrews, Casey, Hardy, and Logan, 2017). Nonetheless, figures such as those in Table 4 are critical to keep in mind when evaluating whether higher education is a great equalizer and an unparalleled engine for upward economic mobility. While this may be true for some segments of the population, it is certainly not true for all.
At first glance, it may seem difficult to reconcile the numbers presented in Table 3 with the evidence from household surveys that the college wage premium has stagnated since roughly 2000. Figure 3 reconciles these seemingly divergent facts by illustrating the importance of compositional shifts in college attendance. This figure simulates how the national ratio of median college earnings to median high school earnings (measured in 2018 for individuals age 30) would have changed over time had the future earnings of students at each school remained the same. Because within-institution earnings remain the same, the simulated changes in the college wage premium reflect changes in where students chose to attend school. The decline from the late 90's through 2010 indicates that students disproportionately enrolled in lower-return institutions, predominantly driven by the rise of for-profit schools (where total enrollment increased from 0.5 million in 1996 to 2.1 million in 2010). The decline in for-profit enrollments following 2010 increased the implied national college premium.
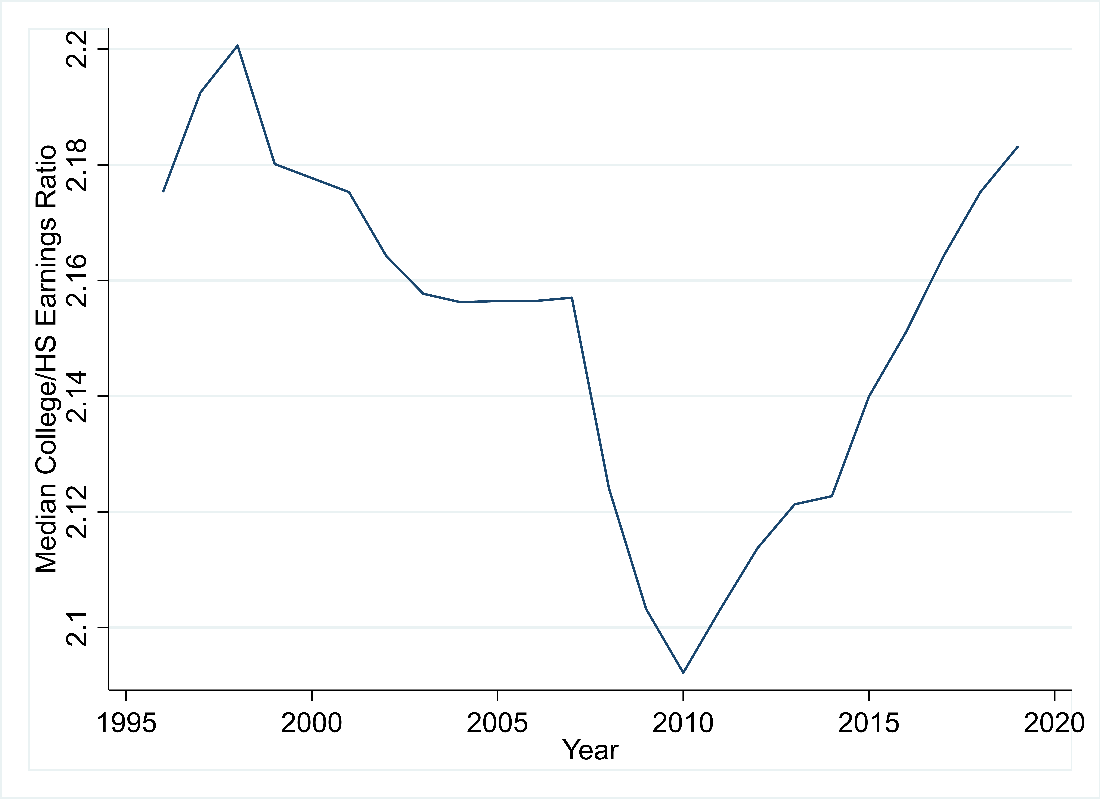
Source: Author's calculations from College Scorecard
Combining Table 3 and Figure 3, it appears that the stagnant college premium often noted in household surveys is actually the result of two counterbalancing forces: 1) a modest increase in within-institution returns, and 2) a large compositional shift toward lower-return schools in the 2000's.
Based on the shift away from low-return institutions following the Great Recession, we might expect to see an increase in the college premium estimated from household surveys once these students have fully established themselves in the labor market. There are two reasons we may not see this pattern, however. First, the reorganization of the labor market following the pandemic is unpredictable for many reasons (reduced learning due to remote education, shift in sector/skill-based wage premiums given the new remote-work landscape, etc.). Second, there are signs that enrollment patterns shifted back toward the for-profit sector during the pandemic due to the sector's pre-pandemic experience building a remote education infrastructure.10
Conclusion
This note examines the college earnings premium along novel dimensions using recently released administrative data. I document that the within-institution return on investment has increased across student cohorts. However, substantial heterogeneity across institutional sector and level. Most notably, I find that the changes over time have exacerbated racial and ethnic inequality with respect to earnings outcomes. Finally, I document how shifts in enrollment patterns over time can have a significant effect on the estimated college premium from standard household surveys. In particular, I conclude that the relatively constant college premium observed since 2000 is likely a combination of an increasing within-college premium and a compositional shift in favor of lower-return institutions.
References
Addo, Fenaba R., and William A. Darity Jr. "Disparate recoveries: Wealth, race, and the working class after the Great Recession." The ANNALS of the American Academy of Political and Social Science 695.1 (2021): 173-192.
Addo, Fenaba R and Houle, Jason N and Simon, Daniel, "Young, black, and (still) in the red: Parental wealth, race, and student loan debt", Race and Social Problems 8, 1 (2016), pp. 64–76.
Akers, Beth. "Making College Pay: An Economist Explains How to Make a Smart Bet on Higher Education" Penguin Random House Press. (2021).
Andrews, Rodney, Marcus Casey, Bradley L. Hardy, and Trevon D. Logan. "Location matters: Historical racial segregation and intergenerational mobility." Economics Letters 158 (2017): 67-72.
Andrews, Rodney J., Jing Li, and Michael F. Lovenheim. "Quantile treatment effects of college quality on earnings." Journal of Human Resources 51.1 (2016): 200-238.
Canaan, Serena, and Pierre Mouganie. "Returns to education quality for low-skilled students: Evidence from a discontinuity." Journal of Labor Economics 36.2 (2018): 395-436.
Cellini, Stephanie Riegg, and Claudia Goldin. "Does federal student aid raise tuition? New evidence on for-profit colleges." American Economic Journal: Economic Policy 6.4 (2014): 174-206.
Cellini, Stephanie Riegg. "The alarming rise in for-profit college enrollment." Washington, DC: Brookings (2020).
Cohodes, Sarah R., and Joshua S. Goodman. "Merit aid, college quality, and college completion: Massachusetts' Adams scholarship as an in-kind subsidy." American Economic Journal: Applied Economics 6.4 (2014): 251-85.
Cooper, Preston "Is College Worth it? A Comprehensive Return on Investment Analysis" The Foundation for Research on Equal Opportunity. 2021.
Dale, Stacy B., and Alan B. Krueger. "Estimating the effects of college characteristics over the career using administrative earnings data." Journal of human resources 49.2 (2014): 323-358.
Hoekstra, Mark. "The effect of attending the flagship state university on earnings: A discontinuity-based approach." The review of economics and statistics 91.4 (2009): 717-724.
Hoxby, Caroline M, "The productivity of us postsecondary institutions", in Productivity in Higher Education. University of Chicago Press, (2018).
Itzkowitz, Michael. "Which College Programs Give Students the Best Bang for their Buck?" Third Way. August (2021).
Itzkowitz, Michael. "Building the College Scorecard: A Tool to Assess Value and Consumer Choice" in Student Outcomes and Earnings in Higher Education Policy. Edited by Jason Delisle. American Enterprise Institute. 2022.
Kahn, Lisa B. "The long-term labor market consequences of graduating from college in a bad economy." Labour economics 17.2 (2010): 303-316.
Kelchen, Robert, Higher education accountability. JHU Press. (2018).
Matsudaira, Jordan D., and Lesley J. Turner. "Towards a framework for accountability for federal financial assistance programs in postsecondary education." Brookings Institution (2020).
Miller, Kevin and Shai Akabas. "Which Colleges are Worth the Cost?: Institution-Level Return on Investment for Students and Taxpayers" Bipartisan Policy Center. February (2022).
Scott-Clayton, Judith. "What accounts for gaps in student loan default, and what happens after." Brookings Institution (2018).
Webber, Douglas A. "The lifetime earnings premia of different majors: Correcting for selection based on cognitive, noncognitive, and unobserved factors." Labour economics 28 (2014): 14-23.
Webber, Douglas A. "Are college costs worth it? How ability, major, and debt affect the returns to schooling." Economics of Education Review 53 (2016): 296-310.
1. See Akers (2021) for a discussion of the most recent work on the risk dimension of college attendance. Return to text
2. For a full history of the College Scorecard, see Itzkowitz (2022) Return to text
3. See Cellini and Goldin (2014) for a detailed discussion of institutions which do not participate in the student loan program. Return to text
4. Weighting the loan percentage by the undergraduate student enrollment yields a national percentage of 73.8 percent for the 1996-97 cohort and 72.2 percent for the 2007-08 cohort. Return to text
5. All dollar figures are adjusted for inflation, and presented in constant 2020 dollars. Return to text
6. For example, a four-year college which had an increase in real tuition/fee revenue per student of $1000 between the earliest and latest cohorts would see students borrow an additional 4*$1000 at an interest rate of 6.8%, which equates to increased annual payments of $772 (based on the standard ten-year repayment plan). Return to text
7. As measured in the American Community Survey. Return to text
8. These results closely connect with the literature on accountability in higher education. For an excellent overview see Kelchen (2018), and for a discussion of future directions see Matsudaira and Turner (2020). Return to text
9. The seminal work in this literature is Kahn (2010). Return to text
10. See Cellini (2020). Return to text
Webber, Douglas (2022). "Decomposing Changes in Higher Education Return on Investment Over Time," FEDS Notes. Washington: Board of Governors of the Federal Reserve System, July 13, 2022, https://doi.org/10.17016/2380-7172.3155.
Disclaimer: FEDS Notes are articles in which Board staff offer their own views and present analysis on a range of topics in economics and finance. These articles are shorter and less technically oriented than FEDS Working Papers and IFDP papers.