FEDS Notes
April 30, 2021
Developments in the Credit Score Distribution over 2020
Sarena Goodman, Geng Li, Alvaro Mezza, and Lucas Nathe1
The distribution of household credit risk can vary with aggregate economic and credit conditions. For example, the share of subprime-scored borrowers declined at a relatively steady pace during the economic recovery from the Global Financial Crisis.2 Although the COVID-19 pandemic interrupted the economic conditions that supported this trend, the pace of decline accelerated following the pandemic’s onset in March 2020 (figure 1).
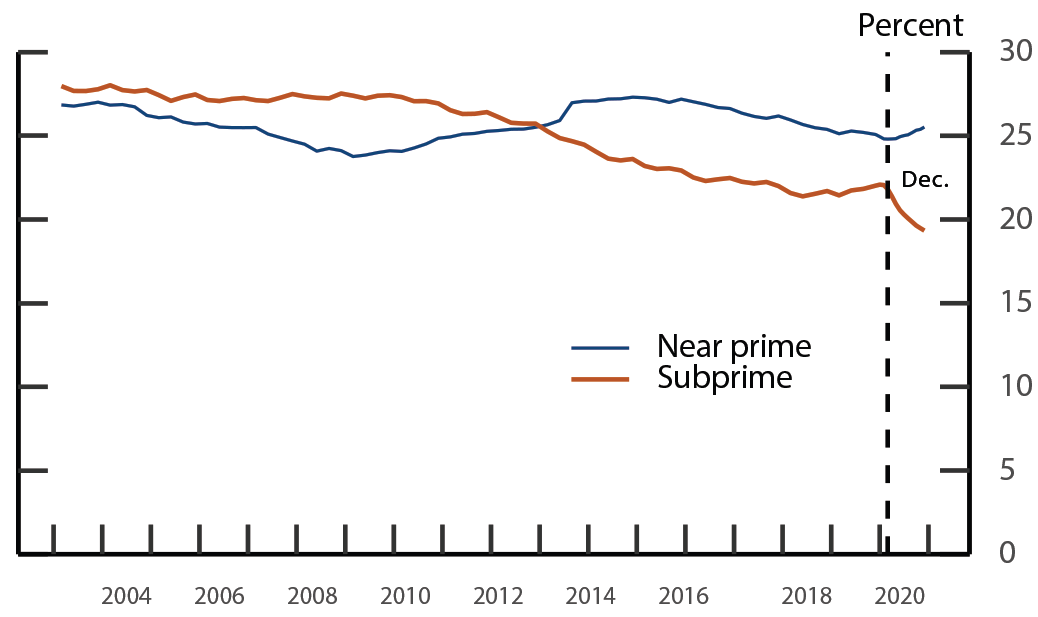
Note: Share of credit scored-individuals in indicated credit risk category. Near prime refers to credit score between 620 and 729, and subprime below 620. Vertical dashed line represents March 2020, the onset of the pandemic.
Source: Federal Reserve Bank of New York Consumer Credit Panel/Equifax.
The analysis that follows suggests that this acceleration was largely driven by the Coronavirus Aid, Relief, and Economic Security Act’s (CARES Act) forbearance provisions. (Other contributing factors to this acceleration include income support programs and subdued consumption activity over this interval.) These temporary provisions likely reduced the reliability of a borrower’s recent payment history—a key determinant of credit scores—as a signal of credit risk during the pandemic. Thus, the recent migration of many borrowers from the subprime group to the lower credit risk categories might not reflect an improvement in the overall credit quality of households.
The CARES Act established programs that helped suspend payments for many struggling mortgage and student loan borrowers.3 Under these programs, homeowners with federally backed mortgages could enter into penalty-free forbearance for up to a year and student loans held by the Department of Education were automatically placed in zero interest forbearance through September 2020.4 Both programs were subsequently extended. Further, while lenders may ordinarily report loans in forbearance with a “past due” status to the credit bureaus, the CARES Act required accounts with a payment accommodation during the pandemic, including those in forbearance, to be reported as “current.”5 This requirement expressly applied to student loans held by the Department of Education as well as other types of loans that were current upon entry into forbearance but appear to have applied to at least some loans that were delinquent upon entry as well (Haughwout et al., 2020).
Analysis of the credit score distribution, payment history, and other main determinants of credit scores point toward forbearance largely driving the increase in scores.6 As shown in figure 2, improvements in credit scores last year were concentrated at the bottom of the distribution. In particular, the sharp increases in the scores delineating the bottom decile and bottom quartile of this distribution indicate a clear break from trend shortly after the onset of the COVID-19 pandemic and its corresponding relief measures. Prior to the pandemic, score increases were more gradual and, if anything, less evident in the bottom decile.
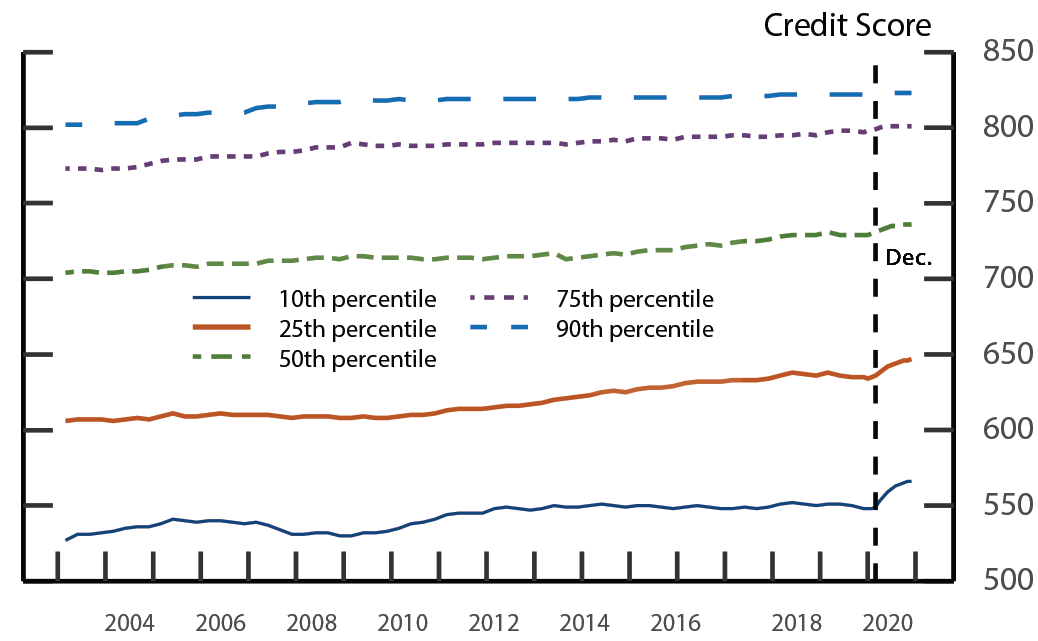
Note: Vertical dashed line represents March 2020, the onset of the pandemic. Quarterly data before 2020 and monthly data thereafter.
Source: Federal Reserve Bank of New York Consumer Credit Panel/Equifax.
Among borrowers in the bottom quartile, delinquency rates decreased sharply early in the pandemic across all categories of debt (figure 3).7 The drops were largest for mortgages and student loans, for which forbearance was mandated. The slight retracing of the declines in auto loan and credit card delinquency rates later in the year is also consistent with some lenders letting their voluntary pandemic forbearance programs lapse. Regarding another factor influencing credit scores, outstanding loan balances among borrowers in the bottom quartile exhibited at most modest declines over 2020 (figure 4). That said, this segment’s credit card utilization rate dropped early in the pandemic, likely contributing to higher credit scores (figure 4). This drop could reflect reduced consumer spending as well as use of income support programs to pay down high interest debt (Coibion, Gordonichenko, and Weber, 2020).
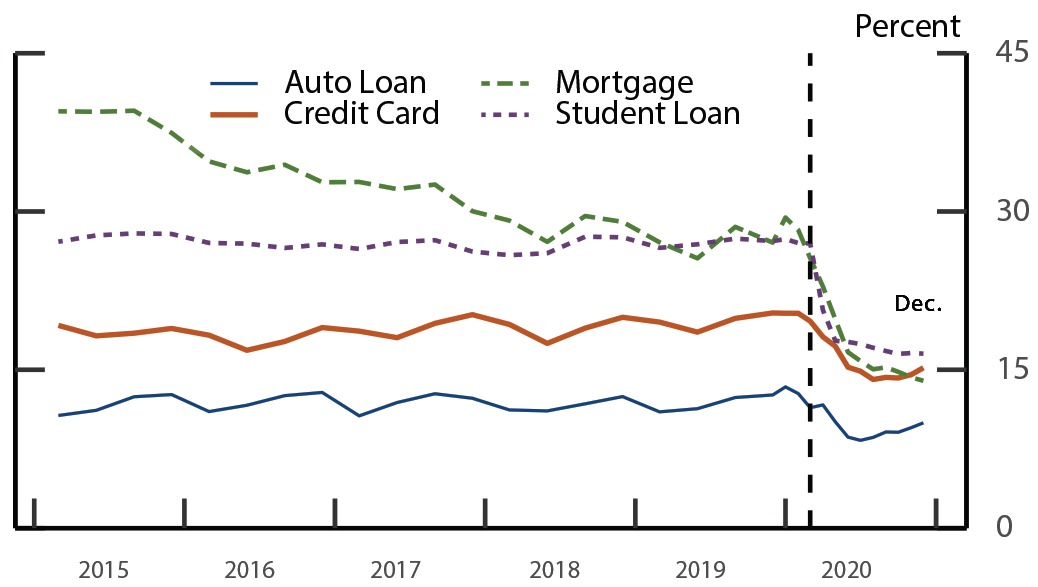
Note: The delinquency rate for mortgage, credit card, and auto loans refers to the percent of balances 30-days past due in the respective category; for student loans, it is the percent of balances 90-plus days past due. Vertical dashed line represents March 2020, the onset of the pandemic.
Source: Federal Reserve Bank of New York Consumer Credit Panel/Equifax.
Figure 4. Loan Balances and Credit Card Utilization among the Bottom Quartile of the Credit Score Distribution
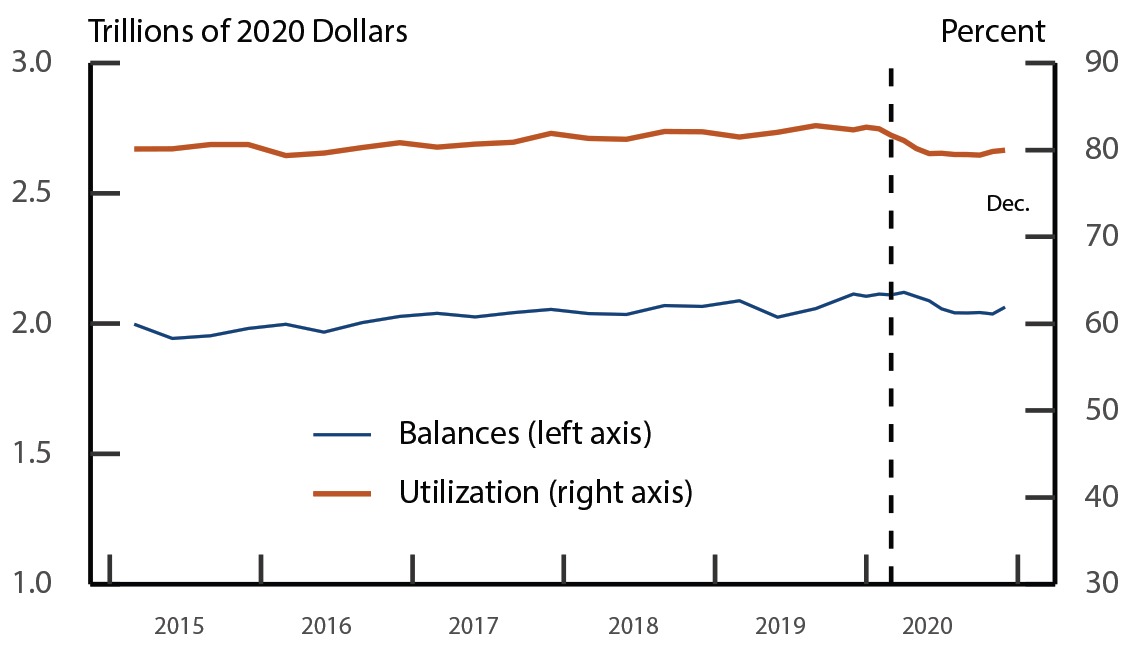
Note: Auto loan data are linearly interpolated between April and July 2020 due to reporting issue. Credit card utilization rate is the ratio of credit card balances to credit card limits. Vertical dashed line represents March 2020, the onset of the pandemic.
Source: Federal Reserve Bank of New York Consumer Credit Panel/Equifax.
Despite the pronounced improvement in credit scores, lenders do not appear to have made credit substantially more available to borrowers benefitting from forbearance. Borrowing has remained relatively flat among the segments of the distribution that saw their scores rise the most and that are usually very responsive to credit availability, suggesting credit supply did not substantially increase. Indeed, among borrowers in these segments, success rates in applications for new credit—an indicator of underwriting stringency—plunged early in the pandemic and have remained low (figure 5). Banks have also reported tightening, on balance, in consumer lending standards over this interval.8 This all said, credit inquiries (a proxy for applications) also dropped (figure 5), which, together with flat loan balances and the trajectories of credit utilization and consumer spending, is consistent with weaker demand for credit as well.
Figure 5. Credit Inquiry and Success Rates among the Bottom Quartile of the Credit Score Distribution
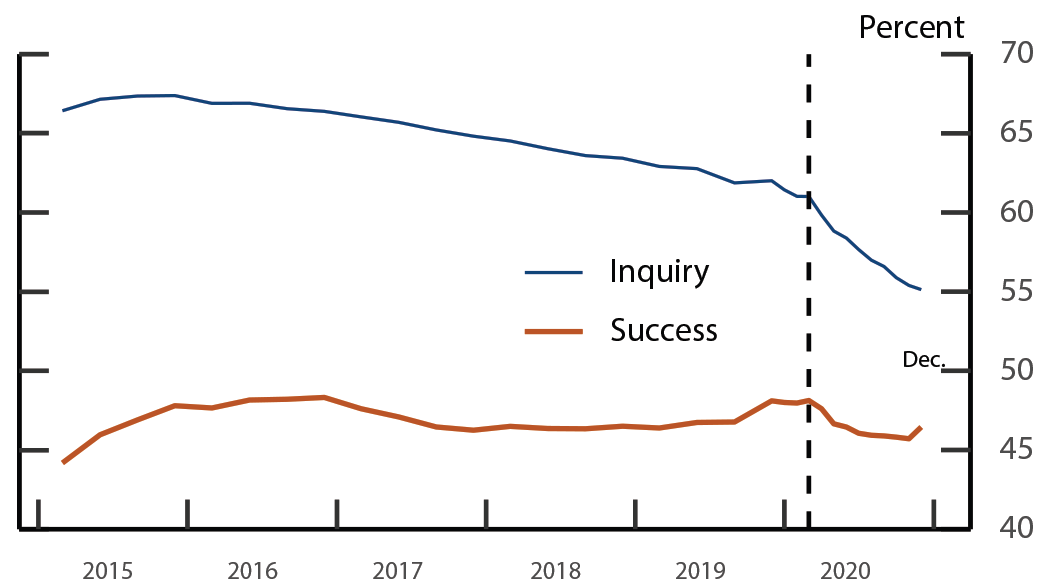
Note: Inquiry shows the percent of individuals with one or more credit record inquiries in the past 12 months; Success shows the percent of individuals opening a new account in the past 12 months given at least one inquiry during the same period. Vertical dashed line represents March 2020, the onset of the pandemic.
Source: Federal Reserve Bank of New York Consumer Credit Panel/Equifax.
In conclusion, thus far, the pandemic-induced downturn has not scarred borrowers’ credit records, partially reflecting the forbearance provisions in the CARES Act.9 That said, the credit score increases that began in early 2020, which have been concentrated toward the bottom segments of the credit score distribution, are likely to unwind once forbearance programs and other stimulus measures lapse, absent considerable job recovery, active household deleveraging, or other interventions to keep borrowers current on payments. Finally, these increases complicate the analysis of credit metrics using standard borrower classifications during the pandemic. In particular, outstanding loan balances among subprime borrowers declined over 2020 (figure 6), which at least partially reflects borrowers (and their corresponding debt) migrating out of the category.
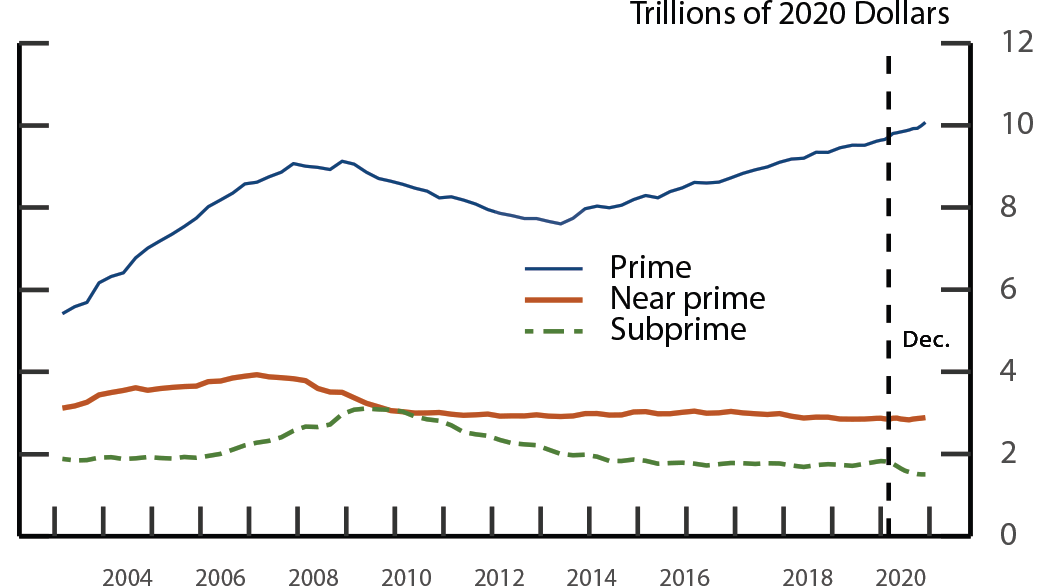
Note: Aggregate debt among credit-scored individuals with score in indicated credit risk category. Near prime refers to credit score between 620 and 729, subprime below 620, and prime above 729. Auto loan data are linearly interpolated between April and July 2020 due to reporting issue. Vertical dashed line represents March 2020, the onset of the pandemic.
Source: Federal Reserve Bank of New York Consumer Credit Panel/Equifax.
References
Coibion, Olivier, Yuriy Gorodnichenko, and Michael Weber (2020). “Labor Markets During the COVID-19 Crisis: A Preliminary View.” NBER Working Paper 27017.
Dettling, Lisa J., and Lauren Lambie-Hanson (2021). “Why is the Default Rate So Low? How Economic Conditions and Public Policies Have Shaped Mortgage and Auto Delinquencies During the COVID-19 Pandemic,” FEDS Notes 2021-03-04. Board of Governors of the Federal Reserve System (U.S.).
Goodman, Sarena, and Steve Ramos (2019). “Understanding Changes in Household Debt by Credit Risk Category: The Role of Credit Score Transitions,” FEDS Notes 2019-06-27. Board of Governors of the Federal Reserve System (U.S.).
Haughwout, Andrew, Donghoon Lee, Joelle Scally, and Wilbert van der Klaauw (2020). “Following Borrowers through Forbearance.” Liberty Street Economics Blog, retrieved from https://libertystreeteconomics.newyorkfed.org/2020/11/following-borrowers-through-forbearance.html
1. This analysis benefitted from the generous input of our colleagues at the Federal Reserve Board. The views presented here are those of the authors and do not necessarily reflect those of the Federal Reserve Board or its staff. Return to text
2. See, for example, Goodman and Ramos (2019). Both that FEDS Note and this analysis examine the Equifax Risk Score 3.0 from the FRBNY Consumer Credit Panel/Equifax. Other credit score models may show a different trend. Return to text
3. See Sections 3513, 4022, and 4023 of the CARES Act. Lenders of other household credit products offered forbearance by choice. Return to text
4. On March 30, 2021, the student loan forbearance provisions were expanded retroactively to include defaulted loans made through the Federal Family Education Loan (FFEL) Program that were privately held. This expansion does not affect our analysis of 2020 credit data but could generate further increases in credit scores. Return to text
5. See Sections 3513 and 4021 of the CARES Act and guidance (PDF) from the Bureau of Consumer Financial Protection. Return to text
6. Payment history, loan balances, and credit utilization are the primary determinants of credit scores. Other inputs to scoring models are type of credit, new credit, and length of credit history. Return to text
7. Borrowers in the bottom decile before the pandemic were more likely to have mortgages and student loans than borrowers in the bottom decile after its onset, indicative of a compositional shift in that segment of the distribution coincident with the rise in scores that is not apparent in the bottom quartile. Return to text
8. See, for example, the Federal Reserve’s Senior Loan Officer Opinion Survey on Bank Lending Practices (SLOOS). The SLOOS and success rates in obtaining new credit for these segments of the credit score distribution both indicate some easing of lending standards toward the end of 2020 compared with early in the pandemic. Return to text
9. Dettling and Lambie-Hanson (2021) explore factors influencing debt repayment over the pandemic. Return to text
Goodman, Sarena, Geng Li, Alvaro Mezza, and Lucas Nathe (2021). "Developments in the Credit Score Distribution over 2020," FEDS Notes. Washington: Board of Governors of the Federal Reserve System, April 30, 2021, https://doi.org/10.17016/2380-7172.2902.
Disclaimer: FEDS Notes are articles in which Board staff offer their own views and present analysis on a range of topics in economics and finance. These articles are shorter and less technically oriented than FEDS Working Papers and IFDP papers.