FEDS Notes
June 23, 2023
Distressed Firms and the Large Effects of Monetary Policy Tightenings1
Ander Perez-Orive and Yannick Timmer
The stance of U.S. monetary policy has tightened significantly starting in March 2022. At the same time, the share of nonfinancial firms in financial distress has reached a level that is higher than during most previous tightening episodes since the 1970s (Figure 1). What are the consequences of a high share of distressed firms—i.e., firms close to default—for the transmission of monetary policy? In this note, we show that firm investment and employment respond strongly to contractionary monetary policy when firms are in distress. In contrast, investment and employment respond weakly for firms that are not in distress or after policy easing shocks.2
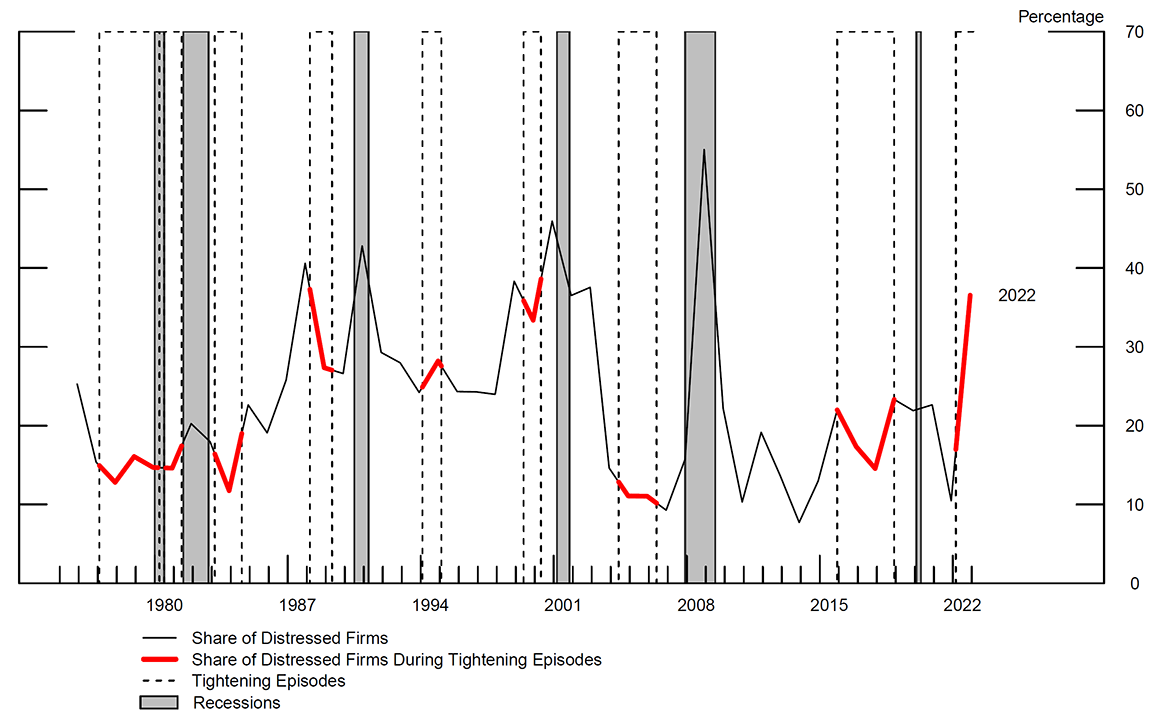
Note: This chart displays the share of U.S. firms in financial distress. Firms in distress are those whose distance to default is below the 25th percentile of the distribution of distance to default across the sample. Distance to default is computed using Compustat and CRSP data following the Merton distance to default model, which takes as inputs the firm’s equity valuation and leverage. The dashed areas reflect monetary policy tightening cycles and the gray areas reflect NBER recessions. The shaded bars indicate periods of business recession as defined by the National Bureau of Economic Research (NBER): January 1980 to July 1980, July 1981 to November 1982, July 1990 to March 1991, March 2001 to November 2001, December 2007 to June 2009 and February 2020 to April 2020.
Source: Authors' calculations based on S&P Global, Compustat, Wharton Research Data Services, http://wrds.wharton.upenn.edu/; recession dates from National Bureau of Economic Research (2023); Center for Research in Security Prices, Wharton Research Data Services, http://www.whartonwrds.com/datasets/crsp/; FRED, Federal Reserve Bank of St. Louis.
Our results suggest that in the current environment characterized by a high share of firms in distress, a restrictive monetary policy stance may contribute to a marked slowdown in investment and employment in the near term. Moreover, our results point to financial factors as an explanation for the stylized fact in the literature that tightening shocks tend to transmit more to aggregate spending and employment than easing shocks (Barnichon et al., 2017; Angrist et al., 2018; Jordá et al., 2020; Debortoli et al., 2020; Barnichon et al., 2022).
Why might firms' distress be responsible for the large effects of monetary policy tightenings?3 Our hypothesis is that following a policy tightening, access to external financing deteriorates more for firms that are in distress than for healthy firms, while following a policy easing, external financing conditions do not change appreciably enough for the two groups of firms to trigger a differential response. As a result, investment and employment are more likely to fall for distressed firms than for healthy firms following tightening shocks, but to respond weakly and similarly to easing shocks for both types of firms. A corollary of this mechanism is that borrowing falls significantly more for distressed than for healthy firms after tightening shocks, and that borrowing for both types of firms does not respond significantly to expansionary shocks. Our evidence is consistent with this corollary and provides support for our hypothesis.
Empirical Strategy and Data
Our empirical strategy uses firm-level data and exploits the heterogeneous response of investment and other variables to monetary policy surprises of firms with different degrees of financial distress. We estimate the response of the cumulative growth rate of the firm-level stock of real capital (or of employment or real debt) using Jordá (2005) local projections. We classify firms into those that are in distress and those that are not (denoted "healthy"). We consider a firm to be in distress if it is closer to default than the firm in the 25th percentile of the distribution of distance to default, and to be healthy otherwise. We estimate for each sample of firms (distressed or healthy) separately the average response of the outcome variable (investment, employment, or debt) to tightening and easing shocks.
Our sample consists of U.S. nonfinancial firms covered by Compustat at a quarterly frequency between 1990 and 2022. For these firms, we use distance to default to measure the probability of firm default over the near-term horizon. As shown by Farre-Mensa and Ljungqvist (2016), distance to default is superior to other common proxies for firms' ability to borrow.4
Finally, to construct monetary policy shocks, we follow Miranda-Agrippino and Ricco (2021). These authors follow a well-established literature that uses high-frequency financial market surprises around key monetary policy announcements to identify unexpected variations in policy. Moreover, they separately identify exogenous policy shocks from shocks about new information from the Federal Reserve regarding the state of the economy. These monetary policy shocks are, therefore, orthogonal to firms' investment opportunities. We aggregate the shocks at the quarterly frequency and split shocks into tightening (positive surprises) and easing shocks (negative surprises). For convenience, we flip the sign of easing shocks, from negative to positive, so that all shocks have positive values.5
Results
We start by showing that monetary policy tightening shocks have stronger effects on investment and employment than easing shocks. Figure 2 displays the estimates of the average dynamic responses of investment and employment to a one standard deviation surprise policy tightening across all firms in our sample. The left panels show that contractionary shocks generate a strong and statistically significant drop in investment and employment. A one standard deviation surprise increase in interest rates is associated with a cumulative drop in investment of 2.8 percent of the initial capital stock after 2 years, and an average drop in employment of 1.2 percent. The right panels report the effects of expansionary shocks and show that these shocks do not generate a response of investment or employment that is statistically different from zero.
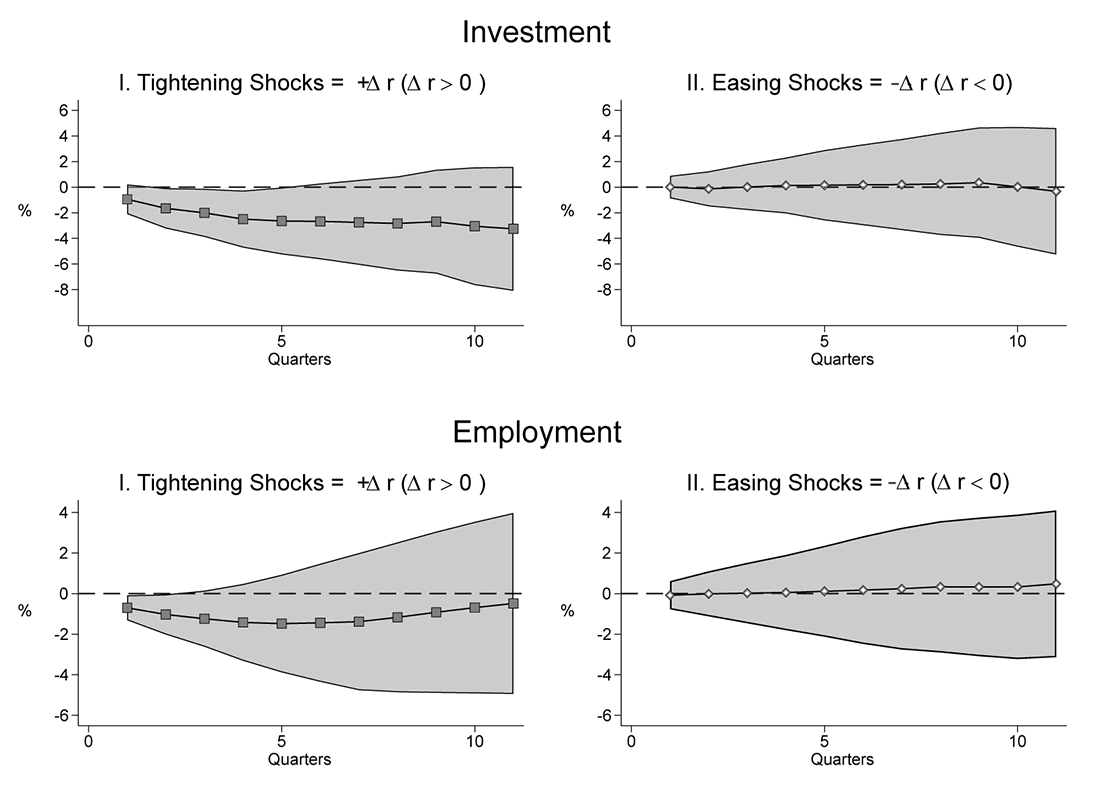
Note: The charts display the estimates of the dynamic responses of investment and employment to a one standard deviation monetary policy tightening or easing shock. The left panels show the effect of tightening shocks while the right panels report the effect of easing shocks. The dependent variable is the difference between the log of total real capital in period t+h and period t-1 in the upper panels and the difference between the log of total employment in period t+h and period t-1 in the lower panels. The monetary surprise in quarter t is calculated by adding the monthly monetary policy shocks obtained from Miranda-Agrippino and Ricco (2021). Tightening shocks are positive surprises and easing shocks are negative surprises. We flip the sign of easing shocks, from negative to positive, so that all shocks have positive values. Shaded areas represent the 99 percent confidence intervals of the estimates.
Source: Authors' calculations based on S&P Global, Compustat, Wharton Research Data Services, http://wrds.wharton.upenn.edu/; FRB data.
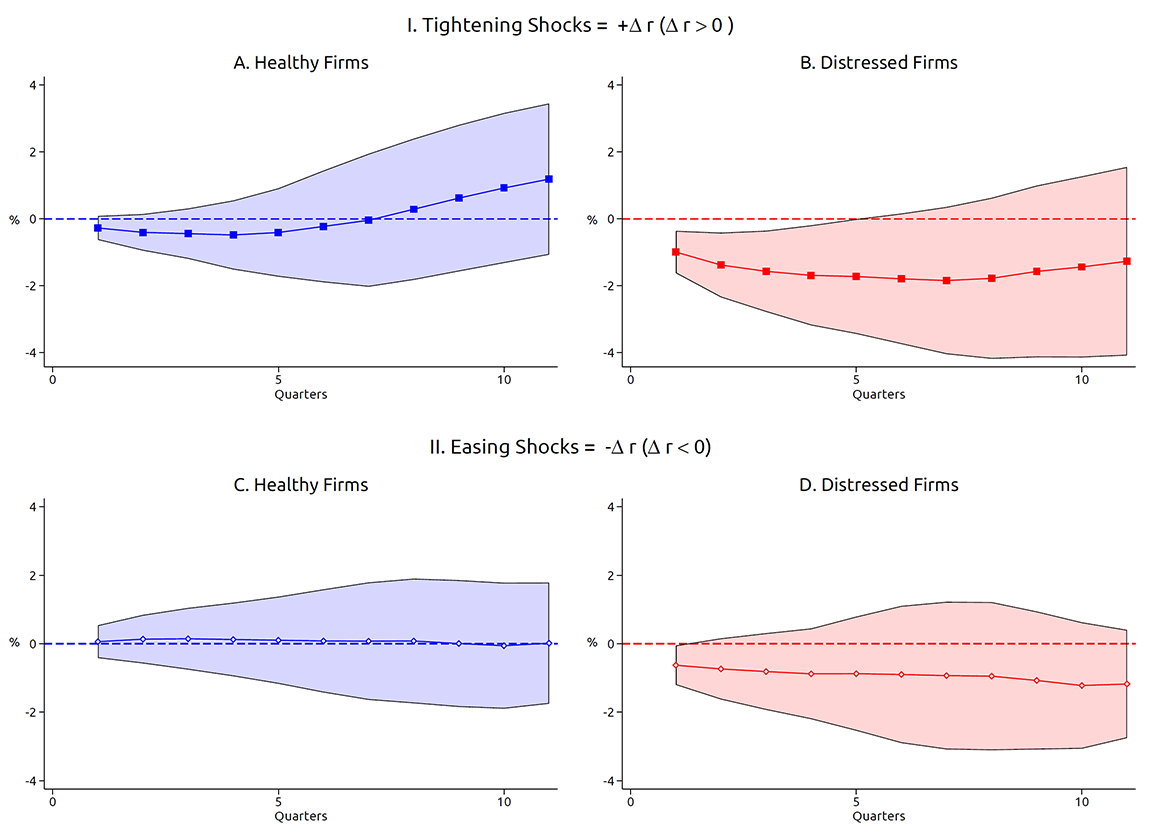
Next, we test our potential explanation for these asymmetric effects of monetary policy on investment: that financial factors are responsible for the large effects of tightening shocks but do not play an important role for easing shocks. According to our hypothesis, following a policy tightening, the ability to borrow and invest deteriorates more for distressed firms than for healthy firms, while following a policy easing, external financing conditions and investment do not respond noticeably for the two groups of firms. In line with this hypothesis, Figure 3 shows that there is a large difference in the investment response to tighter monetary policy of distressed and healthy firms: healthy firms (Panel A) are unresponsive, while distressed firms (Panel B) reduce their investment strongly. Economically, a one standard deviation tightening shock is associated with a cumulative drop in investment after two years of approximately 3.7 percent of the initial capital stock for distressed firms, while the effect on the capital stock of healthy firms is statistically and economically negligible.6 In contrast to tightening shocks, the bottom panels of Figure 3 show that the response of investment to easing shocks is not statistically different from zero at conventional significance levels for both distressed and healthy firms.7
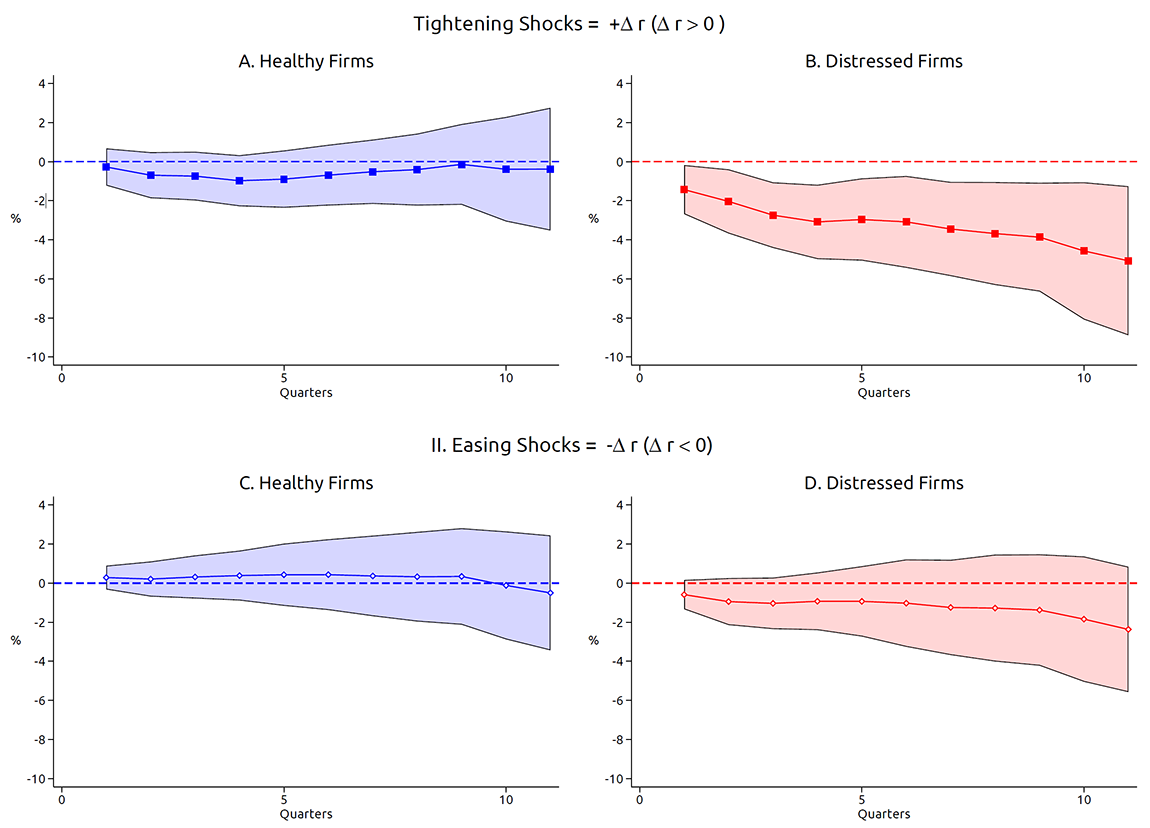
Note: The charts display the estimate of the dynamic response of investment to a one standard deviation monetary policy tightening or easing shock. The upper panels show the effect of tightening shocks while the lower panels report the effect of easing shocks. The dependent variable is the difference between the log of total capital in period t+h and period t-1. The monetary surprise in quarter t is calculated by adding the monthly monetary policy shocks obtained from Miranda-Agrippino and Ricco (2021). Tightening shocks are positive surprises and easing shocks are negative surprises. We flip the sign of easing shocks, from negative to positive, so that all shocks have positive values. Shaded areas represent the 99 percent confidence intervals of the estimates.
Source: Authors' calculations based on S&P Global, Compustat, Wharton Research Data Services, http://wrds.wharton.upenn.edu/; FRB data.
If external financing conditions respond strongly to contractionary monetary policy when firms are in distress but respond weakly for firms that are not in distress or after a policy easing, as we hypothesize, we should also observe borrowing respond strongly to contractionary monetary policy when firms are in distress but respond weakly for healthy firms or after a policy easing. Our evidence is consistent with this corollary. Figure 4 plots the responses of the change in the log of the real stock of debt.8 After two years, a one standard deviation tightening shock reduces the debt of firms that are in distress by around 6.9 percent, while it reduces the debt of healthy firms by only 2.3 percent, with the estimate for healthy firms also being much less precise statistically. Moreover, the bottom panels of Figure 4 show that the responses of the debt of both healthy and distressed firms are not statistically different from zero. If anything, the point estimates suggest that borrowing by distressed firms surprisingly declines after easing shocks.
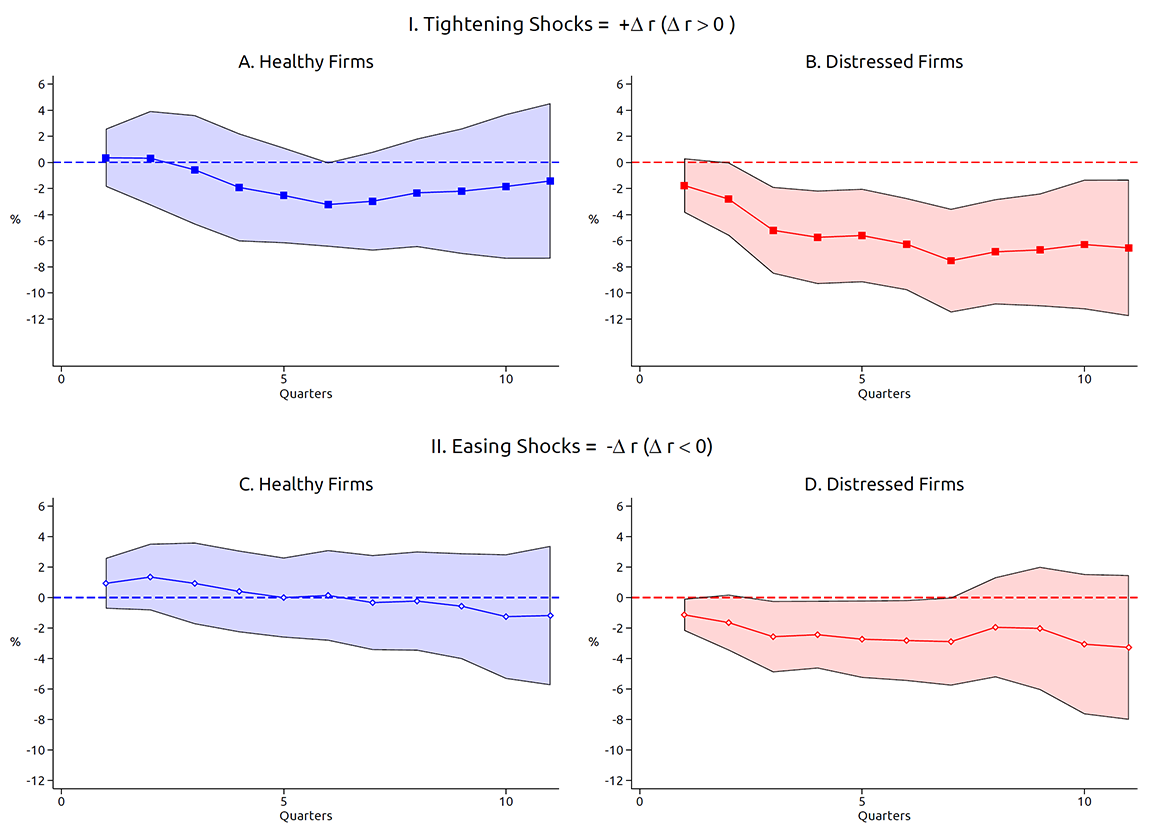
Note: The charts display the estimate of the dynamic response of investment to a one standard deviation monetary policy tightening or easing shock. The upper panels show the effect of tightening shocks while the lower panels report the effect of easing shocks. The dependent variable is the difference between the log of total capital in period t+h and period t-1. The monetary surprise in quarter t is calculated by adding the monthly monetary policy shocks obtained from Miranda-Agrippino and Ricco (2021). Tightening shocks are positive surprises and easing shocks are negative surprises. We flip the sign of easing shocks, from negative to positive, so that all shocks have positive values. Shaded areas represent the 99 percent confidence intervals of the estimates.
Source: Authors' calculations based on S&P Global, Compustat, Wharton Research Data Services, http://wrds.wharton.upenn.edu/; FRB data.
As discussed above, tightening shocks also have, on average for all firms, stronger effects on employment than easing shocks. Figure 5 displays the dynamics of employment separately for distressed and healthy firms in response to monetary policy shocks. As for investment, employment seems unresponsive to accommodative shocks, but contractionary shocks significantly reduce employment for firms that are in distress.9 Our results thus suggest that the transmission of monetary policy—particularly of policy tightening—to both investment and employment is stronger when the share of distressed firms in an economy is higher.
Note: The charts display the estimate of the dynamic response of employment to a one standard deviation monetary policy tightening or easing shock. The upper panels show the effect of tightening shocks while the lower panels report the effect of easing shocks. The dependent variable is the difference between the log of total employment in period t+h and in period t-1. The monetary surprise in quarter t is calculated by adding the monthly monetary policy shocks obtained from Miranda-Agrippino and Ricco (2021). Tightening shocks are positive surprises and easing shocks are negative surprises. We flip the sign of easing shocks, from negative to positive, so that all shocks have positive values. Shaded areas represent the 99 percent confidence intervals of the estimates.
Source: Authors' calculations based on S&P Global, Compustat, Wharton Research Data Services, http://wrds.wharton.upenn.edu/; FRB data.
Conclusions
The evidence in this note carries two important policy implications. First, the strength of the transmission of monetary policy depends on the aggregate distribution of firm financial distress. Second, financial distress is important to explain why the response of investment and employment is stronger after tightening shocks than after easing shocks.
Do our results suggest that the monetary policy tightening engineered since 2022 might have substantial effects on investment and employment given the high share of firms currently in distress relative to previous tightening cycles? While answering this question is difficult, back of the envelope calculations indicate that the effects may be large. To start with, total investment in our sample of publicly-listed firms accounts for about 60 percent of aggregate U.S. investment (Cloyne et al., forthcoming) and aggregate investment is one of the most responsive components of GDP to monetary shocks (Boivin et al., 2010). There is also evidence (Dinlersoz et al., 2018) that employment for Compustat firms accounts for around one-third of total U.S. non-government employment. With the share of distressed firms currently standing at around 37 percent, our estimates suggest that the recent policy tightening is likely to have effects on investment, employment, and aggregate activity that are stronger than in most tightening episodes since the late 1970s. The effects in our analysis peak around 1 or 2 years after the shock, suggesting that these effects might be most noticeable in 2023 and 2024.
References
Anderson, Gareth and Ambrogio Cesa-Bianchi (2020) "Crossing the credit channel: credit spreads and firm heterogeneity", IMF working paper no. 2020/267.
Angrist, Joshua D, Òscar Jordá, and Guido M Kuersteiner (2018) "Semiparametric estimates of monetary policy effects: string theory revisited", Journal of Business & Economic Statistics, 36 (3), pp. 371–387.
Barnichon, Regis, Christian Matthes, Timothy Sablik (2017) "Are the effects of monetary policy asymmetric?", Richmond Fed Economic Brief (March).
Barnichon, Regis, Christian Matthes, and Alexander Ziegenbein (2022) "Are the effects of financial market disruptions big or small?", Review of Economics and Statistics, 104 (3), pp. 557–570.
Boivin, Jean, Michael T Kiley, and Frederic S Mishkin (2010) "How has the monetary transmission mechanism evolved over time?", Handbook of monetary economics, 3, Elsevier, pp. 369–422.
Caglio, Cecilia R, R Matthew Darst, and Sebnem Kalemli-Özcan (2021) "Risk-taking and monetary policy transmission: Evidence from loans to smes and large firms", NBER working paper no. w28685.
Cloyne, James, Clodomiro Ferreira, Maren Froemel, and Paolo Surico (forthcoming) "Monetary policy, corporate finance and investment", Journal of the European Economic Association.
Debortoli, Davide, Mario Forni, Luca Gambetti, and Luca Sala (2020) "Asymmetric effects of monetary policy easing and tightening". CEPR working paper DP15005.
Dinlersoz, Emin, Sebnem Kalemli-Ozcan, Henry Hyatt, and Veronika Penciakova (2018) "Leverage over the life cycle and implications for firm growth and shock responsiveness", NBER working paper no. 25226.
Farre-Mensa, Joan and Alexander Ljungqvist (2016) "Do measures of financial constraints measure financial constraints?", The Review of Financial Studies, 29 (2), pp. 271–308.
Gertler, Mark and Simon Gilchrist (1994) "Monetary policy, business cycles, and the behavior of small manufacturing firms", The Quarterly Journal of Economics, 109 (2), pp. 309–340.
Jarociński, Marek and Peter Karadi (2020) "Deconstructing monetary policy surprises—the role of information shocks", American Economic Journal: Macroeconomics, 12 (2), pp. 1–43.
Jeenas, Priit (2019) "Firm balance sheet liquidity, monetary policy shocks, and investment dynamics", unpublished paper.
Jordá, Òscar (2005) "Estimation and inference of impulse responses by local projections", American Economic Review, 95 (1), pp. 161–182.
Jordá, Òscar, Sanjay R Singh, and Alan M Taylor (2020) "The long-run effects of monetary policy", NBER working paper no. 26666.
Miranda-Agrippino, Silvia and Giovanni Ricco (2021) "The transmission of monetary policy shocks", American Economic Journal: Macroeconomics, 13 (3), pp. 74–107.
Ottonello, Pablo and Thomas Winberry (2020) "Financial heterogeneity and the investment channel of monetary policy", Econometrica, 88 (6), pp. 2473–2502.
Palazzo, Berardino and Ram Yamarthy (2022) "Credit risk and the transmission of interest rate shocks", Journal of Monetary Economics, 130, pp. 120-136.
Perez-Orive, Ander and Yannick Timmer (2023) "The Asymmetric Credit Channel of Monetary Policy", unpublished paper.
Sharpe, Steven A and Gustavo A Suarez (2021) "Why isn't business investment more sensitive to interest rates? evidence from surveys", Management Science, 67 (2), pp. 720–741.
1. We thank Andrea Ajello and Giovanni Favara for very helpful comments and Makena Schwinn for excellent research assistance. Return to text
2. A more detailed empirical and theoretical exploration of the consequences of a high share of distressed firms for the transmission of monetary policy to real economic activity can be found in Perez-Orive and Timmer (2023) (http://papers.yannicktimmer.com/asymmetry.pdf). Return to text
3. An important assumption in the empirical literature on firm financial heterogeneity and monetary policy transmission is model linearity: tightening and easing shocks are assumed to have the same effects in absolute value. This literature finds that borrowing costs, debt flows, and investment of financially constrained firms tend to respond more strongly to monetary policy than those of financially unconstrained firms (Gertler and Gilchrist, 1994; Anderson and Cesa-Bianchi, 2020; Palazzo and Yamarthy, 2022; Cloyne et al., forthcoming; Jeenas, 2019; Caglio et al., 2021). Some recent papers, however, challenge this evidence (Ottonello and Winberry, 2020). Return to text
4. In unreported results, we show that our findings in this note are robust to using net leverage—defined as total debt minus cash holdings over total assets—as an alternative proxy for financial distress. Return to text
5. In unreported results, we find that all the evidence in this note is robust to considering the alternative monetary policy shock measures introduced in Jarociński and Karadi (2020). Return to text
6. One could be concerned that our results are driven by the response of investment opportunities to policy shocks. However, the shocks we use in our regressions are plausibly orthogonal to investment opportunities. Moreover, it is unlikely that investment opportunities for healthy and distressed firms respond differently to policy shocks in a way that explains our results. Return to text
7. This lack of sensitivity of investment to drops in interest rates is consistent with the evidence in Sharpe and Suarez (2021), who use surveys of chief financial officers to show that investment is extremely insensitive to interest rate decreases. Moreover, they also find some degree of asymmetry in the response and show that investment is more responsive to increases in rates. Return to text
8. We measure borrowing with changes in the stock of debt, as opposed to gross issuance of new debt, to account for debt retirements. Ignoring debt retirements could lead to the wrong conclusions. For example, issuance of new debt might fall because of lower incentives to refinance outstanding debt early, ahead of its contractual maturity, when interest rates rise. But in such instances, the total stock of debt has not changed, and firms may simply be postponing their refinancing date without any effect on their total funding through debt. Return to text
9. Our analysis may underestimate the true effects on employment because policy tightenings might push some distressed firms closer to default and contribute to a wave of bankruptcies with associated layoffs. Layoffs caused by firm bankruptcies would not be captured by our data and, for this reason, our estimates on the effects on employment could be considered a lower bound of the magnitude of those effects. Return to text
Perez-Orive, Ander, and Yannick Timmer (2023). "Distressed Firms and the Large Effects of Monetary Policy Tightenings," FEDS Notes. Washington: Board of Governors of the Federal Reserve System, June 23, 2023, https://doi.org/10.17016/2380-7172.3279.
Disclaimer: FEDS Notes are articles in which Board staff offer their own views and present analysis on a range of topics in economics and finance. These articles are shorter and less technically oriented than FEDS Working Papers and IFDP papers.