FEDS Notes
January 09, 2018
Do national account statistics underestimate US real output growth?1
Matteo Barigozzi (London School of Economics)2 and Matteo Luciani
A fundamental issue in economics is the measurement of aggregate real output, henceforth Gross Domestic Output (GDO). Historically, GDO has been measured mainly by the Gross Domestic Product (GDP), but GDP, which tracks all expenditures on final goods and services produced, is just one estimate of GDO. An equally acceptable estimate of the concept of GDO is represented by the Gross Domestic Income (GDI), which tracks all income received by those who produced the output (see Nalewaik, 2010, 2012).
In recent years, there has been interest in combining GDP and GDI to come up with a better estimate of GDO; the rationale for doing so is that the difference between GDP and GDI is exclusively the result of measurement error -- using the National Income and Product Accounts tables definition the "statistical discrepancy" -- as these two statistics are in fact measuring the same thing. Since November 2013, the Philadelphia Fed has released an estimate of GDO, called "GDPplus" proposed by Aruoba et al. (2016), which is defined as the common factor driving the dynamics of GDP and GDI growth. Similarly, since July 2015, the Bureau of Economic Analysis (BEA) has released "the average of GDP and GDI", which the Council of Economic Advisers refers to as GDO (Council of Economic Advisers, 2015).
In this note, we introduce a new estimate of GDO obtained from a Non-Stationary Dynamic Factor model estimated on a large dataset of US macroeconomic indicators. Compared to the approaches of the BEA and the Philadelphia Fed, our estimate of GDO incorporates information coming from a wider spectrum of the economy, and this additional information empirically proves to be non-trivial. Indeed, our estimate of GDO offers a different picture of economic activity: according to our estimate, since 2010 quarterly annualized GDO growth was on average 1/2 of a percentage point higher than estimated by the BEA or the Philadelphia Fed, thus showing a more rapid pace of improvement than measured by national account statistics.
Methodology3
Dynamic Factor models are based on the idea that fluctuations in the economy are due to a few macroeconomic or common shocks, affecting the whole economy, and to sectorial and local shocks, influencing just a part of the economy. Therefore, each variable in a macroeconomic dataset is decomposed into the sum of a macroeconomic or common component, which is driven by the macroeconomic shocks, and an idiosyncratic component, which is driven by both sectorial/local shocks and by measurement error.
Our analysis is based on a Non-Stationary Dynamic Factor model estimated on a large dataset comprising 103 quarterly indicators of U.S. economic activity from 1960:Q1 to 2017:Q1. Broadly speaking, our dataset includes national account statistics, industrial production indexes, various price indexes including CPIs, PPIs, and PCE price indexes, labor market indicators from both the household and establishment surveys, as well as labor cost and compensation indexes, monetary aggregates, credit and loans indicators, housing market indicators, interest rates, the oil price, and the S&P500 index.
Our estimate of GDO is that part of GDP and GDI that is driven by the macroeconomic (common) shocks, i.e., the macroeconomic component. In particular, to estimate GDO we make use of the following two assumptions: first, GDP and GDI respond to macroeconomic shocks in the same way, so that the macroeconomic component of GDP is equal to the macroeconomic component of GDI. And, second, the long run dynamics of GDP and GDI are entirely driven by the macroeconomic shocks, so that both sectorial and local shocks affecting the economy, and measurement error, have just a temporary effect, i.e., the idiosyncratic component of GDP and GDI is stationary.
Compared to the approach of the BEA and the Philadelphia Fed based only on GDP and GDI growth data, there are two advantages in our approach. First, by analyzing a large amount of information, our estimate of GDO incorporates information coming from a wider spectrum of the economy, thus accounting for most sources of common variation, such as monetary policy shocks, oil price shocks, and technology shocks, for example. Second, by using data in levels, we are able to impose that GDP and GDI evolve around a common stochastic trend, and thus we can impose that the discrepancy between these two statistics is only temporary. In other words we are assuming that both GDP and GDI are correct estimators of GDO up to transitory dynamics.
Measuring Gross Domestic Output
Figure 1 shows the 4-quarter percentage change of our proposed estimate of GDO (red line) together with "GDPplus" (blue line) and the "the average of GDP and GDI" released by the BEA (black line). Overall, the three measures are very similar, which is not surprising, as they are attempting to estimate the same quantity. However, two important differences emerge.
4-quarter percentage change
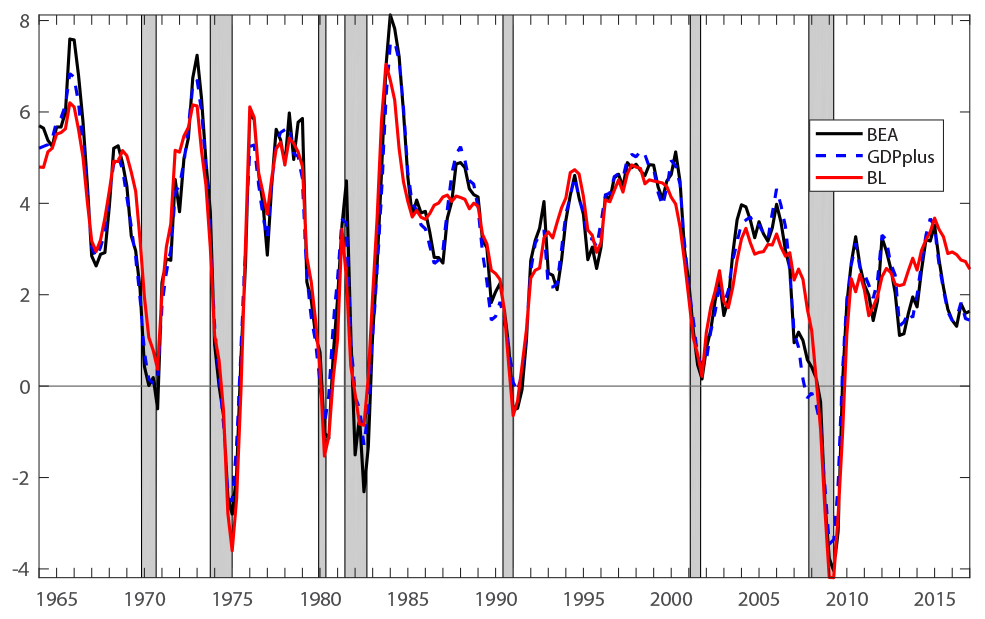
Notes: This figure reports different estimates of GDO. Black line: ``the average of GDP and GDI" released by the BEA; blue dashed line: "GDPplus" released by the Philadelphia Fed; red line: our estimate. Shaded areas indicate recession periods as dated by the National Bureau of Economic Research (NBER).
First, our estimate of GDO does not show any kind of residual seasonality in the last fifteen years, where the term "residual seasonality" refers to the presence of "lingering seasonal effects even after seasonal adjustment processes have been applied to the data" (Moulton and Cowan, 2016). Mainly motivated by the fact that since 2000 GDP growth in Q1 has been on average more than 1 percentage point lower than in the other quarters (top left plot of Figure 2), in recent years there has been lots of discussion on whether US GDP exhibits residual seasonality or not.4 Figure 2 shows average quarterly annualized GDO growth by quarter for our estimate of GDO (SE plot), "GDPplus" (SW plot), and "the average of GDP and GDI" (NE plot). As can be clearly seen, our estimate of GDO exhibits no residual seasonality whatsoever in the last fifteen years.
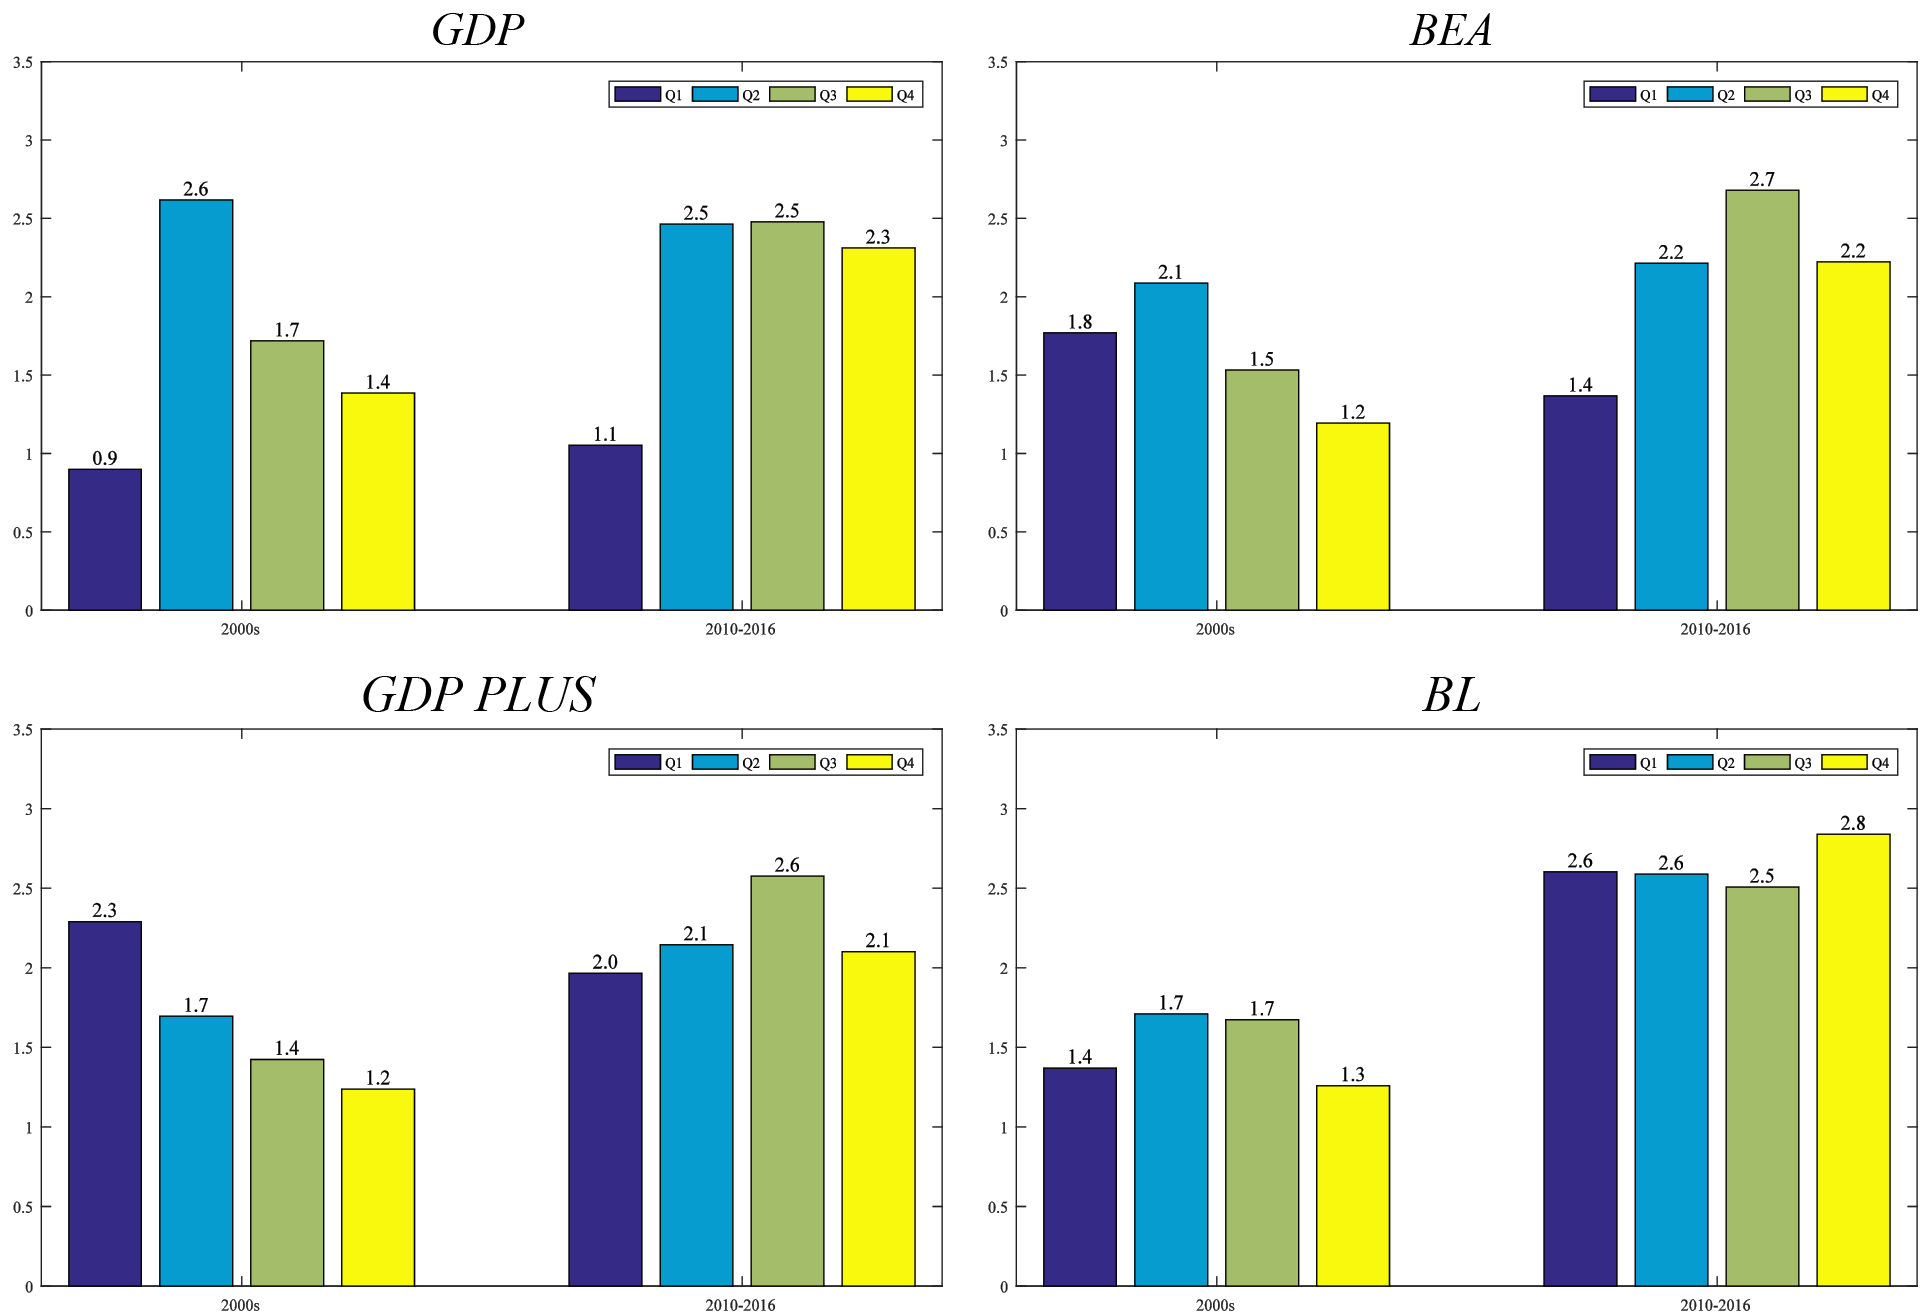
This figure reports average growth at an annual rate by quarter for GDP, "the average of GDP and GDI" released by the BEA, the Philadelphia Fed estimate of GDO (GDPplus), and our estimate of GDO (BL).
Second, our estimate of GDO in the recent years gives a different picture of the economy than the one given by GDP, "GDPplus", and "the average of GDP and GDI" (see Figure 1). According to our estimate, since 2010 quarterly annualized GDO growth was on average 1/2 of a percentage point higher than estimated by the BEA or the Philadelphia Fed, where most of this difference comes from a higher estimate of GDO growth in the first quarter (see Figure 2). Therefore, our results point out that the low level of GDP in Q1 since 2010 is not a matter of shifting growth across quarters, rather it is a matter of missing Q1 growth that is not made up later in the year. In summary, based on the commonality in the data, the US economy grew at a faster pace than measured by national account statistics.
Conclusions
We introduce a new estimate of GDO obtained from a Non-Stationary Approximate Dynamic Factor model estimated on a large dataset of US macroeconomic indicators. We compare our estimate of GDO with "the average of GDP and GDI" released by the Bureau of Economic Analysis, and with "GDPplus" proposed by Aruoba et al. (2016), and released by the Philadelphia Fed. Our results show that these three measures are very similar, as would be expected, since they are attempting to estimate the same thing. However, we estimate that since 2010 quarterly annualized GDO growth was on average 1/2 of a percentage point higher than estimated by the BEA or the Philadelphia Fed, thus pointing out that -- based on the commonality in the data -- the US economy grew at a faster pace than measured by national account statistics.
References
Aruoba, S. B., F. X. Diebold, J. Nalewaik, F. Schorfheide, and D. Song (2016). Improving GDP measurement: A measurement-error perspective. Journal of Econometrics 191, 384-397.
Barigozzi, M. and M. Luciani (2017). Common Factors, Trends, and Cycles, in Large Datasets, FEDS 2017-111, Board of Governors of the Federal Reserve System.
Council of Economic Advisers (2015). A better measure of economic growth: Gross Domestic Output (GDO). CEA Issue Brief.
Fleischman, C. A. and J. M. Roberts (2011). From many series, one cycle: improved estimates of the business cycle from a multivariate unobserved components model. FEDS 2011-046, Board of Governors of the Federal Reserve System.
Gilbert, C., N. Morin, A. D. Paciorek, and C. R. Sahm (2015). Residual seasonality in GDP. FEDS Notes 2015-05-14, Board of Governors of the Federal Reserve System.
Lengermann, P., N. Morin, A. D. Paciorek, E. Pinto, and C. R. Sahm (2017). Another look at residual seasonality in GDP. FEDS Notes 2017-07-28, Board of Governors of the Federal Reserve System.
Lunsford, K. G. (2017). Lingering residual seasonality in GDP growth. Economic Commentary 2017-06, Federal Reserve Bank of Cleveland.
Moulton, B. R. and B. D. Cowan (2016). Residual seasonality in GDP and GDI: Findings and next steps. Survey of Current Business 96, 1-6.
Nalewaik, J. J. (2010). The income- and expenditure-side measures of output growth. Brookings Papers on Economic Activity 1, 71-106.
Nalewaik, J. J. (2012). Estimating probabilities of recession in real time using GDP and GDI. Journal of Money Credit and Banking 44, 235-253.
Rudebusch, G. D., D. Wilson, and T. Mahedy (2015). The puzzle of weak first-quarter growth. Economic Letter 2015-16, Federal Reserve Bank of San Francisco.
1. This note presents results contained in Barigozzi, Matteo, and Matteo Luciani (2017). "Common Factors, Trends, and Cycles, in Large Datasets," Finance and Economics Discussion Series 2017-111. Washington: Board of Governors of the Federal Reserve System, https://doi.org/10.17016/FEDS.2017.111. The views presented in the note are the authors and do not necessarily reflect those of the Federal Reserve Board or its staff Return to text
2. London School of Economics and Political Science, Department of Statistics. Return to text
3. This section provides a non-technical presentation of the methodology used to estimate GDO. We refer the interested reader to Barigozzi and Luciani (2017) for technical details, as well as for the list of variables used in the analysis. Return to text
4. The profession is not in agreement on this issue, as some authors (e.g. Gilbert et al., 2015; Lengermann et al., 2017) conclude that US GDP does not exhibit residual seasonality, while others (e.g. Rudebusch et al., 2015; Lunsford, 2017) find evidence of residual seasonality -- see Moulton and Cowan (2016) for a technical discussion on causes and remedies for residual seasonality in US GDP. Return to text
Barigozzi, Matteo, and Matteo Luciani (2018). "Do national account statistics underestimate US real output growth?," FEDS Notes. Washington: Board of Governors of the Federal Reserve System, January 9, 2018, https://doi.org/10.17016/2380-7172.2116.
Disclaimer: FEDS Notes are articles in which Board staff offer their own views and present analysis on a range of topics in economics and finance. These articles are shorter and less technically oriented than FEDS Working Papers and IFDP papers.