FEDS Notes
February 22, 2022
Drivers of Bank Supply of Business Loans
Andrew Castro, David Glancy, and Felicia Ionescu1
I. Introduction
Numerous studies show that tightening loan supply may significantly affect credit outcomes, including declines in total lending capacity and changes in loan terms (see for example, Bassett et al. (2014), Castro et al. (2022), Lown and Morgan (2006)). Moreover, research has linked these supply-driven declines in credit to negative effects on economic outcomes, including employment or output (see Alfaro et al. (2021) or Herheknhoff (2019)).
Therefore, understanding the factors that contribute to changes in loan supply may be important for identifying potential vulnerabilities that might threaten credit availability and limit economic activity. To the extent that tightening credit supply has negative repercussions on borrowers, it is useful to know what events are likely to lead to tightening episodes.
In this note we investigate what drives banks to limit credit supply, focusing on commercial and industrial (C&I) loans. To answer this key question, we use a rich data set on banks' willingness to extend credit, as provided by banks' self-reported changes in C&I loan terms and standards. We merge this data set with aggregate bank balance sheet data, and detailed loan-level data that contain information about borrowers, including credit risk and economic performance. We use this merged data to assess how trends in loan portfolios differ for banks that change credit supply relative to other banks that do not.
Our findings demonstrate that banks' supply decisions are mostly driven by risk considerations: banks tighten supply during periods of worsening loan performance, following a deterioration in the average assessed creditworthiness of their borrowers. Meanwhile, competitive factors appear to play a modest role: banks will ease supply to compensate for weak loan growth, but not tighten in the face of strong growth.
II. Data and Methodology
We measure the supply of C&I credit using banks' responses to questions from the Federal Reserve's Senior Loan Officer Opinion Survey (SLOOS).2 Specifically, we construct a summary index at the bank-quarter level using banks' self-reported changes in C&I loan terms or standards. Measuring credit supply using SLOOS data is not straightforward as supply represents a multidimensional concept, encapsulating numerous decisions, for example, who gets credit, how much, and at what terms. We therefore follow the methodology in Castro et al. (2022) and use the first principal component of a set of variables measuring the reported net tightening in standards and various terms for C&I loans. We then document what predicts changes in this tightening index, focusing on factors related to credit risk and competition.
Our focus on credit risk and competition is motivated by banks' self-reported reasons for changing C&I loan standards or terms in the SLOOS, plotted in Figure 1. As to what motivates changes in credit supply, banks frequently cite a series of reasons related to risk factors, including risk tolerance, defaults, and changes in the favorability of the economic outlook. The other frequently cited reason for changing terms or standards is changes in competition from other lenders. The responses are asymmetric across tightening and easing, with banks more likely to cite competitive factors as motivating easing and more likely to cite risk-related factors as motivating tightening.
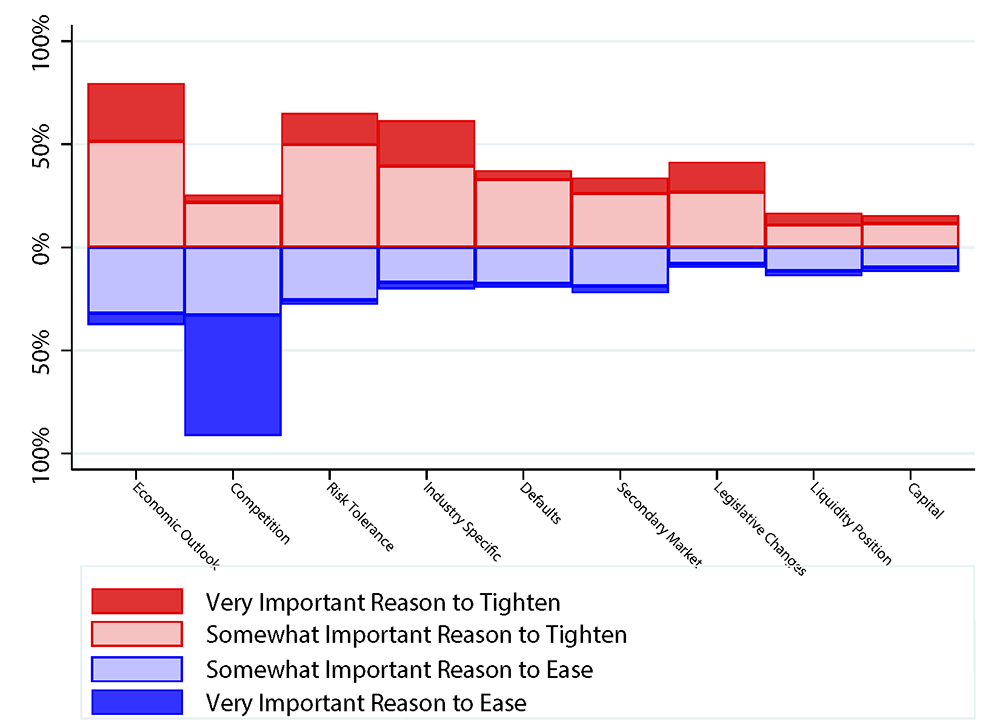
Note: This figure plots banks' self reported reasons for changing terms or standards. The height of the bars above the x-axis shows the share of banks tightening terms or standards that cite a particular reason as important. The bars below the axis show the shares citing a reason as an important reason for easing. The dark portion of bars shows the share of banks citing a reason as "very important". Data covers the period from 1995 to 2019 where available, with a shorter time horizon for some questions that were added to the survey later. Key identifies bar segments in the order of top to bottom.
Source: SLOOS.
Indeed, we expect banks to tighten credit supply in the face of increased (anticipated or realized) credit risk, for example rising C&I loan charge-offs, default expectations, or nonperforming loan rates. Additionally, if banks face weak competition from other bank or nonbank lenders, we expect them to tighten standards. For example, rapid loan growth may signal that banks can afford to be more selective and still maintain desired levels of lending. Quite the opposite, if particularly intense competition from other lenders causes banks to lose market share, we would expect them to ease standards to try and stimulate more lending.
We delve deeper into these issues and test these hypothesis using measures of risk and competition in the C&I loan market from two datasets: (1) bank balance sheet data from the Call Reports and (2) loan-level data from Y-14Q, the data underlying the stress tests of the largest U.S. banks.3 Regarding risk, we use the Call Reports to measure loan performance (charge-off rates or nonperforming loan rates) and Y-14Q to measure the financial health of borrowers (the commitment weighted average estimated probability of default or sales growth over the previous year for the borrowers in a bank's C&I portfolio).4 For our analysis on the competition channel, we study the growth in C&I balances or originations (relative to other banks) as reflecting the competitive environment banks face.
We take two approaches to investigate what factors motivate banks to tighten C&I loan supply. First, we estimate the following equations to trace out differences in trends in loan risk or lending volumes for banks that tighten supply relative to non-tightening banks:
$$$$ y_{b,t+h}-y_{b,t}=\beta^{h} \text{Tightening Index}_{b,t}+\gamma^{h} \text{Demand}_{b,t} +\tau^{h}_t+\epsilon^{h}_{b,t}, \ \ h\in \{-6,…,6\} $$$$
where the dependent variable is the change in some bank outcome such as the charge-off rate or growth in C&I balances for bank $$b$$ in quarter $$t$$ over the time horizon $$h$$. $$\text{Tightening Index}_{b,t}$$ is the first principal component for the set of term-specific net tightening variables, normalized to have unit variance. $$\text{Demand}_{b,t}$$ is a trinary variable measuring net change in C&I loan demand (-1 for weaker, 0 for unchanged, 1 for stronger), and $$\tau_t$$ is a quarter fixed effect.
The set of regression coefficients from this exercise traces out trends in the dependent variable before and after a bank tightens supply relative to another bank in the same quarter where supply was unchanged. For example, if banks tighten supply in response to a deterioration in loan performance, performance would, on average, deteriorate in the quarters before banks tighten supply. If banks tighten in anticipation of a worsening in performance, we expect to see performance deteriorate after banks tighten.
Our second approach directly estimates the effects of recent balance sheet developments on supply decisions by regressing the tightening index on variables reflecting balance sheet developments over the previous year:
$$$$ \text{Tightening Index}_{b,t} = \beta_1 \text{Charge-offs(All)}_{t-4,t} + \beta_2 \text{Charge-offs(C&I)}_{t-4,t} + \beta_3 \Delta ln(\text{C&I})_{t-5,t-1} + \tau_t + \varepsilon_{b,t} $$$$
In this second approach, the dependent variable is the tightening index. The independent variables are cumulative charge-offs rates over the previous year (for either all loans or for just C&I loans), and C&I loan growth in the four quarters before the survey quarter.5
III. What Drives Changes in Bank Supply of C&I Loans
We first document what trends in banks' portfolios predict future changes in the supply of business credit, studying both the credit risk and the competition channel.
Credit risk and C&I loan supply
Focusing first on the relationship between credit risk and changes in loan supply, Figure 2 reports trends in the nonperforming loan rate (top panel) and net charge-off rate (bottom panel) for C&I loans around a one standard deviation tightening in C&I loan supply. As illustrated, both nonperforming loan rates and charge-off rates for C&I loans show an increasing trend after tightening episodes, indicating that banks tighten supply in anticipation of worsening in loan performance.
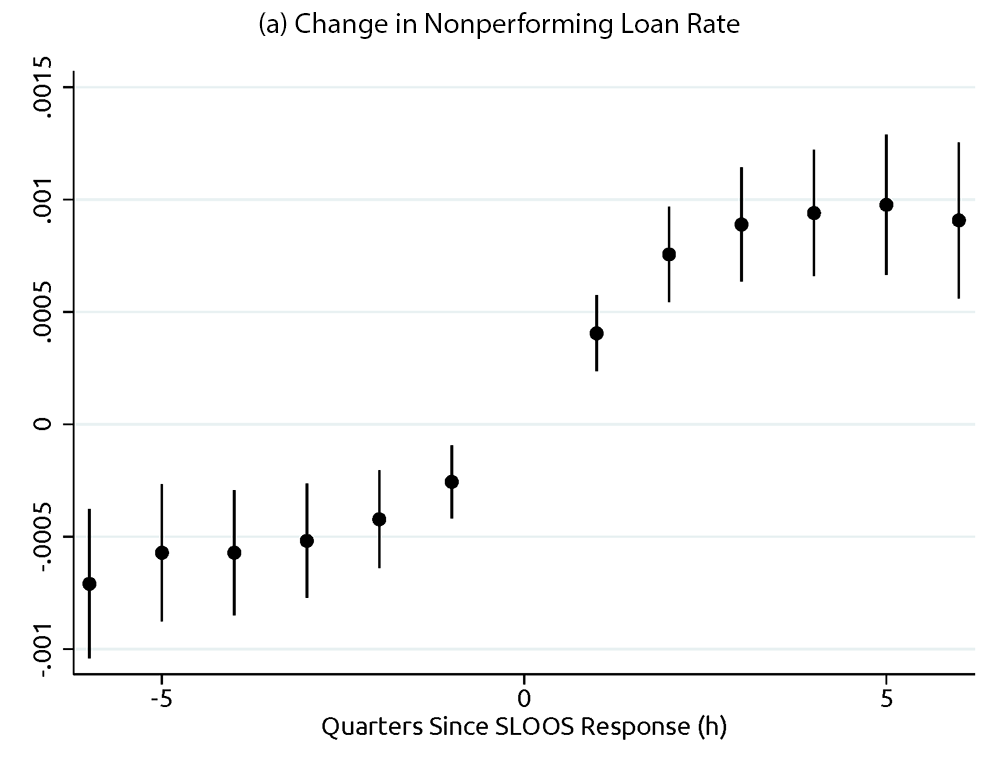
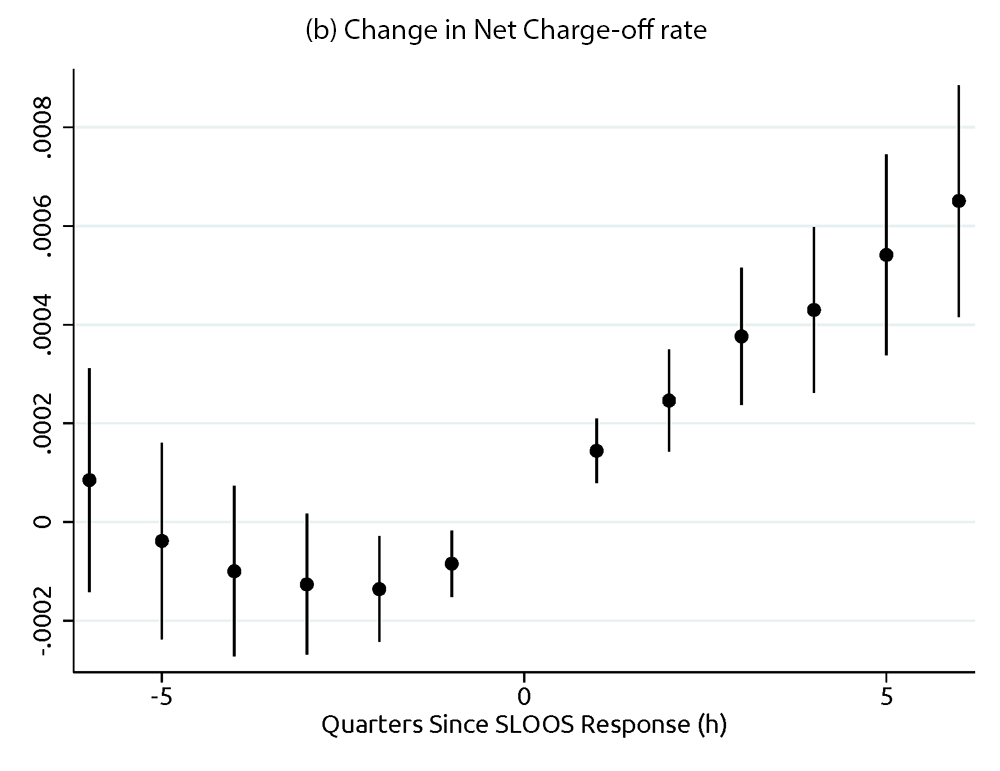
Note: This figure plots the regression coefficients from: $$y_{b,t+h}-y_{b,t}=\beta^{h} \text{Tightening Index}_{b,t}+\gamma^{h} \text{Demand}_{b,t} +\tau^{h}_t+\epsilon^{h}_{b,t}$$ by time horizon $$h$$. Each figure plots estimates and 90% confidence intervals for $$\{\beta^{h}\}$$, where $$y$$ is either the nonperforming loan rate (top) or net charge-off rate (bottom) for C&I loans. The sample covers the period from 1990 to 2019.
Source: Call Reports, SLOOS.
Figure 3 uses loan-level data on banks' C&I portfolios to demonstrate that borrowers' conditions deteriorate prior to a contraction in credit supply. Before tightening, banks experience increases in the average estimated probability of default for their C&I portfolio (top panel) and a decline in the average sales growth for their borrowers (bottom panel). Overall, these results indicate that banks' supply decisions respond to forward-looking indicators of loan performance. Banks tighten when borrowers' conditions deteriorate, possibly insulating banks from the effects of the upcoming worsening in loan performance.
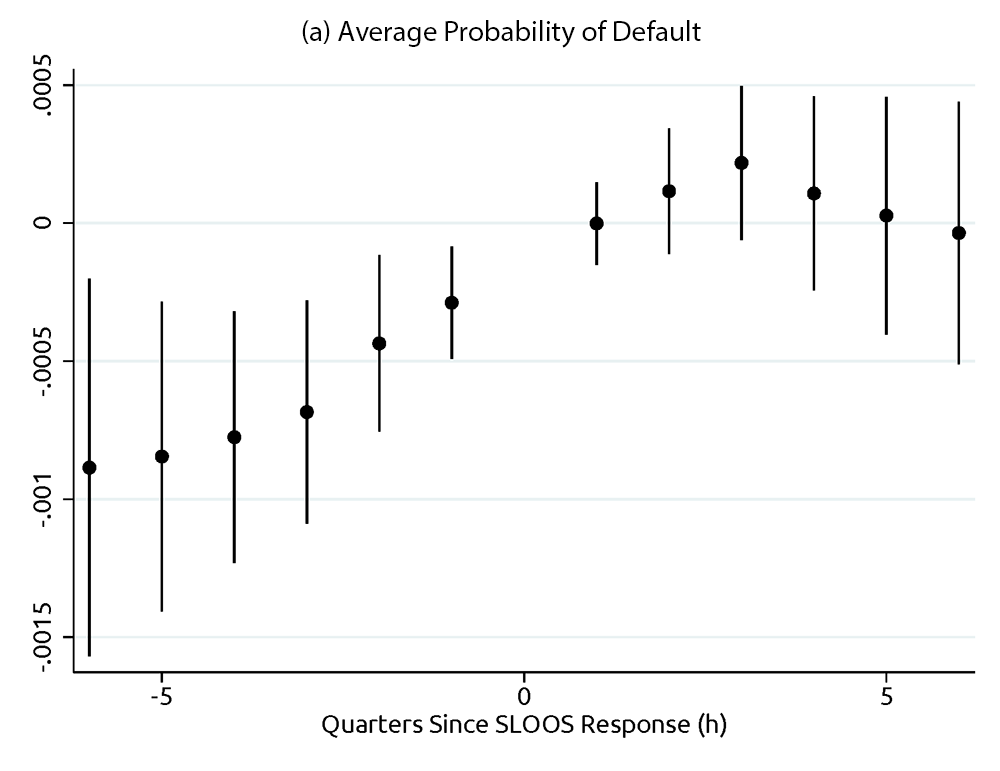
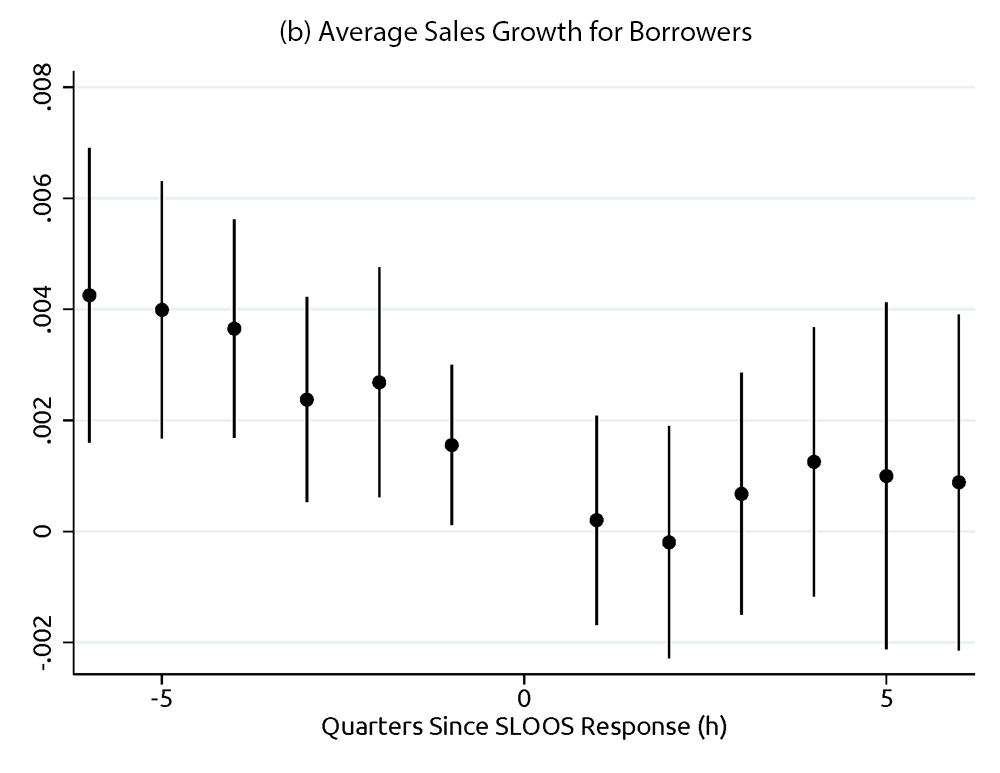
Note: This figure plots the regression coefficients from: $$y_{b,t+h}-y_{b,t}=\beta^{h} \text{Tightening Index}_{b,t}+\gamma^{h} \text{Demand}_{b,t} +\tau^{h}_t+\epsilon^{h}_{b,t}$$ by time horizon $$h$$. Each figure plots estimates and 90% confidence intervals for $$\{\beta^{h}\}$$, where $$y$$ is the commitment-weighted average for either the estimated probability of default (top) or annual sales growth for borrowers (bottom). The sample includes Y-14 banks for the years from 2012 to 2019.
Source: Y-14Q, SLOOS.
Competition and C&I loan supply
As discussed, if competition from other lenders affects supply conditions, we would expect to see rising balances or originations before banks tighten. In what follows we test this hypothesis and discuss our findings.
Figure 4 plots trends in C&I loan balances (top panel) and originations (bottom panel) surrounding a one standard deviation tightening in credit supply. Expansions in a bank's C&I loan portfolio do not seem to precipitate significant changes in supply. The relatively flat lines leading up to the survey quarter indicate that trends for C&I loan growth and C&I origination volumes are about the same for banks that report tightening supply conditions as for banks that report leaving them unchanged. However, loan originations do drop in the quarter after a tightening in supply occurs, and C&I balances trend down over the following year and a half after tightening. These results indicate that supply conditions affect lending, as discussed in more detail in Castro et al. (2022), however recent growth does not appear to be a primary driver of decisions to tighten C&I loan supply.
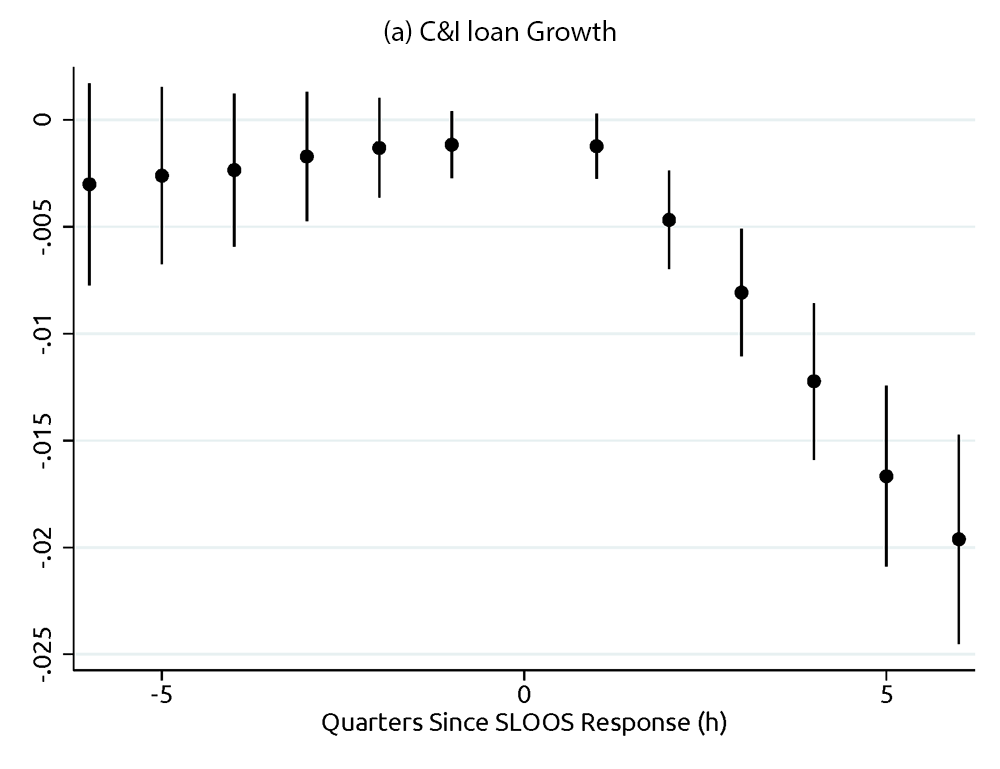
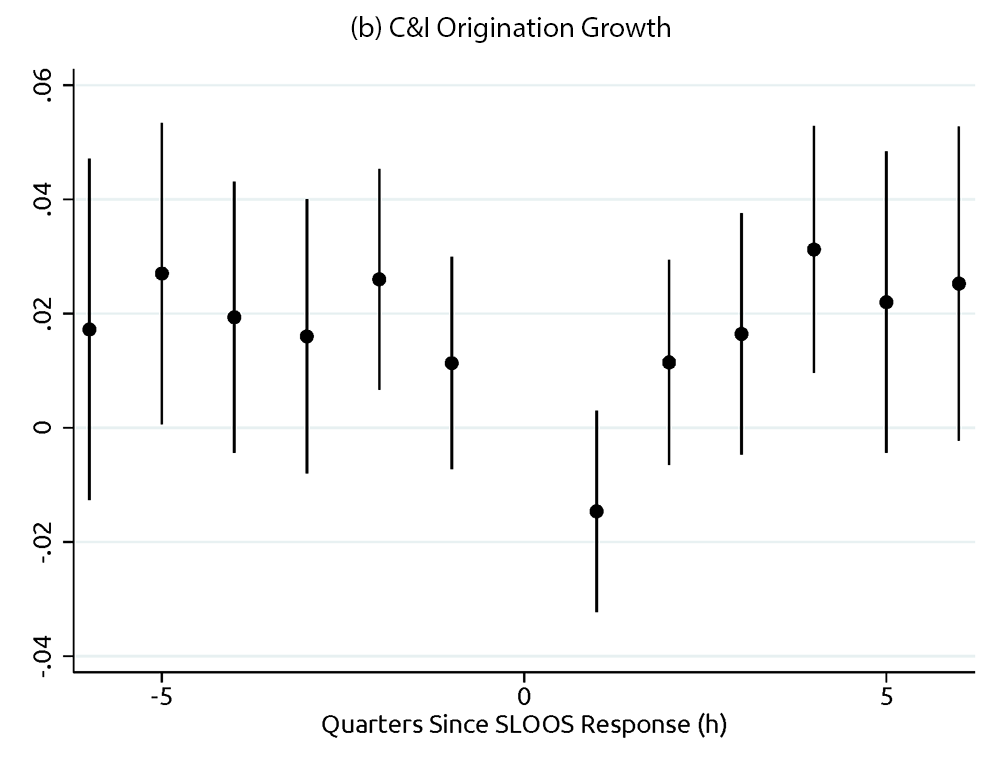
Note: This figure plots the regression coefficients from: $$y_{b,t+h}-y_{b,t}=\beta^{h} \text{Tightening Index}_{b,t}+\gamma^{h} \text{Demand}_{b,t} +\tau^{h}_t+\epsilon^{h}_{b,t}$$ by time horizon $$h$$. Each figure plots estimates and 90% confidence intervals for $$\{\beta^{h}\}$$, where $$y$$ is the natural logarithm of either C&I loan balances (top) or quarterly new C&I loan commitments (bottom). The sample covers the period from 1990 to 2019 in the top panel, and from 2012 to 2019 in the bottom panel.
Source: Call Reports, Y-14Q, SLOOS.
One reason for the weak evidence for the competition channel may be that competitive pressures have asymmetric effects on tightening and easing, something not measured well by the single index of how much banks are tightening on net.6 Indeed, banks' self-reported reasons for changing supply suggest that competition has asymmetric effects: strong competition motivates easing, but weak competition rarely motivates tightening (Figure 1). Figure 5 repeats the previous analysis but using two supply measures: one giving the tightening index if it is positive, and other giving the tightening index if it is negative. The coefficient on each index reflects the marginal effects of tightening when banks are tightening or easing overall.
Our findings indicate that banks do experience declines in loan volumes prior to easing, consistent with strong competition motivating easing supply conditions. The rising green dots pre-easing in Figure 5 indicate balances rising for banks that ease less, or alternatively put, balances falling for banks that ease more. However, banks that tighten supply are on similar trends as banks that report supply as remaining about unchanged, as shown by the flat red dots pre-tightening. Furthermore, tightening matters more for subsequent growth, with balances falling after tightening occurs, but rising very little after easing.7
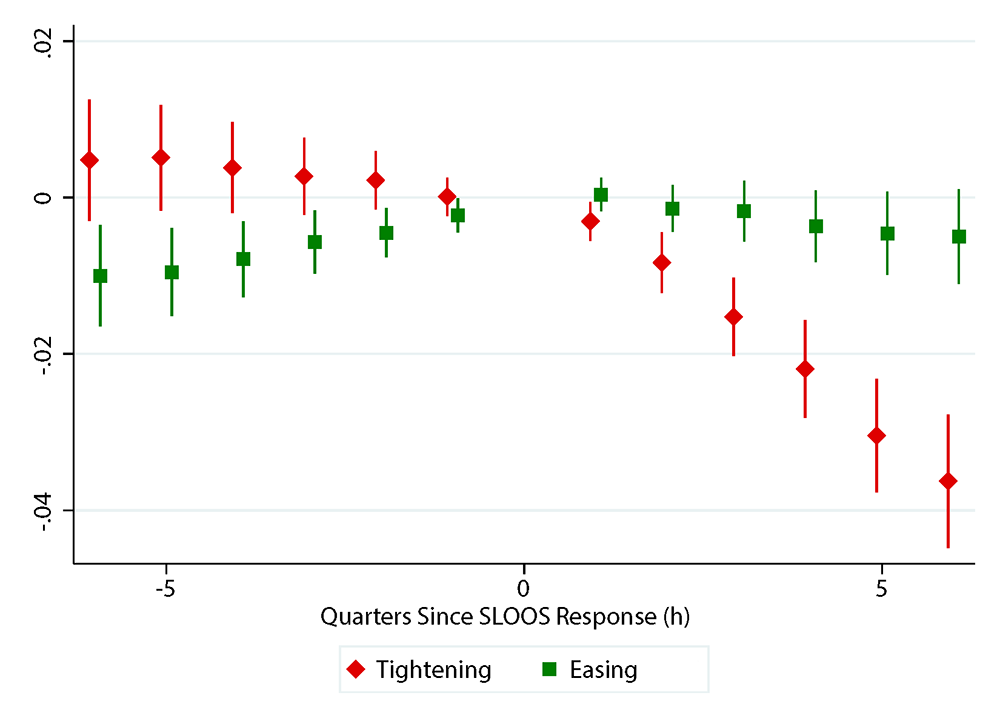
Note: This figure plots the regression coefficients from:
$$$$ln(\text{C&I Loans})_{b,t+h}-ln(\text{C&I Loans})_{b,t} = \\ \beta_T^{h} \text{Tightening Index}^+_{b,t}+\beta_E^{h} \text{Tightening Index}^-_{b,t} + \gamma^{h} \text{Demand}_{b,t} +\tau^{h}_t+\epsilon^{h}_{b,t}$$$$
by time horizon $$h$$. The figure plots estimates and 90% confidence intervals for $$\{\beta_T^{h}\}$$ (red diamonds) and $$\{\beta_E^{h}\}$$ (green squares) . $$\text{Tightening Index}^+_{b,t}=\max\{\text{Tightening Index}_{b,t},0\}$$ and $$\text{Tightening Index}^-_{b,t}=\min\{\text{Tightening Index}_{b,t},0\}$$. The sample covers the period from 1990 to 2019.
Source: Call Reports, SLOOS.
Predictors of C&I loan supply
The results so far have studied the drivers of supply decisions somewhat indirectly, plotting trends in various bank balance sheet variables surrounding a supply decision. In this section, we directly estimate how recent balance sheet developments predict supply decisions. Table 1 presents the results of regressing the C&I tightening index on charge-off rates (for both C&I loans and the entire loan portfolio) and on C&I loan growth over the previous year.8
Table 1: What Predicts Changes in Standards
| (1) | (2) | |
|---|---|---|
| Charge-offs (All) | 2.92 | -0.6 |
| (2.24) | (2.09) | |
| Charge-offs (C&I) | 23.47** | 5.65** |
| (2.09) | (1.74) | |
| Δln(C&I) | 0.62** | 0.15+ |
| (0.09) | (0.08) | |
| Qtr FE | X | |
| Banks | 181 | 181 |
| Obs. | 7077 | 7077 |
Column 1, which omits quarter fixed effects, shows that both recent C&I charge-offs and recent C&I growth are predictive of changes in supply. Banks tighten C&I loan supply following years with high C&I loan charge-offs or rapid C&I loan growth, consistent with banks responding both to credit risk assessments and competitive pressures. The performance of a bank's broader loan portfolio, however, does not affect the supply of C&I loans.
The specification in column 2 adds quarter fixed effects, and thus identifies the effects of changes in balance sheet variables relative to other banks over the same time period. The findings are qualitatively similar; however, the magnitude of the effects is diminished when the fixed effects are included. In this specification, a one standard deviation increase in the C&I loan charge-off rate (1 percentage point) results in a 0.06 standard deviation increases the tightening index, while a one standard deviation increase in loan growth (19 percentage points) raises the tightening index by only about 0.03 standard deviations. These effects are about four times larger when fixed effects are excluded, indicating that macroeconomic conditions are an important driver of both supply decisions and lending outcomes. However, the fact that recent loan performance is still predictive of tightening supply in the presence of the time fixed effects demonstrates that macroeconomic conditions only partially explain changes in credit supply; banks also tighten supply in response to an idiosyncratic deterioration in their own portfolio.
Conclusion
To summarize, our study makes advances in the understanding of the interaction between credit volume, credit risk and economic outcomes by providing a systematic way of studying credit supply and shedding light on the factors affecting the supply of loans for businesses. Our results indicate that banks' decisions to change C&I loan supply respond most to changes in the anticipated performance of their C&I portfolio, suggesting that C&I underwriting reflects risk in the C&I segments the banks lend to. Banks are more likely to tighten C&I supply in anticipation of deteriorating C&I loan performance or amidst worsening conditions for their borrowers (as reflected in internal risk ratings or recent sales growth). Meanwhile, competition in the market for C&I loans has a weaker influence on banks' supply decisions, though there is some evidence of banks easing in response to strong competition. Finally, while macroeconomic conditions appear to be a notable driver of both loan outcomes and bank supply decisions, it only partially explains changes in credit supply. When including time fixed effects in our analysis, we still find a significant relationship between loan performance and supply decisions.
Our findings are consistent with the relationship-oriented nature of C&I lending. Banks tend to specialize in particular segments of the market, so it is not surprising that they would respond to stresses within those segments and tighten in response to adverse developments in their own C&I portfolio (as opposed to merely responding to macroeconomic developments or trouble in their overall loan portfolio). Likewise, relationship lending can explain the asymmetric role of competitive factors; non-relationship lenders are more viable competition in good times (when banks are easing), and thus it should be at these times that banks feel pressure to ease more to preserve market shares, a result consistent with the literature (see for example, Bolton et al., 2016).
References
Alfaro, Laura, Manuel Garcia-Santana, and Enrique Moral-Benito, 2021. "On the direct and indirect real effects of credit supply shocks." Journal of Financial Economics, 139-3: 895-921.
Bassett, William F., Mary Beth Chosak, John C. Driscoll, and Egon Zakrajsek. 2014. "Changes in Bank Lending Standards and the Macroeconomy." Journal of Monetary Economics 62: 23–40.
Bolton, Patrick, Xavier Freixas, Leonardo Gambacorta, and Paolo Emilio Mistrulli. 2016. "Relationship and Transaction Lending in a Crisis." Review of Financial Studies 29: 2643–2676.
Castro, Andrew, David Glancy, Felicia Ionescu, and Gregory Marchal. 2022. "What Happens When Banks Tighten C&I Loan Supply?." FEDS Notes. Washington: Board of Governors of the Federal Reserve System, February, 2022, https://doi.org/10.17016/2380-7172.3058.
Herkenhoff, Kyle. 2019. "The Impact of Consumer Credit Access on Unemployment." The Review of Economic Studies, Volume, 86, Issue 6, 2019, pages 2605-2642.
Lown, Cara, and Donald P. Morgan. 2006. "The Credit Cycle and the Business Cycle: New Findings Using the Loan Officer Opinion Survey." Journal of Money, Credit & Banking (Ohio State University Press) 38: 1575–1597.
1. Andrew Castro, David Glancy, and Felicia Ionescu are in the Division of Monetary Affairs at the Federal Reserve Board of Governors. This note reflects the views of the authors and should not be interpreted as reflecting the views of the Board of Governors of the Federal Reserve System. Return to text
2. The Senior Loan Officer Opinion Survey on Bank Lending Practices is a quarterly survey of banks which inquires about changes in supply or demand for various categories of loans. A typical survey has about 70 banks responding, accounting for about 70% of assets of domestically chartered institutions. The questions analyzed in this note date back to 1990, when the survey in its modern form began. Return to text
3. The Call Reports provide quarterly information on the balance sheets of the full universe of US banks and includes a wealth of information on (among other things) banks' loan portfolios and loan performance. Data from the Y-14 is available starting in 2011 and covers loan commitments over $1 million from banks with over $50 billion in consolidated assets ($100 billion starting in 2018). However, the data contains detailed loan level information on loan terms and borrower characteristics. Return to text
4. For advanced approaches banks, the probability of default is the parameter estimated by the bank for use for their "internal ratings-based" approach capital requirements. For other banks, probability of default is the default probability associated with the banks' internal risk rating for the loan obligor. Return to text
5. The time horizon differs as we'd expect a change in supply to cause changes in balances in the same quarter, whereas contemporaneous loan performance would reflect underwriting decisions in the past. For this reason, we include charge-offs at t in the regression, but only consider loan growth through the previous quarter. Return to text
6. Recall, the tightening index is constructed from a set of variables measuring the net tightening in various loan terms (i.e., 1 if tighter, 0 if unchanged, -1 if easier). This methodology thus imposes that the predicted effects of tightening are equal and opposite to the effects of easing. Return to text
7. We run similar analysis for nonperforming loan rates and find no evidence of asymmetry for the risk channel: nonperforming loan rates rise around a tightening in standards and fall around an easing in standards. Return to text
8. We restrict our attention to these variables so we can study the full period from 1990 to 2019 for a larger set of banks instead of restricting the sample to bank-quarters with Y-14 reporting. Return to text
Castro, Andrew, David Glancy, and Felicia Ionescu (2022). "Drivers of Bank Supply of Business Loans," FEDS Notes. Washington: Board of Governors of the Federal Reserve System, February 22, 2022, https://doi.org/10.17016/2380-7172.3059.
Disclaimer: FEDS Notes are articles in which Board staff offer their own views and present analysis on a range of topics in economics and finance. These articles are shorter and less technically oriented than FEDS Working Papers and IFDP papers.