FEDS Notes
December 21, 2018
Education Debt Owed by Older Families in the 2016 Survey of Consumer Finances
Jesse Bricker, Alice Volz, and Elizabeth Llanes
The amount of education debt held by U.S. families has increased dramatically over the past fifteen years. New data from the triennial Survey of Consumer Finances (SCF) shows a continued growth in education debt over the past three years.1 Between the 2013 and 2016 surveys, aggregate education debt increased 36 percent to $964.3 billion, and increased by more than 400 percent since the 2001 survey.2 Because recent college attendees carry much higher debt balances than students in the past, the impact of education debt on young families' economic outcomes is often noted as a concern (Dettling and Hsu, 2014; Mezza, Ringo, Sherlund, and Sommer, 2016).
The largest increase over this time is, surprisingly, balances owed by older families. Now, much of the education debt in the SCF currently resides in households headed by person 40 years or older. These families are the focus of this note. Such families owe education debt from their own educational endeavors and may also have borrowed to finance the education of a child. Additionally, in the SCF, some of this debt is owed by a financially dependent adult child that resides in the parent's household. We first provide an overview of education debt in the SCF, and then focus on the circumstances of education debt owed by older families. We look at vintage of debt, degree completion, and financial fragility of older households with education debt.
I. Education debt owed by age of household head
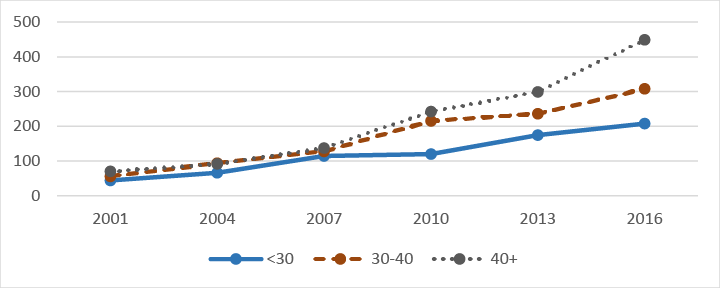
When classifying families by age of the head of household, the SCF data show that the growth in education debt is spread across the age distribution (Figure 1). In the 2016 SCF, for example, families with a head aged 40 or older owed about $449 billion dollars in education loans--nearly half of all outstanding education debt balances in the SCF. Micro data at the borrower-level, from other data sources, also show a similar growth in aggregate balances and in and concentration for older borrowers.3 Because the SCF is a household measure, the SCF data show a bit more concentration for older age groups. Household structure is the reason for this higher concentration. In the SCF, if an adult child lives in the home of their parent--and is financially dependent on that parent--the child's education debt will be counted in the parent's household. New questions in the 2016 SCF, though, help us understand more about these situations.
The SCF questionnaire has always collected detailed information on up to six education loans owed by the family. Beginning in 2016, though, the questionnaire also collects information on whose education each of the loans was taken out for: the head of household, the spouse, or a child.4 Based on responses to this question, about 2/3rds of the debt owed by households with a head aged 40 or older--about 300 billion dollars--was used to finance higher education for either the head or the spouse (table 1). The next section describes the characteristics of these loans and the financial situation of these households.
Table 1: Education debt owed in 2016 SCF, by age of household head and purpose of loan
| Age of hhd. head | Total owed | Of total, amount owed to… | unknown owner | |
|---|---|---|---|---|
| finance own education | finance child's education - parent debt | |||
| 40 or older | 449 billion | 300 billion | 57 billion | 90 billion |
| 30 to 39 | 308 billion | 306 billion | 1 billion | 1 billion |
| Younger than 30 | 208 billion | 208 billion | 0 | |
| Total | 964 billion | 813 billion | 58 billion | 91 billion |
Note: All dollars in $2016. Debt to finance own education are loans taken out either for the respondent or their spouse, if present. Sums may not add up to totals due to rounding. Additionally, 1 billion of the 449 billion owed by families 40 or older was collected in a mop-up question, and cannot be allocated across columns.
Source: 2016 SCF.
II. Education Debt held in older families taken out for own education
Rising aggregate debt balances owed by older families may be (1) because past loans are not being paid down--which is possible with default, or deferment--or (2) because loans are not being paid down quickly--which is possible with extended loan terms--or (3) because these families are taking out new loans for human capital investments. The SCF data suggest that all are happening.
Of the $300 billion owed on debt to finance their own education from table 1, about 17 percent was taken out for a program that was last attended 15 or more years ago (Table 2).5 About 40 percent of the debt balances were taken out for programs last attended in the past five years, suggesting that older households are also continuing to finance human capital accumulation, even well outside traditional school-going ages. About 22 percent of this debt is in deferment--either through loan forbearance or through a loan forgiveness program--and another 7 percent is not being repaid because the family cannot afford to make payments--a situation that we will denote as "near default."
Table 2: Percent of own education debt owed in 2016 SCF, by number of years since last attendance
| Age of hhd. head | Years since last attendance | Share in deferment | Share near default | Memo: | |||
|---|---|---|---|---|---|---|---|
| less than 5 | 5 to 10 | 10 to 15 | 15 or more | Pct. with own education debt | |||
| 40 or older | 40 | 25 | 19 | 17 | 22 | 7 | 10 |
| Total (all ages) | 57 | 24 | 12 | 7 | 21 | 8 | 19 |
Note: Percent of total education debt owed to finance own education, by number of years since last attendance.
Source: 2016 SCF.
Large increases in enrollment have occurred over the past two decades, and, while education is a positive investment if it results in an increase in wages, generally speaking, taking on debt that does not result in a completed degree may not be optimal. Unsurprisingly, education debt used to finance a completed degree is associated with a much smaller increase in wages than the same debt if it was used to finance a degree program that was never completed (Looney and Greenstone, 2013). As more human capital investments are financed by debt, then, financing college attendance but never completing a college degree is emerging as a risk facing households (Goodman and Henriques, 2016).6 With this in mind, the SCF questionnaire now asks if the educational program associated with each loan was completed. Among families with a head of household aged 40 or older, the bulk of debt used to finance their own education has been used to finance a completed (72 percent) or an ongoing (11 percent) degree program (not shown).7 The remaining 17 percent of education debt owed by these families was used to fund an educational program that was never completed.
Table 3: Education loans owed for own education, by completion status
| Age of head of household | Owed for own education | Percent of total owed for degree… | ||
|---|---|---|---|---|
| …completed… | …currently enrolled… | …never completed… | ||
| 40 or older | 300 billion | 72 percent | 11 percent | 17 percent |
| Total (all ages) | 813 billion | 70 percent | 15 percent | 15 percent |
Note: All dollars in $2016. Excludes education debt used to finance the education of a child or other relative. Percent may not sum to 100 due to rounding.
Source: 2016 SCF.
Families with a completed degree typically have higher annual income as well as more education debt than families without a completed degree (Table 4). Even with the higher debt balances, though, families with a completed degree appear to be in better financial shape than families without a completed degree: they are less likely to be late on debt payments and are less likely to find themselves devoting a large share of their income to debt service and rent payment. About 34 percent of families with incomplete degrees devote more than 40 percent of income to these payments, compared to about 23 percent of families with complete degrees.8 They are also more likely to own homes, have retirement accounts, report that they are certain about their future income, and report that they usually have a good idea about their family’s income next year.
Table 4: Financial characteristics of families aged 40 or older with education debt, by degree completion
| Mean | Percent | ||||||
|---|---|---|---|---|---|---|---|
| Income (in thous.) | Ed. debt (in thous.) | Debt payments>40% income | Late on repayment | Home ownership | Have retirement account | Certain about future income | |
| No completed degree | $70 | $22 | 34 | 18 | 34 | 34 | 65 |
| Completed degree | $94 | $38 | 23 | 15 | 65 | 67 | 82 |
Note: Families with both a completed and incomplete degree are included with completed degree.
Source: 2016 SCF.
III. Education Debt for Children's Education
The remaining $147 billion--about one-third--of total education debt owed by households with a head older than 40 was used to finance a child's education (Table 1). In some cases, this debt is owed by the parent--via a Parent PLUS loan, for example. In other cases, it is owed by a child that resides in a parent's household.9 Both cases, though, represent a subsidy from parents to children, whether direct--in the former case--or an implicit in-kind parental subsidy--in the case where a child is living at home. As either scenario has the potential to burden the family's finances, we will examine the financial circumstances of both types of households with student loan debt for children.
Living and financial situations are sufficiently opaque so that we will not always be able to determine who took the loan out for the child's education, even with the more detailed 2016 SCF questionnaire. Of the $147 billion used to finance a child's education, $57 billion is held by parents without adult children in their household--this is almost certainly an education loan taken out by a parent on behalf of a child. The remaining $90 billion, though, is held in older households with adult children living at home, where we cannot distinguish whether this debt is held by the parent or child. Based on aggregate balances in the federal Parent PLUS loan program we believe that some of the unknown-owner debt should be considered as debt owned by the parents.10 However, the majority of the unknown-owner debt is likely owned by adult children living at home with their parents.
Table 5: Financial characteristics of families aged 40 or older with education debt for children
| Income (Thousands) | All Education Debt (Thousands) | Pir >40 | Late on Repayment | Home Ownership | Have Retirement Account | Certain about future income | |
|---|---|---|---|---|---|---|---|
| No Adult Kids in Home | $111 | $33 | 19% | 4% | 77% | 72% | 84% |
| Adult Kids in Home | $109 | $41 | 16% | 12% | 75% | 75% | 84% |
Both types of households tend to have high incomes--averaging around $110 thousand--and both types of families tend to own homes, have retirement accounts, and are certain about their future income (table 5). These findings suggest that these households who are directly or indirectly supporting their children's education are, on average, financially capable of doing so.
Other researchers have noted that many low-income and minority families have borrowed heavily from the Parent PLUS program (Fishman, 2018). While half of the $147 billion owed resides in families earning more than $100 thousand annually, families earning less than $50 thousand annually owe about 19 percent of the $147 billion. These families are often less financially secure than the average family, and supplemental tabulations suggest that about half of these families are headed by a non-white person, while only about one-quarter of the families earning more than $100 thousand annually are headed by a minority.
Conclusions
As education debt has become the largest source of non-mortgage debt on family balance sheets, worries have mounted about defaults and potential repayment issues (see, for example, Chakrabarti, Gorton, Jiang, and van der Klaauw, 2017). This debt is increasingly owed by older families. The SCF shows that most of the debt owed by older families was used to finance a completed degree, and much of it was taken out for recent educational endeavors, but a significant share of families also are holding debt many years after leaving school, which could indicate that these families are having a hard time repaying education loans. The SCF also shows that a sizeable part of the education debt owed in families with a head of household aged 40 or older represents a subsidy from parents to children, either from parents financing a child's education directly or from parents housing their children after college.
The increase in the amount of education debt held by older households is potentially worrisome. Since most education debt is underwritten by the federal government, the direct effect on financial stability--from a credit risk perspective--may be relatively small. Education debt may have an indirect effect on credit risk, though, if education debt burden leads to defaults on other types of debt. However, recent evidence also suggests that this risk is also limited (Feiveson, Mezza, and Sommer, 2018). Repayment risk may have a bigger impact on the federal budget in the future, though (Looney, 2018). Nevertheless, the amount of education debt may be a concern for the well-being of older households, if many of them are still repaying debt many years after leaving school or they did not receive an accompanying boost in their income from attending postsecondary program.
References
Amromin, Gene, Janice Eberly, and John Mondragon. (2017) "The Housing Crisis and the Rise in Student Loans," mimeo.
Avery, Christopher and Sarah Turner (2012). "Student Loans: Do College Students Borrow Too Much--Or Not Enough?" Journal of Economic Perspectives, vol. 26, no. 1, pp. 165-192. DOI: 10.1257/jep.26.1.165.
Board of Governors of the Federal Reserve System (2017), "Report on the Economic Well-Being of U.S. Households in 2016" Washington: Board of Governors of the Federal Reserve System.
Bricker, Jesse, Lisa J. Dettling, Alice Henriques, Joanne W. Hsu, Lindsay Jacobs, Kevin B. Moore, Sarah Pack, John Sabelhaus, Jeffrey Thompson, and Richard A. Windle (2017) "Changes in U.S. Family Finances from 2013 to 2016: Evidence from the Survey of Consumer Finances," Federal Reserve Bulletin vol. 103, no. 3.
Bricker, Jesse, Meta Brown, Simona Hannon, and Karen Pence, "How much education debt is out there?" FEDS Note (2015).
Carneiro, Pedro, James J. Heckman, and Edward J. Vytlacil. 2011. "Estimating Marginal Returns to Education." American Economic Review, 101 (6): 2754-81. DOI: 10.1257/aer.101.6.2754
Chakrabarti, Rajashri, Nicole Gorton, Michelle Jiang, and Wilbert van der Klaauw (2017). "Who Is More Likely to Default on Student Loans?" Federal Reserve Bank of New York Liberty Street Economics (blog), November 20, 2017, http://libertystreeteconomics.newyorkfed.org/2017/11/who-is-more-likely-to-default-on-student-loans.html.
Chakrabarti, Rajashri, Andrew Haughwout, Donghoon Lee, Joelle Scally, Wilber van der Klaauw (2017). "Press Briefing on Household Debt, with Focus on Student Debt" April 3, 2017.
Dettling, Lisa and Joanne Hsu (2014) (https://research.stlouisfed.org/publications/review/2014/12/15/the-state-of-young-adults-balance-sheets-evidence-from-the-survey-of-consumer-finances/);
Fishman, Rachel (2018). "The Wealth Gap PLUS Debt: How Federal Loans Exacerbate Inequality for Black Families," Washington: New America (newamerica.org/education-policy/wealth-gap-plus-debt/).
Feiveson, Laura, Alvaro Mezza and Kamilla Sommer (2018) "Student Loan Debt and Aggregate Consumption Growth" FEDS Notes, February 2018.
GAO (2016). "Social Security Offsets." Washington: General Accountability Office, GAO-17-45.
Goodman, Sarena F. and Alice M. Henriques (2015). "Attendance Spillovers between Public and For-Profit Colleges: Evidence from Statewide Changes in Appropriations for Higher Education," Finance and Economics Discussion Series 2015-025. Washington: Board of Governors of the Federal Reserve System, http://dx.doi.org/10.17016/FEDS.2015.025r1.
Looney, Adam and Michael Greenstone (2012). "Regardless of the Cost, College Still Matters", The Hamilton Project blog, October 5, 2012.
Looney, Adam and Michael Greenstone (2013). "Is Starting College and Not Finishing Really That Bad?" The Hamilton Project blog, June 7, 2013.
Looney, Adam (2018). "Why the Dentist with $1 Million in Student Debt Spells Trouble for Federal Loan Programs" Brookings Institution Blog https://www.brookings.edu/blog/up-front/2018/05/30/why-the-dentist-with-1-million-in-student-debt-spells-trouble-for-federal-loan-programs/ (accessed June 14, 2018).
Lovenheim, Michael and C. Lockwood Reynolds. (2013) "The Effect of Housing Wealth on College Choice: Evidence from the Housing Boom," The Journal of Human Resources, vol. 48, no. 1, pp.1-35, doi: 10.3368/jhr.48.1.1.
Mezza, Alvaro, Daniel Ringo, Shane Sherlund, and Kamila Sommer (2016) "Student Loans and Homeownership" Finance and Economics Discussion Series 2016-010. Washington: Board of Governors of the Federal Reserve, http://dx.doi.org/10.17016/FEDS.2016.010r1.
1. See Bricker, Dettling, Henriques, Hsu, Jacobs, Moore, Pack, Sabelhaus, Thompson, and Windle (2017) for more information on the 2016 SCF. Return to text
2. These figures are in nominal dollars. Growth in aggregate education debt in the NY Fed/Equifax Consumer Credit Panel (CCP), and the Federal Reserve Board G.19 are comparable over similar time periods. Aggregate education debt is typically lower in the SCF because it samples only non-institutional populations--and thus excludes residents living in college dorms--and because detailed questions are only asked of the core economic unit, excluding roommates. The FEDS Note "How much education debt is out there?" (Bricker, Brown, Hannon, and Pence, 2015) describes the differences between the education loan data in the SCF, the CCP, and the G.19 data. Return to text
3. In both the NYFed/Equifax Consumer Credit Panel (Chakrabarti, Haughwout, Lee, Scally, and van der Klaauw, 2017) and Department of Education's National Student Loan Data System (GAO, 2016), aggregate balances of borrowers over age 40 are larger than aggregate balances for 30-39 year old borrowers who, in turn, have larger balances than borrowers younger than age 30. Return to text
4. Note that the SCF code frame allows the respondent to report loans taken out on behalf of grandchildren and other relatives, too. But nearly all such loans reported in the 2016 SCF were taken out for children. The 2016 SHED survey also indicates that about 5 percent of families have taken loans out to finance a child's education, and that education debt owed by older families is often to finance a child's education (Board of Governors of the Federal Reserve System, 2017). Return to text
5. A time series comparison with past SCF estimates is imperfect here because (a) past SCF estimates do not differentiate between loans taken out for children from loans taken out for self and (b) a questionnaire wording change. Prior to the 2016 survey, the survey question was based on when the education loans were taken out or refinanced, while in 2016, the questionnaire was updated to ask "In what year did [you] last attend the educational program this loan was used to pay for?" In principle, the question in earlier years would lead to an upward bias in this time series relative to the 2016 questionnaire. In practice, though, the comparison should be fairly close, as most education loans are consolidated after graduation and the consolidation date is usually close to the date of last attendance. In the 2013 and 2010 surveys, the closest comparable figures were 15 percent and 9 percent, respectively, indicating that debt is staying on the family balance sheet longer. Return to text
6. Degrees are increasingly financed by debt as state budgets for higher education shrink and tuitions rise. Note, though, that higher education has historically offered one of the highest average returns on investment, even with the surging cost of college and rising education debt (Avery and Turner, 2012; Looney and Greenstone, 2012). Return to text
7. These figures are generally consistent across the other age groups noted in table 1, though the percent of debt that funded a completed degree increases with age, and the percent used to fund a currently enrolled program decreases with age. Return to text
8. The "completed degree" families pay a larger share of income to education debt repayment, too. Return to text
9. Parents may take out education loans on behalf of their children to share the burden of the cost of college--because of growth in attendance costs--or because of annual caps on loan amounts in federal student loan programs for college attendees. Also, other sources of financing may no longer be available. Prior to the housing crash in the late 2000s, for example, families often borrowed against home equity to help fund college enrollment (Lovenheim and Reynolds, 2013; Amromin, Eberly, and Mondragon, 2017). The use of these sources of credit--which are outside of the traditional education loan programs--may have declined in recent years due to demand or supply reasons. Return to text
10. Parent PLUS loans totaled approximately 80 billion dollars in 2016. Return to text
Bricker, Jesse, Elizabeth Llanes, and Alice Volz (2018). "Education Debt Owed by Older Families in the 2016 Survey of Consumer Finances," FEDS Notes. Washington: Board of Governors of the Federal Reserve System, December 21, 2018, https://doi.org/10.17016/2380-7172.2292.
Disclaimer: FEDS Notes are articles in which Board staff offer their own views and present analysis on a range of topics in economics and finance. These articles are shorter and less technically oriented than FEDS Working Papers and IFDP papers.