FEDS Notes
March 24, 2017
The Effect of Sales-Tax Holidays on Consumer Spending
Aditya Aladangady, Shifrah Aron-Dine, Wendy Dunn, Laura Feiveson, Paul Lengermann, and Claudia Sahm 1
Over the past decade, many U.S. states have enacted policies that temporarily exempt consumer purchases of certain goods from state sales taxes.2 Many of these sales-tax holidays occur just before the start of the school year and apply to purchases of school supplies, computers, and/or clothing and shoes. Some states also implement tax holidays for purchases related to hurricane preparedness, energy conservation, and hunting. Two states--Massachusetts and Louisiana--have even implemented broad tax holidays that exempt the first $2,500 of most purchases of goods.
Often, these tax holidays are timed so they coincide with heavy shopping periods for necessities, such as school supplies. In such cases, these policies tend to be especially beneficial to low-income households, since necessities comprise a relatively large share of their overall spending (Henry, 2014). Retail businesses view sales-tax holidays favorably because they purportedly encourage shopping activity, and some policy makers have argued that these temporary fiscal policies provide a net stimulus to economic activity. Understanding how consumers respond to these policies is therefore important, both for evaluating the likely impact on state budgets and for understanding the magnitude and timing of their economic effects.
In a previous FEDS Note, we studied the effects of unforeseen weather events like hurricanes on the spending behavior of consumers using daily, state-level transaction volumes. In this note, we use the same dataset to investigate whether the pre-announced sales-tax holidays noticeably alter the spending behavior of consumers. Specifically, we investigate whether there are shifts in the level and/or composition of consumer spending before, during, and after these sales-tax holidays.
To summarize, we find the timing of consumer spending is often extremely responsive to tax holidays. In particular, small reductions in after-tax prices were associated with large increases in the volume of purchases in a variety of spending categories, especially durable goods. Evidence from a natural experiment in Massachusetts suggest the sales-tax holiday provided a net boost to retail spending over the month as a whole, as opposed to only a re-timing of spending within the month. Whether sales-tax holidays add to spending over a longer horizon likely depends on a number of factors outside the scope of our current analysis, including the breadth of the tax policy and its salience among consumers.
Description of the Payment Transactions Data
The data we use for this analysis are the outcome of a collaboration between the Federal Reserve Board, Palantir Technologies, and First Data Merchant Services, LLC (First Data). Our state-level aggregates originate from anonymized transactions recorded by First Data, an electronic payments processor that provides merchants with the technology to process credit, debit, and electronic payment transactions. Palantir constructed daily indexes of purchases by state and by merchant groupings for the Board, with historical data available back to 2013.3
We classify spending into broad categories using information on the type of merchant where the transaction occurred, e.g. restaurants, gasoline stations, and department stores. We also focus on a broad spending measure that we refer to as the "retail sales group."4 The retail sales group accounts for about one third of total consumer spending as defined in the National Income and Product Accounts (NIPAs) and appears to be well measured by the First Data transactions.
An Event Study: Massachusetts
We begin by examining the pattern of spending around the sales-tax holidays enacted in Massachusetts in 2014 and 2015. These tax holidays present an interesting case because Massachusetts offered a tax exemption on a very broad set of purchases, including almost all consumer purchases of tangible personal property with a unit cost of $2,500 or less.5 Given the state's sales-tax rate of 6.25 percent, the potential cost savings for consumers from this tax holiday amounted to as much as $156 per item.
The six panels in figure 1 show the timing of daily spending for several categories of stores in August 2014 and August 2015, when the Massachusetts tax holidays occurred, along with the same period in 2016, when there was no tax holiday.6 Comparing across years, we can observe that the average daily spending rates during the tax-holiday weekends were much higher than sales over the same (non-tax-holiday) weekend in 2016; indeed, the pattern of daily sales in 2016 appears to align more closely with the other August weekends in that year.
The top two panels of figure 1 show spending for two categories of stores--furniture and electronics and appliances--that mainly sell high-priced durable consumer goods that were eligible for the tax holiday. Sales at both of these so-called "high exposure" store categories jumped noticeably, with the level of Saturday sales more than double the average daily sales level for the month as a whole. Sales at clothing and accessory stores and at general merchandise stores (the middle two panels) also surged, suggesting that consumers reacted to the tax holiday by increasing their purchases of relatively inexpensive, semi-durable items as well. In contrast, the bottom two panels show that spending at categories of stores that tend not to sell goods eligible for the tax exemption--such as restaurants and gasoline stations--exhibit similar daily movements in all three years, a pattern that is consistent with our hypothesis that differences in the other store categories can be attributed to the tax holiday.
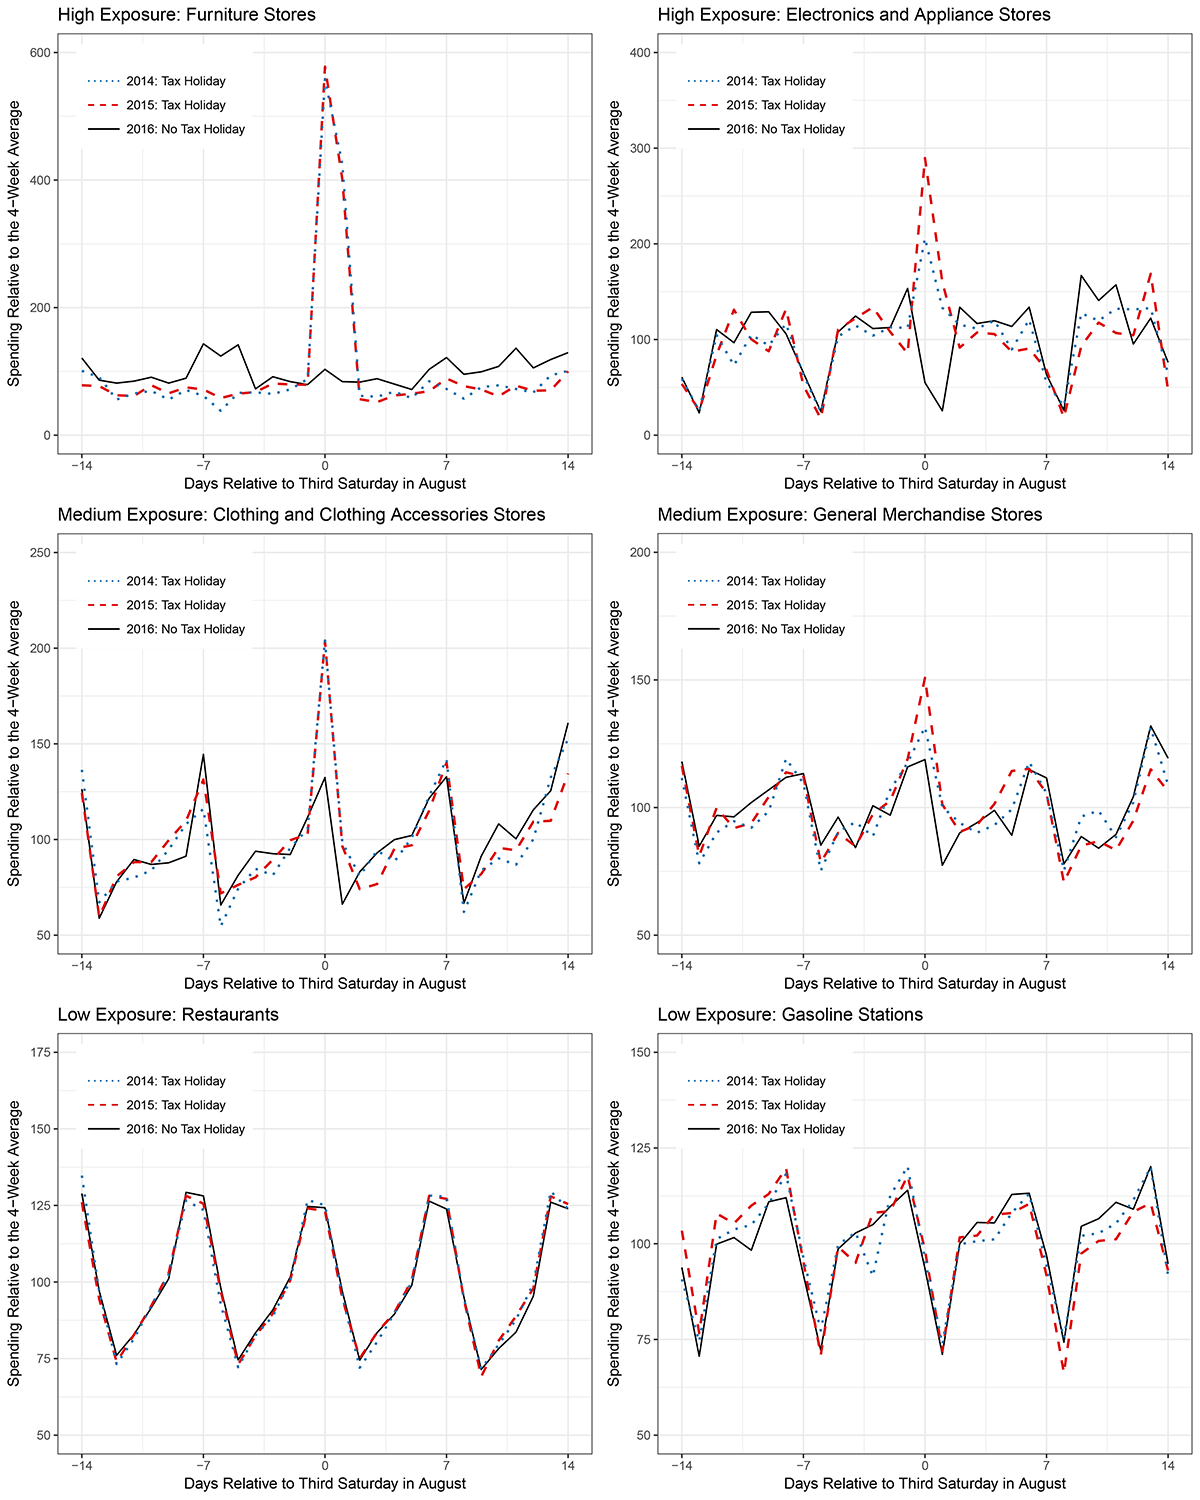
Source: First Data Merchant Services, Census Bureau.
Note. An index value of 100 means that the level of daily spending was equal to average daily spending in that category during the surrounding four weeks. The Massachusetts sales-tax holiday weekends took place on August 16 and 17, 2014 and August 15 and 16, 2015.
Cross-sectional comparisons of spending in Massachusetts with other nearby states provide another gauge of the effects of the sales-tax holiday. In figure 2, we plot the daily aggregate of retail sales group spending in August 2015 for Massachusetts, Vermont, and Rhode Island; the latter two states did not have a sales-tax holiday during this period. In addition to having similar non-holiday sales-tax rates, the close geographical proximity of these states suggests they are likely to have similar seasonal fluctuations in demand.7 These states should, therefore, provide a reasonable benchmark for what spending in Massachusetts would look like in the absence of a sales-tax holiday. The figure illustrates that increases in spending in Massachusetts over the tax-holiday weekend are absent in the data for Vermont and Rhode Island. Although these differences may partly reflect shifts in purchases across state lines, we view the patterns as suggestive that consumers adjust their spending behavior noticeably to take advantage of the temporarily lower prices.
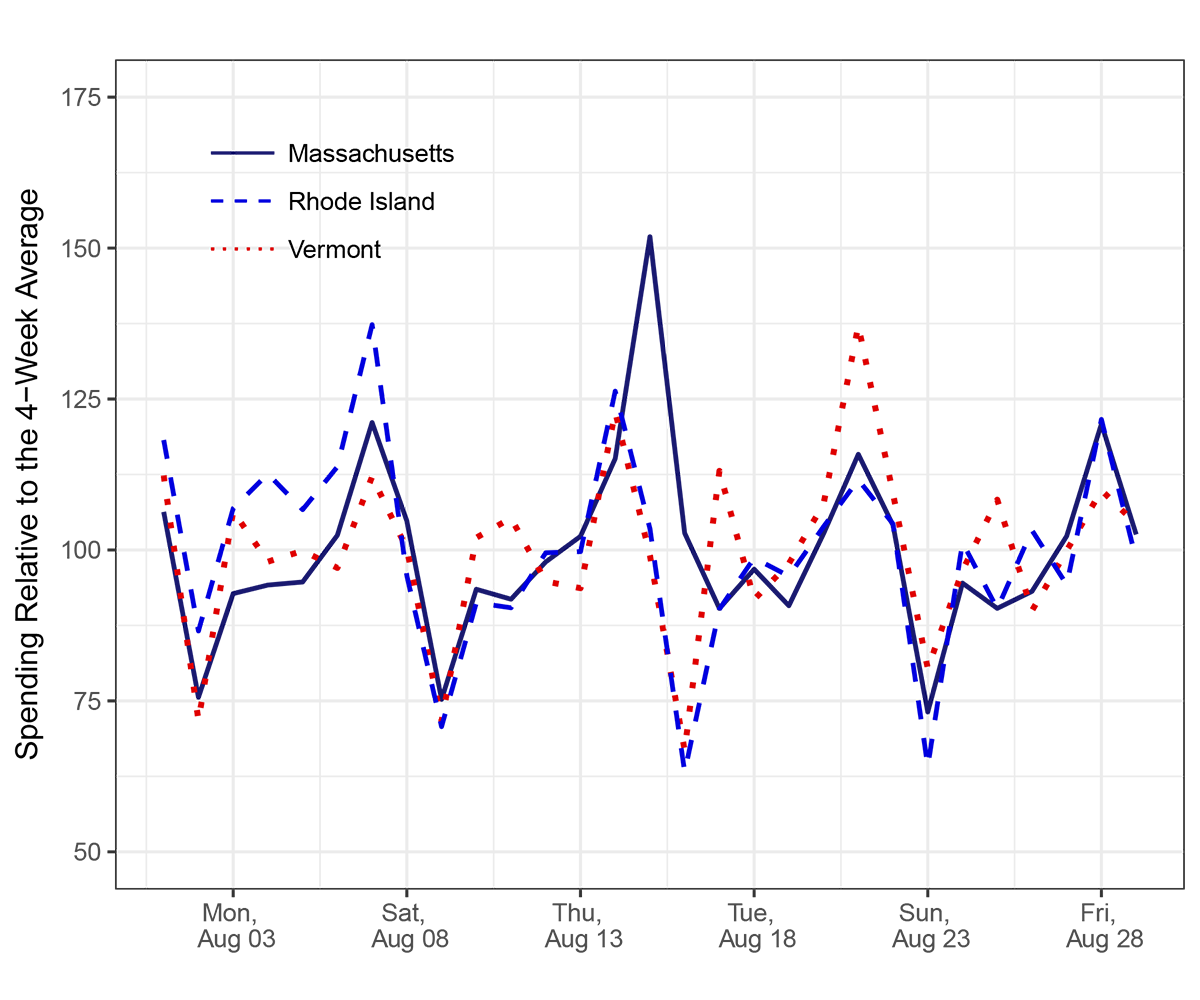
Source: First Data Merchant Services, Census Bureau.
Note. The Massachusetts sales-tax holiday weekend took place on August 15 and 16, 2015.
Regression analysis
To quantify these spending responses a little more formally, we estimated a regression in which we compare the daily Massachusetts data to those in bordering states, controlling for regular monthly seasonality and day-of-week effects.8 As shown in figure 3, for the broad retail sales group aggregate, the estimated coefficients imply that daily spending in Massachusetts over the tax-holiday weekend was about 40 percent higher than it would have been without the tax holiday.9
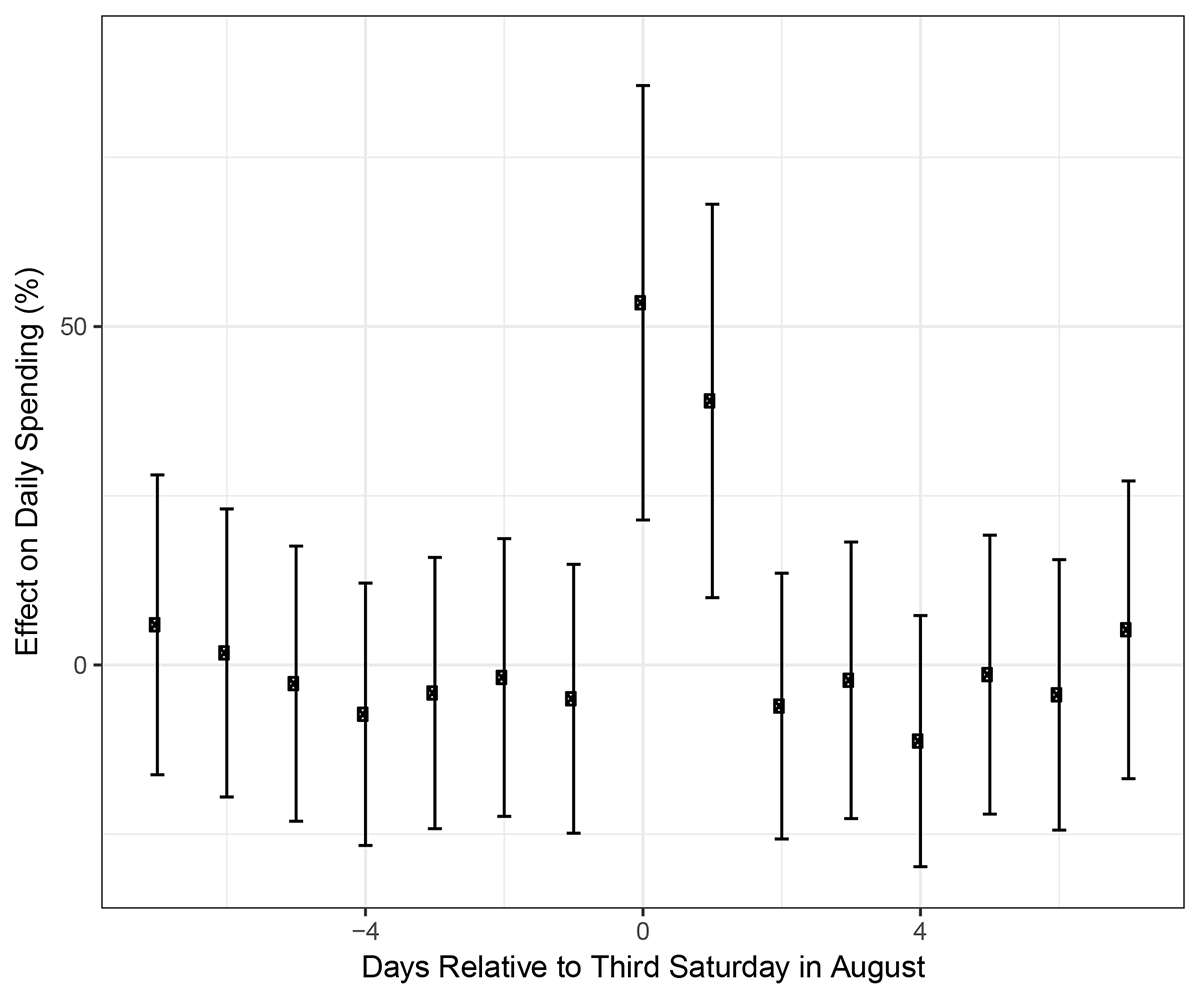
Source: First Data Merchant Services, Census Bureau.
Note. For ease of interpretation, we convert the log-deviations from the regression into percent deviations in daily spending. The dots are the estimated coefficients for the STH and the whiskers are the 95 percent confidence intervals.
As illustrated by the dots outside of the shaded tax-holiday period in figure 3, the coefficients on lags and leads of the tax-holiday indicator variable are close to zero. Taking these point estimates literally, we would conclude that the net effect of the tax holiday on spending for the month as a whole was moderately positive. That said, the standard errors are large, so we cannot definitively rule out that the tax holiday merely shifted the timing of purchases and had no net effect on spending over the two-week horizon. In addition, some of the negative offsets in spending may have occurred outside the assumed time horizon. In particular, very long-lived durable goods such as furniture are likely purchased only intermittently, and these categories are where the spending response appears to have been concentrated (figure 1).
Discussion
The pronounced spending response to the Massachusetts tax holiday likely reflects a number of factors that may not be relevant for all sales-tax holidays, or for temporary price changes more generally. For instance, the actual cost savings consumers could potentially face depends on the breadth of purchases that are eligible for the tax exemption, and on the extent to which the tax savings feed through to lower consumer prices. As noted earlier, the Massachusetts tax holiday exempted an unusually broad array of tangible personal property (valued up to $2,500 per item), purchases of which comprise an appreciable share of the typical household's annual spending. Most occurrences of tax holidays in other states have encompassed a narrower set of purchases, and perhaps as a result, the evidence of spending effects in these other instances appears more mixed. For instance, during Louisiana's annual "Second Amendment" sales-tax holiday on purchases of firearms, ammunition, and hunting supplies, the index of spending at sporting goods stores (where firearms are usually sold) in Louisiana jumped well above the spending indexes for Texas and Arkansas (figure 4, left panel). Elsewhere, a tax holiday on clothing and school supplies in Ohio left no visible imprint on spending, even for the most relevant category of clothing and accessory stores (figure 4, right panel).10
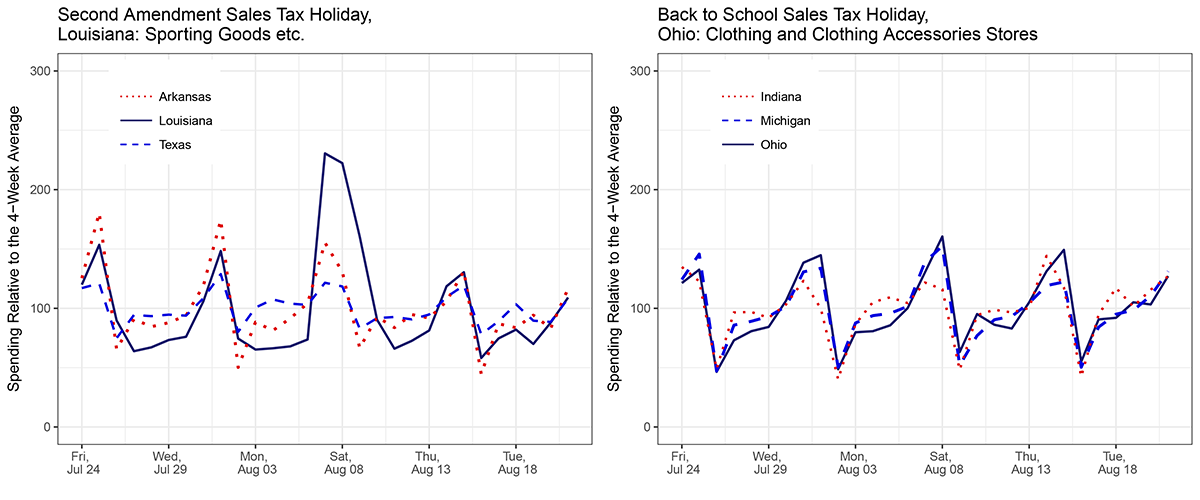
Source: First Data Merchant Services, Census Bureau.
Note. The Second Amendment Sales-tax holiday in Louisiana took place September 4-6, 2015, and the Back to School sales-tax holiday in Ohio took place August 7-9, 2015.
Another factor that may affect the magnitude of the spending response is its salience to consumers; see, for example, Chetty, Looney, and Kroft (2009). Depending on how widely advertised the holidays are, and how aware consumers are of their existence, even similarly-structured tax holidays could have disparate effects on spending. Figure 5 provides some evidence of variation in salience by showing the relative search intensity for the words "tax holiday" in states that had some form of tax holiday in 2015. Perhaps not surprisingly, the two states that enacted relatively broad-based tax holidays--Massachusetts and Louisiana--show high rates of search intensity.11 Elsewhere, states that implemented tax holidays on a narrower set of purchases seem to generate less interest among potential shoppers.
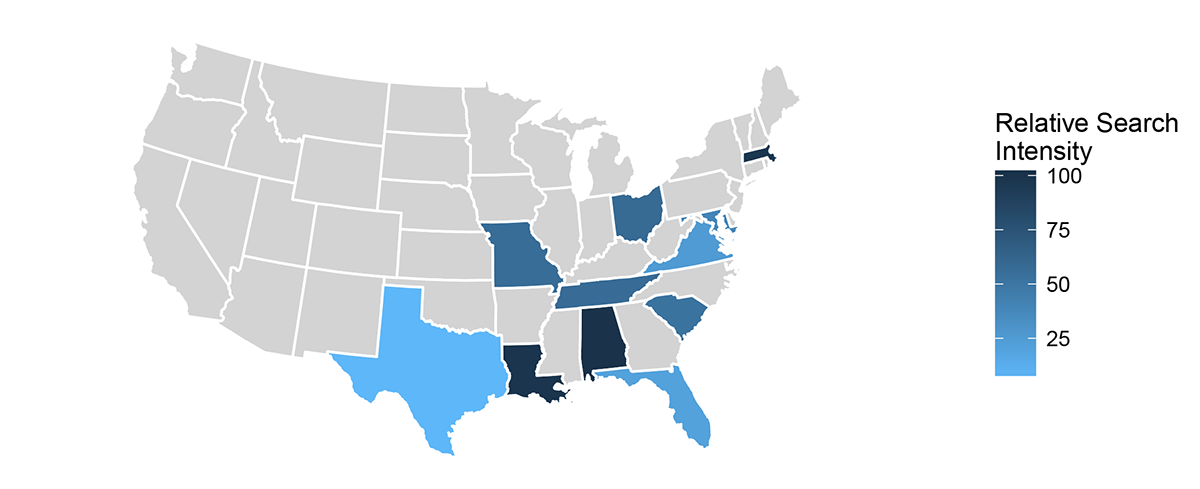
Source: Google Trends, https://trends.google.com/trends/explore?date=2015-01-01%202015-12-31&q=tax%20holiday. Census.
Note: Google Trends index for search intensity for "tax holiday." Chart only includes states with a 2015 tax holiday and Google search data. Initial Google index is re-normalized using state populations from Census. Index value of 100 in chart means the state had the most searches of “tax holiday” per capita among this group of states.
Conclusion
Our analysis of anonymized state-level aggregates of daily transactions data indicate that sales-tax holidays are associated with significant shifts in the timing of purchases by consumers. Our results suggest sharpest responses are in purchases of durable goods such as furniture or consumer electronics. However, the exact magnitude of the spending effect from a sales-tax holiday depends crucially on details of its implementation, including the breadth of purchases covered and salience of the policy.
References
Aladangady, Aditya, Shifrah Aron-Dine, Wendy Dunn, Laura Feiveson, Paul Lengermann, and Claudia Sahm (2016). "The Effect of Hurricane Matthew on Consumer Spending," FEDS Notes. Washington: Board of Governors of the Federal Reserve System, December 2, 2016. https://doi.org/10.17016/2380-7172.1888.
Agarwal, Sumit, Nathan Marwell, and Leslie McGranahan (forthcoming). "Consumption Responses to Temporary Tax Incentives: Evidence from State Sales Holidays" American Economic Journal: Economic Policy. Available at SSRN: http://dx.doi.org/10.2139/ssrn.2178753.
Chetty, Raj, Adam Looney, and Kory Kroft (2009). "Salience and Taxation: Theory and Evidence" American Economic Review. 99:4, p. 1145-1177.
First Data Merchant Services, LLC. Retail volume aggregates, https://www.firstdata.com/en_us/home.html.
Google Trends, https://trends.google.com/trends/explore?date=2015-01-01%202015-12-31&geo=US&q=tax%20holiday.
Henry, LaVaughn M. (2014). "Income Inequality and Income-Class Consumption Patterns." Economic Commentary. Federal Reserve Bank of Cleveland https://www.clevelandfed.org/newsroom-and-events/publications/economic-commentary/2014-economic-commentaries/ec-201418-income-inequality-and-income-class-consumption-patterns.aspx
Massachusetts Department of Revenue (2015). TIR 15-7: The 2015 Massachusetts Sales Tax Holiday Weekend.
1. We thank Aaron Jaffe, Dan Moulton, and their colleagues at Palantir for extensive work and conversations in constructing the state-level aggregate indexes we analyze here. Return to text
2. See http://www.taxadmin.org/sales-tax-holidays. Return to text
3. First Data client merchants are classified by Merchant Category Codes (MCC). To facilitate comparisons with Census data on retail sales, these MCC codes were mapped to the relevant NAICS 4-digit industry. Return to text
4. The "retail sales group" includes all retail sales and food services other than sales at motor vehicle dealers, building material stores, and gasoline stations; it is the portion of the Census retail sales data that the BEA uses to construct its estimate of personal consumer expenditures. First Data also has good coverage of gasoline stations and some service-industries outside of the retail sales group but does not cover all consumer spending. Return to text
5. The following items did not qualify for the MA sales-tax holiday exemption: all motor vehicles, motorboats, services, gasoline, steam, electricity, tobacco products and any single item whose price is in excess of $2,500. See Massachusetts Department of Revenue (2015). Return to text
6. The Massachusetts sales-tax holiday was enacted in August of every year from 2004 through 2015 except for 2009. Return to text
7. In 2015, the combined state and local sales tax rates for MA, CT, and RI were 6.25 percent, 6.35 percent, and 7 percent, respectively. Return to text
8. The regression specification takes the following form:
$$$${\ln \left({Spending}_{tr}\right)\ }=\sum^{s=7}_{s=-7}{\beta_s*{STH}_{t-s}}+\sum^{w=Sun}_{w=Mon}{\gamma_{w}*I({Day}_t=w)}+\sum^{m=Nov}_{m=Apr}{\delta_m*I({Month}_t=m)}+T_t+\gamma_r+\epsilon_t \ ,$$$$
where $$r$$ is Massachusetts and its bordering states (Maine, New Hampshire, Vermont, New York, and Rhode Island. Connecticut was excluded since it had a sales tax holiday during the same time period.) The effects of the Massachusetts sales-tax holiday is captured by the coefficients on the indicator variables, $${STH}_{t-s}$$, which equal one if the holiday was in effect on date t-s, and zero otherwise. The coefficient $$\beta_0$$ is the estimated effect on (log) spending on the Saturday of the Massachusetts tax holiday, and $$\beta_1$$ is the effect on Sunday shopping. The remaining $$\beta_s$$ coefficients capture whether purchases during the tax holiday are partially offset by lower spending before or after the holiday. The regression also controls for variation in spending due to the day of week in each state, the month of year, and a linear time trend ($$T_t$$). To minimize differences in states' regular seasonal patterns, we restrict the sample to the months of July, August and September in 2015 and 2016.
Our estimated effect on daily spending is larger than the range of estimates of around 10 to 12 percent reported in Agarwal, Marwell, and McGranahan (forthcoming). Nevertheless, their findings are not directly comparable since they were based on a larger sample of sales-tax holidays in other states, most of which only exempted purchases of clothing, shoes, or school supplies. Furthermore, their establishment groupings are slightly different than ours. Return to text
9. Our estimated effect on daily spending is larger than the range of estimates of around 10 to 12 percent reported in Agarwal, Marwell, and McGranahan (forthcoming). Nevertheless, their findings are not directly comparable since they were based on a larger sample of sales-tax holidays in other states, most of which only exempted purchases of clothing, shoes, or school supplies. Furthermore, their establishment groupings are slightly different than ours. Return to text
10. In Ohio, the sales tax holiday covers clothing priced at $75 per item or less and school supplies/instructional materials priced at $20 per item or less. Return to text
11. The broad Massachusetts sales-tax holiday was implemented in 2014 and 2015 but discontinued in 2016. Return to text
Aladangady, Aditya, Shifrah Aron-Dine, Wendy Dunn, Laura Feiveson, Paul Lengermann, and Claudia Sahm (2017). "The Effect of Sales-Tax Holidays on Consumer Spending," FEDS Notes. Washington: Board of Governors of the Federal Reserve System, March 24, 2017, https://doi.org/10.17016/2380-7172.1941.
Disclaimer: FEDS Notes are articles in which Board staff offer their own views and present analysis on a range of topics in economics and finance. These articles are shorter and less technically oriented than FEDS Working Papers and IFDP papers.