FEDS Notes
February 18, 2022
Estimating U.S. Cross-Border Securities Flows: Ten Years of the TIC SLT
Carol Bertaut and Ruth Judson1
*On October 15, 2025, the authors discontinued updating this dataset. Please see here for more information.
TIC SLT data: CSV | Data definitions (TXT) | Historical data (ZIP) (Updated: September 25, 2025)
The Treasury International Capital (TIC) system collects cross-border securities positions and transactions data and is the primary source of information on foreign official and private demand for U.S. Treasuries and other U.S. securities, as well as for U.S. investment in foreign securities.2 As noted in earlier work, though, the TIC system currently collects data separately on holdings of securities (the monthly TIC SLT and the annual SHL/SHC collections) and on transactions, the TIC S, and these two data streams can be difficult to reconcile, making interpretation of movements in the data challenging.3
In this note, we (1) argue that the best way to analyze cross-border capital flows from the current TIC data is to compute these flows from positions data and estimates of valuation change; (2) report some key examples that illustrate why it is important to use estimates of transactions based on the TIC SLT collection of cross-border securities positions; and (3) inform data users of upcoming developments in the TIC data collection system.
1. Estimating Flows Using the TIC SLT
The TIC Form SLT collects monthly data on the market value of long-term cross-border securities holdings by country, type of foreign holder (official or private), and type of security.4 We estimate transactions, or flows, as:
$$ [{SLT\ estimated\ transactions}] == [{Change\ in\ SLT\ holdings}] - [{Valuation\ change}] - [{Other\ changes}] $$
We estimate valuation change —that is, the monthly change in the market value of the securities arising from price or exchange rate changes —based on country or region-specific indexes for the country of issuer.5 Thus, since the valuation change estimates are based on the country of issuer, the price indexes used for U.S. securities are the same for all holder countries. "Other changes" are shifts in position that do not result from transactions —for example, substantial reporting revisions or shifts in holdings to or from the TIC reporting universe.6 Over the ten years that TIC SLT data have been collected, this method has yielded estimated transactions more consistent with positions reported in the TIC SLT, with the findings of the annual security-level survey data, and with our expectations based on other information, such as market commentary or patterns observed across time.7
With the publication of this note, we expect to begin regular monthly provision of the position, estimated transaction, and estimated valuation change data for counterparty countries that (1) have published TIC SLT position data and (2) have significant reported positions.8 This set of countries accounts for 95 to 99 percent of all long-term cross-border securities holdings. The dataset will not include the "other changes" series, because these data are generally sparse and can be also inferred from the component pieces.
2. Some Examples
A. Net Foreign Official (FOI) and Private Purchases of U.S. Treasury Bonds
The current separate collection of securities transactions on the TIC S and holdings data on the TIC SLT can generate differences that make it challenging to interpret developments in cross-border investments. For example, researchers and analysts are often interested in distinguishing foreign official demand for Treasuries from foreign private demand. Official investors are primarily foreign central banks and finance ministries. Their Treasury holdings in large part reflect investment of their dollar-denominated foreign exchange reserves, and thus their investment patterns may differ from those of private investors. Although the TIC S collects securities transactions by official investors, these data appear to overcount official net sales. This bias towards sales arises because official investors may purchase Treasuries through foreign private intermediaries, and thus will not be recorded on the TIC S as on behalf of a foreign official. However, sales (which also include maturities) of Treasuries are more likely to be recorded as on behalf of official investors, as TIC S reporters typically know that the sales activity originates from an account held for a foreign official investor. The TIC SLT data do not have this bias towards sales, as the data are reported by the custodians who manage the accounts for official investors and thus can accurately record both increases and decreases in foreign official holdings. Figure 1 shows annual net official (FOI) and private purchases of Treasuries as measured by the TIC S and as inferred from the TIC SLT holdings data using the method we described above. The right panel of Figure 1 shows the cumulative transactions over the 2012-2020 period that the two data series overlap. The SLT-based data, the blue bars, imply much stronger foreign Treasury purchases over this nine-year period, a difference that is almost entirely attributable to a markedly different pattern of FOI activity: The TIC S records overall FOI net sales totaling $1,142 billion, whereas the TIC SLT-based transactions imply FOI purchases of $483 billion, a difference of over $1.5 trillion, a huge difference relative to current estimated FOI Treasury bond holdings of about $4 trillion.9
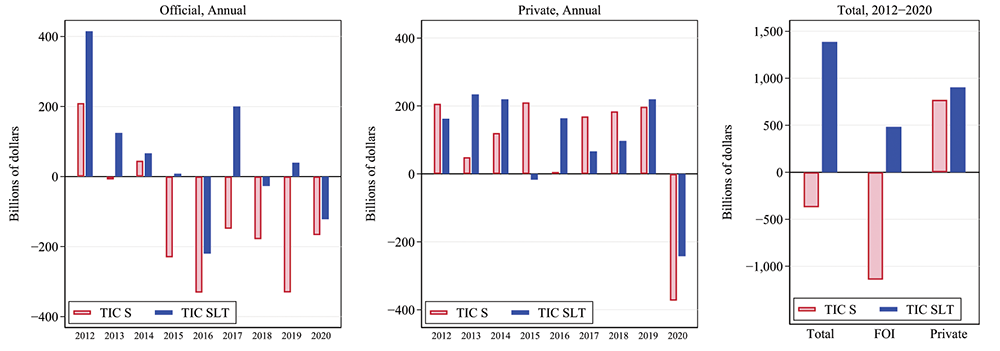
Note: Legend entries appear in graph in order from left to right.
B. Net Foreign Purchases of U.S. Agency Bonds
The TIC SLT-based transactions also can more accurately account for net purchases in U.S. agency bonds, shown in Figure 2. As reported on the TIC S, the pale red bars, net purchases of agency bonds overstate the strength of demand for agency securities, because transactions on the TIC S cannot account for the periodic principal repayments of asset-backed securities. To correct for this omission, the Treasury provides adjustment series that analysts can combine with the reported agency bond transactions to better estimate net transactions in agency securities; these repayment estimates have become a more pronounced part of the TIC S-based series as agency issuance has shifted over time to Ginnie Mae securities, which are exclusively mortgage-backed. By contrast, the market value holdings data on the TIC SLT (the blue bars) already incorporate the effects of principal repayments, so transactions can be calculated from these holdings without resorting to repayment estimates. A further advantage is that transactions derived from the TIC SLT can be more accurately estimated for individual countries, whereas the ABS adjustments provided for the TIC S are only available for total foreign net purchases.
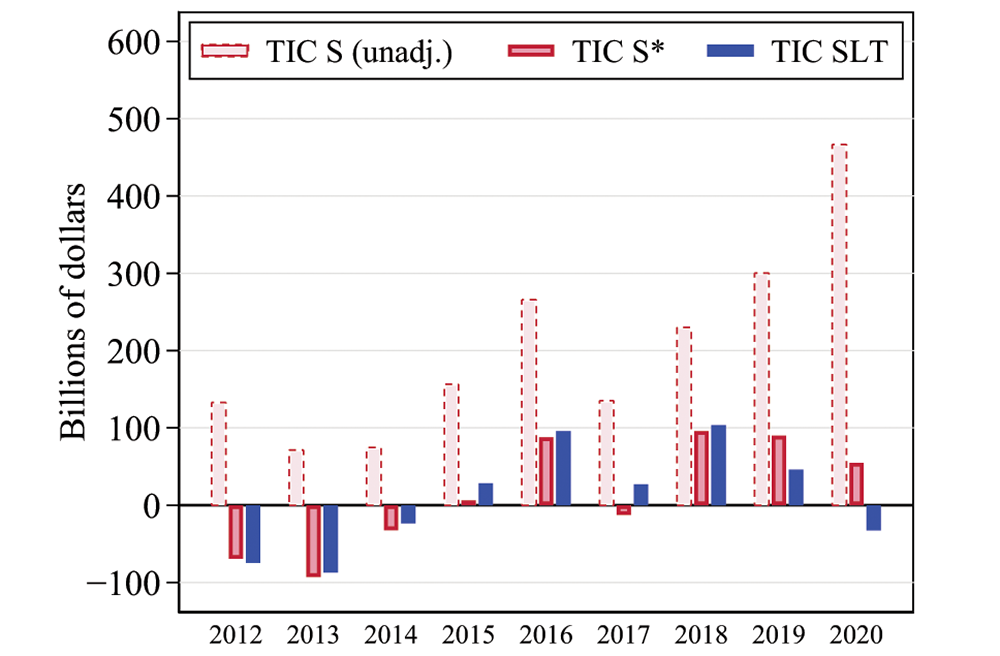
Note: *TIC S transactions adjusted for repayments. Legend entries appear in graph in order from left to right.
C. U.S. Purchases of Foreign Bonds
A further long-standing challenge with the TIC S data is an evident undercount in U.S. investors' purchases of foreign bonds, shown in Figure 3. The TIC S data (red bars) show net sales of foreign bonds for almost all years from 2012 to 2020, cumulating to net sales of $1.6 trillion. The TIC SLT-based transactions (blue bars), however, indicate more consistent U.S. investor purchases of foreign bonds that were particularly strong in 2017 and 2018, a finding that is confirmed with the annual surveys of U.S. holdings of foreign securities.
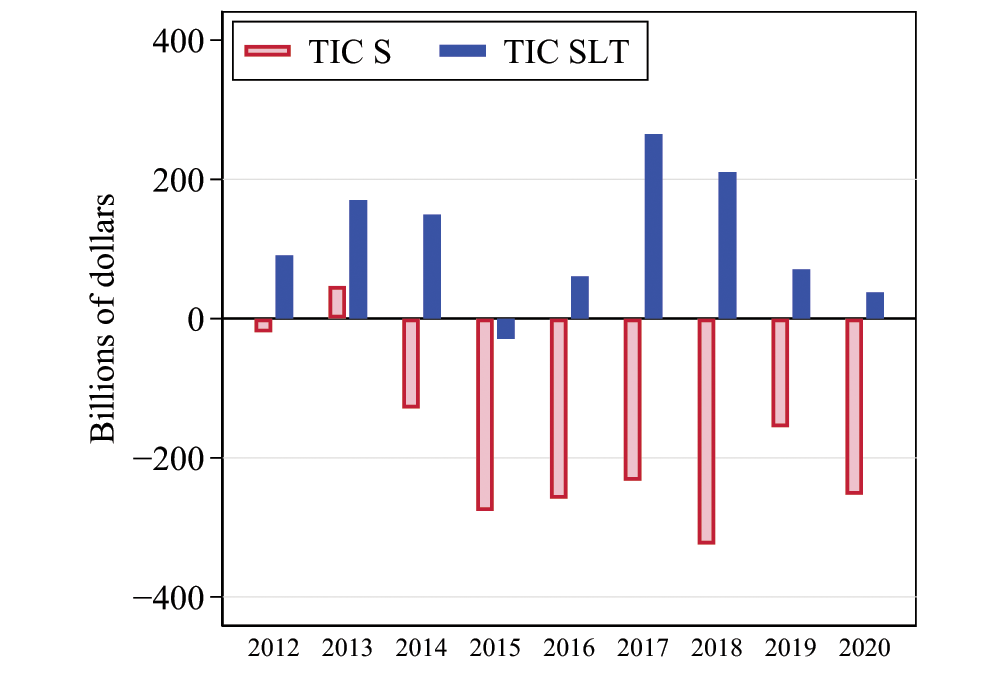
Note: Legend entries appear in graph in order from left to right.
D. U.S. Purchases of Emerging Market Bonds
An additional well-known challenge in interpreting the TIC S data is that purchases and sales of foreign securities are recorded against the country of the counter-party to the transaction and thus may not reflect the country issuing the security. This "transactions bias" in the TIC S can make it particularly difficult to analyze U.S. investor portfolio responses to emerging market risk episodes because transactions in emerging market economy (EME) bonds are likely to be recorded against major financial centers such as the United Kingdom or the Caribbean financial centers.
For example, as shown in Figure 4, the "Taper Tantrum" of 2013 is difficult to differentiate in the TIC S, which shows persistent U.S. net sales of EME bonds from April 2013 through September 2013, nearly two months before the taper tantrum began, and net sales overall for the full year 2013. By contrast, the TIC SLT-based flows show pronounced U.S. investor sales of emerging market bonds beginning only in June of 2013, the first full month of data after Chairman Bernanke's Congressional testimony on May 22, the date commonly cited as the start of the taper tantrum. These flows returned to purchases later in the year as market sentiment turned positive, and for 2013 as a whole, the TIC SLT data indicate net purchases of EME bonds. Indeed, the annual security-level survey data for 2013 confirm that notwithstanding the selloff in the middle of the year, U.S. investors did increase their holdings of EME bonds over the course of the year.
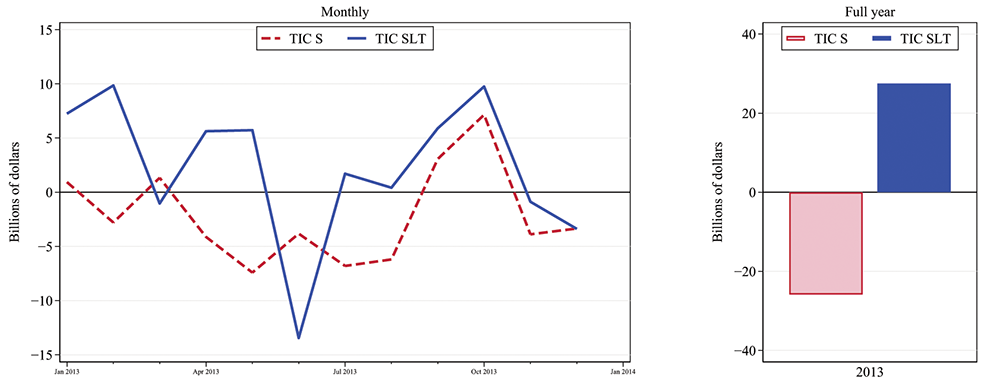
Note: Legend entries appear in graph in order from left to right.
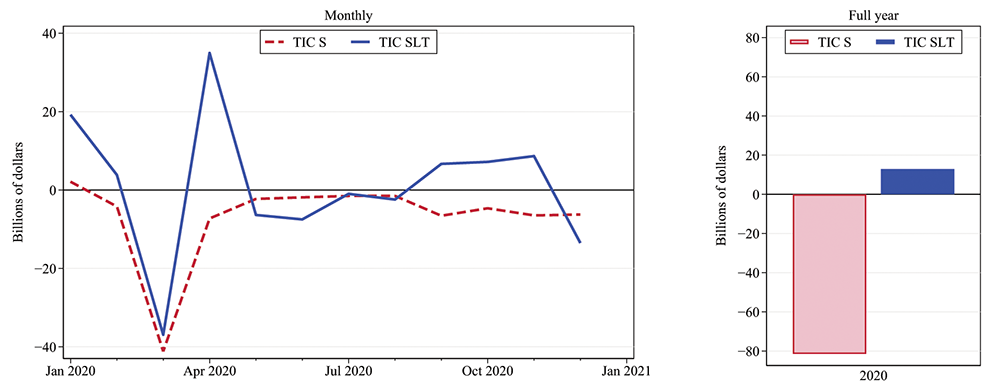
Similarly, the TIC SLT-based flows give a different perspective on U.S. investor responses to the 2020 COVID-19 shock. Both the TIC S and the TIC SLT capture the very large sales of EME bonds during the market volatility of March 2020, Figure 5, but the TIC S series misses the large and quick rebound in April, as well as the net purchases later in the year as market sentiment improved further. For the year overall, the TIC S shows net sales of EME bonds whereas the TIC SLT indicates moderate net purchases, a conclusion supported by the 2020 annual survey data.
Note: Legend entries appear in graph in order from left to right.
E. Foreign Purchases of U.S. Treasury Bonds and the COVID-19 Shock
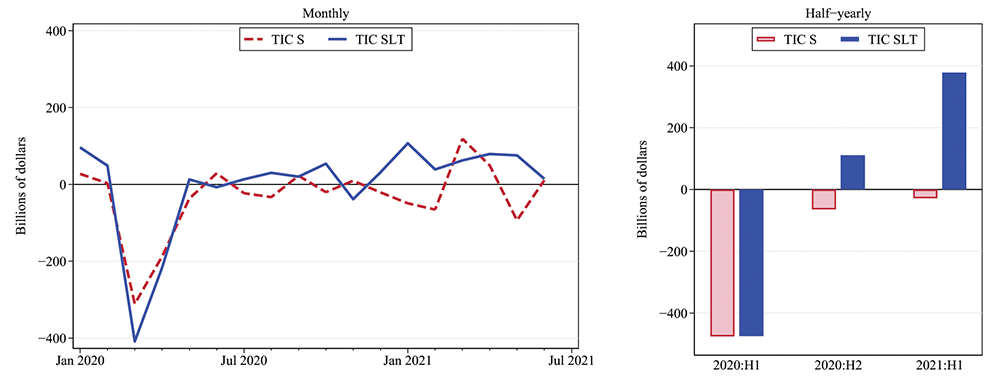
A final example shows differences in the two datasets in foreign transactions in U.S. Treasuries in response to the COVID-19 shock and subsequent policy responses (Figure 6). Both the TIC S and the TIC SLT-based estimated transactions capture the record foreign sales in March 2020 and continued sales in April. But the TIC S series misses the return to small purchases later in the year, and also misses the very strong foreign purchases in the first half of 2021.10
Note: Legend entries appear in graph in order from left to right.
3. Conclusion
Given these examples and others observed during the ten years of TIC SLT data collection, we strongly recommend that researchers use the SLT-based estimated transactions when analyzing U.S. cross-border securities flows. A data file is included with this note and monthly updates will be provided.11
In addition, we would like to alert users of these data to an upcoming change in the TIC SLT data collection. Beginning in the December 2022, the TIC SLT form will collect positions, as it does now, as well as the monthly change in the position resulting from valuation change and from securities transactions.12 13 This expanded data collection effort should result in better alignment between securities holdings and flows. Because our estimated transactions are also based on the underlying SLT data, we anticipate that users will be able to combine our estimated transactions series with the new data series to create reliable time series of flows by security type and country.
References
Bertaut, Carol, and Ruth Judson (2014), "Estimating U.S. Cross-Border Securities Positions: New Data and New Methods," International Finance Discussion Paper 2014-1113.
Bertaut, Carol, and Ralph Tryon (2007), "Monthly Estimates of U.S. Cross-Border Securities Positions," International Finance Discussion Paper 910.
Tabova, Alexandra M., and Francis E. Warnock (2021), "Foreign Investors and U.S. Treasuries", NBER Working Paper No. 29313.
Weiss, Colin (2022), "Foreign Demand for U.S. Treasury Securities during the Pandemic", FEDS Note 3046.
1. Board of Governors of the Federal Reserve System. Bertaut: [email protected]; Judson: [email protected]. Return to text
2. The TIC system also collects cross-border banking and derivatives data. TIC data are published by the Treasury at https://home.treasury.gov/data/treasury-international-capital-tic-system. Return to text
3. See Bertaut and Judson (2014). Return to text
4. SLT stands for "Securities Long-Term." In the TIC system, "long-term" securities are those with an original maturity of more than one year. Return to text
5. We do not estimate valuation change or estimated transactions for countries with very small reported positions. Return to text
6. TIC can only collect data from entities with a U.S. presence or, in the case of U.S. securities, with a designated U.S. sub-custodian. Investors can and do sometimes choose to hold their securities offshore, in institutions with no TIC reporting requirement. Return to text
7. This method is now used as the basis for the securities component of the U.S. balance of payments data. U.S. balance of payments data can and do differ from the data described here because the BEA does its own calculations of valuation change and applies other adjustments. Return to text
8. TIC data are not released for countries or items where the number of reporters is below three or when the reporting from a single reporter accounts for the bulk of the item. Return to text
9. See Tabova and Warnock (2021) and Weiss (2022) for a discussion of foreign private versus foreign official Treasury purchases and the importance of using position-consistent measures of flows to correctly assess foreign demand. Return to text
10. See Weiss (2022) for a more detailed discussion of foreign demand for Treasuries in 2020. Return to text
11. We also provide a file of similarly-constructed estimated monthly transactions and valuation change based on the Bertaut-Tryon (2007) methodology for the period 1984 – 2011 (for foreign holdings of U.S. securities) and for 1995-2011 (for U.S. holdings of foreign securities). Return to text
12. See https://www.federalregister.gov/documents/2021/06/02/2021-11599/agency-information-collection-activities-submission-for-omb-review-comment-request-treasury . Return to text
13. TIC SLT positions will continue to be published monthly. TIC S data collection will continue for a short period. The first publication of the full data from the new form will likely occur in the second quarter of 2023. Return to text
Bertaut, Carol, and Ruth Judson (2022). "Estimating U.S. Cross-Border Securities Flows: Ten Years of the TIC SLT," FEDS Notes. Washington: Board of Governors of the Federal Reserve System, February 18, 2022, https://doi.org/10.17016/2380-7172.3068.
Disclaimer: FEDS Notes are articles in which Board staff offer their own views and present analysis on a range of topics in economics and finance. These articles are shorter and less technically oriented than FEDS Working Papers and IFDP papers.