FEDS Notes
October 15, 2025
Measuring U.S. Cross-Border Securities Flows: Out With the Old, In with the New
Introduction
As we have noted in the past, understanding the effects of capital flows across countries depends critically on accurate and comprehensive data. For the U.S., data on cross-border securities holdings and transactions are collected through the TIC (Treasury International Capital) data system. Prior to the introduction of the new TIC form SLT in late 2022, it was difficult to reconcile the TIC data on securities holdings with the TIC S transactions data (see Bertaut and Tryon (2007) and Bertaut and Judson (2014, 2022)). As a result, for several years, the most reliable portfolio securities flow data used internally at the Federal Reserve and in the official U.S. balance of payments data were based on estimates calculated from reported holdings data. In that approach, we estimated transactions based on changes in reported positions after backing out estimates of valuation change and accounting for other changes—that is, without any use of the collected transaction data (Bertaut and Judson (2022)).
The new SLT form introduced in late 2022 included improved reporting on transactions as well as measurements of valuation change, with the new transactions data first published in early 2023 and the new valuation change data first published in early 2024.1 As we hoped in Bertaut and Judson (2023), the first two years of data indicate that the collected data eliminate the need for the estimates we have been producing. This note provides comparisons of the estimated and measured transactions and valuation change data and provides guidance to researchers. A separate forthcoming note will provide longer time series data linking older series, the Bertaut-Judson estimates, and newer SLT data. This dataset will likely also become available in FRED, allowing easy access for researchers.
Section 1 presents a very brief overview of the new TIC SLT. Section 2 presents summary statistics comparing recent SLT transaction data with our previous "estimated transactions" approach, and recent SLT valuation change data with our previous valuation change estimates. Both sets of errors are generally small relative to reported positions. Section 3 presents time series plots of these series and shows that there are nonetheless cases where the differences between our estimates and the new measured data are substantial. We show that these errors are often negatively correlated, which is an artifact of our transactions estimation method. Section 4 provides our suggested guidance for assembling a consistent time series across these different data collections.
I. The TIC Data Collection System and the New SLT
The original TIC SLT form collected monthly data on cross-border positions in long-term securities at market value by country of holder for U.S. liabilities to foreigners and by country of issuer for U.S. claims on foreigners. Given the long-standing difficulties in reconciling changes in holdings with measured transactions, the Treasury, Federal Reserve Board, Federal Reserve Bank of New York, and the Bureau of Economic Analysis collaborated to develop an "expanded" SLT form that would integrate transaction and holding reporting and would collect valuation change information directly from reporters.2 This expanded SLT form began data collection in November 2022. Because this new form subsumed TIC S transaction reporting, the TIC S became redundant and was discontinued after an "overlap" period of three months (November 2022 through January 2023).3
The expansion of the SLT form had three major purposes. First, the form collects positions, transactions, and valuation data on the same basis from the same reporting panel, which should allow for much easier reconciliation of changes in position and transactions and should reduce or eliminate the transactions bias inherent in the TIC S data.4 Second, to reduce reporter burden, the original SLT's separate "A" and "B" forms for custodians and issuers and end investors have been combined.5 Third, the new SLT data on valuation change allows for a more complete picture of the factors contributing to changes in holdings.
In the new form, each security type has columns for positions, gross purchases and sales, and valuation change. Note that since the original SLT collected data on foreign sovereign and corporate bonds separately, transactions data are now also collected with this breakdown. The new form's sign conventions have also been altered so that purchases and sales are reported from the perspective of the cross-border investor. The full form can be found at Treasury: New TIC SLT form (PDF).
Importantly, the new TIC SLT form does not require that changes in holdings equal net transactions and valuation change. As in the calculation of estimated transactions described above, changes in position can also occur due to "other changes" such as custody shifts among custodians or outside the TIC reporting universe, stock swaps, and other events.6 Part of the editing and data review conducted by the Federal Reserve Bank of New York and Federal Reserve Board is reviewing "other changes" implied by the difference between change in position and the sum of net transactions and valuation change. In the case of large gaps, reporters are consulted, and in some cases, a series break entry is created for holdings.
II. Summary Statistics Comparing Estimated and Measured Net Transactions and Valuation Change
A. TIC SLT Net Transactions Data Relative to Estimated Transactions
Table 1 summarizes the mean absolute differences between estimated and measured SLT transactions in dollar value (the left column) and relative to measured position (the right column). That is, each table entry indicates the absolute value of the average difference between the estimated and measured transactions.
Table 1. Mean Absolute Differences between Estimated and Measured SLT Transactions February 2023 – July 2025
| Billions of dollars | Difference / Position (%) | |
|---|---|---|
| 1. Treasuries: Official | 5.9 | 0.2 |
| 2. Treasuries: Private | 21.8 | 0.6 |
| 3. Agencies: Official | 2.1 | 0.3 |
| 4. Agencies: Private | 9.0 | 1.3 |
| 5. Treasuries: Total | 21.8 | 0.3 |
| 6. Agencies: Total | 9.4 | 0.7 |
| 7. U.S. corporate bonds | 16.6 | 0.4 |
| 8. U.S. equity | 85.4 | 0.5 |
| 9. Foreign government bonds | 5.7 | 0.8 |
| 10. Foreign corporate bonds | 16.8 | 0.6 |
| 11. Foreign equity | 65.8 | 0.6 |
The differences are generally small, ranging from 0.2 to 1.3 percent of measured value. The smallest differences are for officially-held Treasuries and agencies, and the largest differences (especially in dollar terms) are for U.S. and foreign equities and foreign and U.S. corporate bonds. The larger differences for corporate and foreign securities are not that surprising because valuation change is generally more volatile and harder to measure for these security types. There are also differences for privately-held Treasuries and agencies that are a bit more surprising but in general appear to be driven by a few anomalous observations. These differences are sometimes resolved with subsequent data revisions, but the lags can be six months to a year or even more.
B. TIC SLT Valuation Change Data Relative to Estimated Valuation Change
Table 2 summaries the mean absolute errors between measured and estimated valuation change, again by dollar value and relative to positions. Relative to positions, the differences are still small, under 1%, with the larger values in both dollar values and relative to positions for corporate securities in general and equities in particular. Equity valuation is especially difficult to estimate for two reasons. First, a great deal of equity is in the form of funds and "other" equity, for which direct price information is often scarce and not well represented by stock prices because funds include other assets such as bonds, commodities, and real estate. Second, on the claims side, some countries' equity includes firms that are legally incorporated in that country and thus collected against that country on the SLT, but these firms are excluded from standard country-level stock price indexes because their center of operations are elsewhere, making the country-level stock indexes a poor estimate of price movements on the actual portfolios held. Estimating corporate and foreign bond price movements is also more challenging (and prone to error) than for U.S. government securities because corporate and foreign securities can be denominated in currencies different from that of the issuing country, introducing potential error from exchange rate fluctuations.
Table 2. Mean Absolute Differences between Estimated and Measured Valuation Change February 2023 – June 2025
| MAE ($B) | MAE/Position (%) | |
|---|---|---|
| 1. Treasuries | 13.5 | 0.2 |
| 2. Agencies | 5.8 | 0.4 |
| 3. U.S. corporate bonds | 15.3 | 0.4 |
| 4. U.S. equity | 99.4 | 0.6 |
| 5. Foreign bonds | 17.7 | 0.5 |
| 6. Foreign equity | 73.6 | 0.6 |
III. Time Series Overview of Estimated and Measured Net Transactions and Valuation Change
The data above indicate that on average, the estimated transactions and valuation change were close to the measured values. Below we show time series of the estimated and measured time series for net transactions (Figure 1) and valuation change (Figure 2).
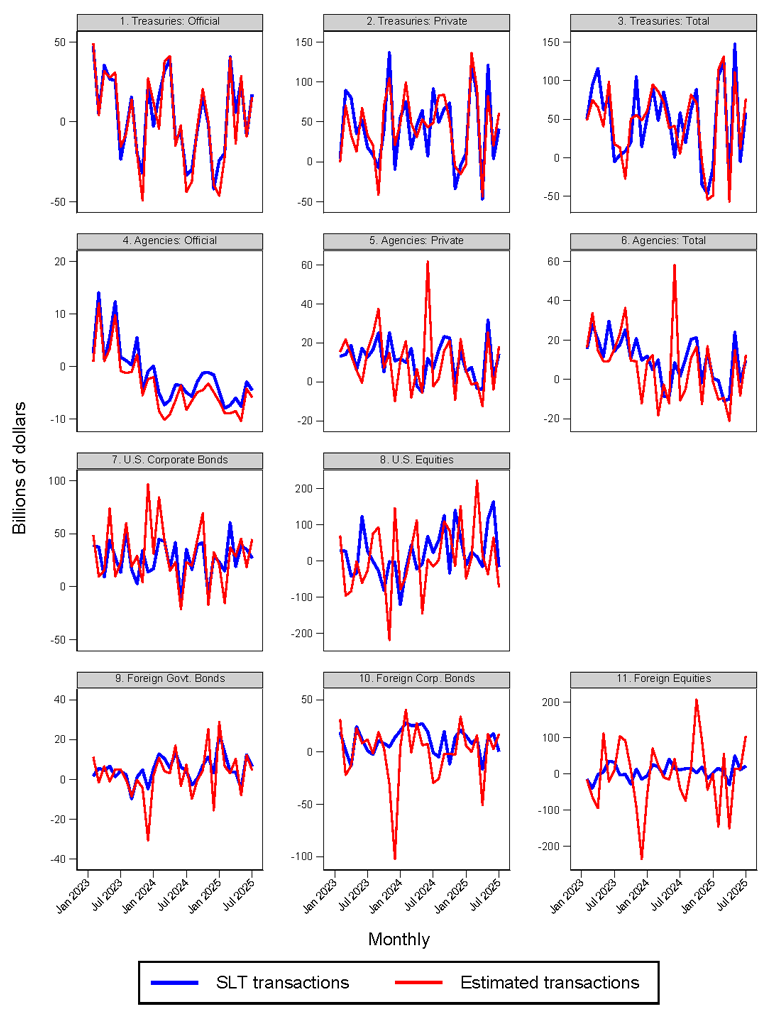
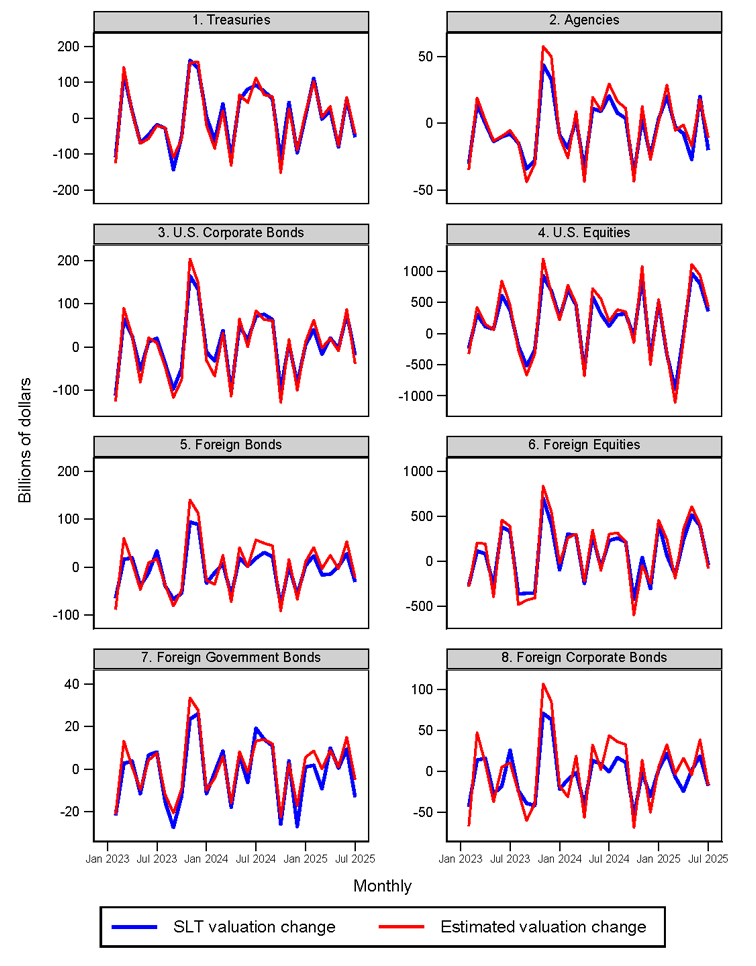
Valuation change (Figure 2) generally tracks quite closely while net transactions (Figure 1) are typically the right sign but show some larger differences. Note that the scales for each panel are different, and the largest differences for net transactions are for U.S. and foreign equities. Not coincidentally, U.S. and foreign equities have the largest monthly movements in valuation change. Here it is important to recall that our estimated transactions are calculated as a residual—the difference between position change and valuation change (and, when known, "other changes"). It follows that large misses in estimated valuation change are likely associated with large errors in the opposite direction in estimated transactions. Indeed, there is a systematic negative correlation between these two sets of errors, as shown in Table 3 and Figure 3. All of these correlations are strongly statistically significant.
Table 3. Correlations between Difference between Estimated and Measured Valuation Change and Difference between Estimated and Measured Net Transactions February 2023 – July 2025
| Country level | Total | |
|---|---|---|
| 1. Treasuries | -0.32** | -0.37* |
| 2. Agencies | -0.35** | -0.47** |
| 3. U.S. corporate bonds | -0.74** | -0.57** |
| 4. U.S. equity | -0.82** | -0.93** |
| 5. Foreign bonds | -0.67** | -0.55** |
| 6. Foreign equity | -0.94** | -0.95** |
Note: * and ** indicate statistical significance at the 1% and 5% levels respectively.
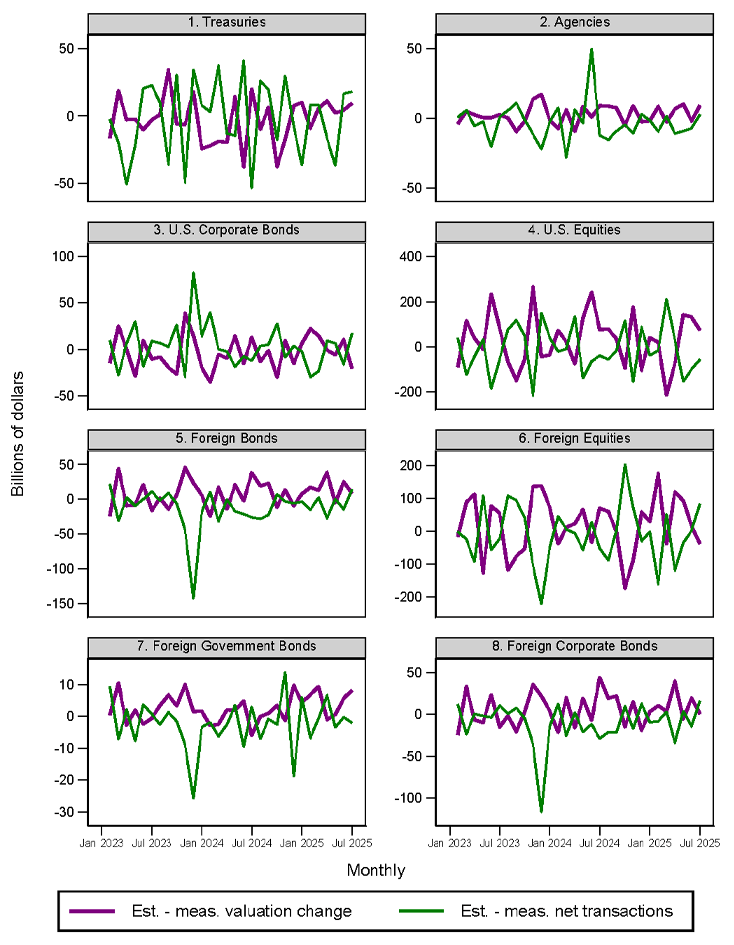
These results indicate that our valuation estimates, while generally tracking measured monthly valuation change, were not perfect and indeed sometimes generated substantial errors in estimated transactions. The good news is that, on balance, these errors were small relative to holdings.
IV. Advice for researchers
Our advice for researchers seeking a consistent time series of monthly holdings data remains the same as in Bertaut and Judson (2022 and 2023): we recommend use of Bertaut-Tryon estimated positions through 2011 and SLT reported positions thereafter. For transactions and valuation change, we are now confident recommending that researchers use the Bertaut-Judson (2022) transactions through January 2023 and the (new) SLT reported transactions thereafter. The final dataset for estimated transactions, which runs through July 2025, is linked to our 2022 note, The Fed - Estimating U.S. Cross-Border Securities Flows: Ten Years of the TIC SLT.
References
Bertaut, Carol C., Beau Bressler, and Stephanie Curcuru (2019). "Globalization and the Geography of Capital Flows," Federal Reserve Board: FEDS Note, October 2019.
Bertaut, Carol, and Ruth Judson (2014), "Estimating U.S. Cross-Border Securities Positions: New Data and New Methods," Federal Reserve Board: International Finance Discussion Papers, August 2014.
Bertaut, Carol, and Ruth Judson (2022), "Estimating U.S. Cross-Border Securities Flows: Ten Years of the TIC SLT," Federal Reserve Board: FEDS Note, February 2022.
Bertaut, Carol, and Ruth Judson (2023), "Measuring U.S. Cross-Border Securities Flows: New Data and A Guide for Researchers," Federal Reserve Board: FEDS Note, October 2023.
Bertaut, Carol C., and Ralph Tryon (2007), "Monthly Estimates of U.S. Cross-Border Securities Positions," Federal Reserve Board: International Finance Discussion Papers 2007-910.
McCallum, Andrew, Laura DeMane, Nyssa Kim, Emily Liu, and Andrew Loucky (2024), "Introducing New Valuation Change Data for U.S. Cross-Border Portfolio Holdings," Federal Reserve Board: FEDS Note April 18, 2024.
1. See Bertaut and Judson (2023) for a discussion of the changes to the SLT form and a first look at the new transactions data. See McCallum, DeMane, Kim, Liu, and Loucky (2024) for a discussion and first look at the TIC SLT valuation change data. Return to text
2. The new form was announced in the Federal Register (PDF). Return to text
3. Transactions data published by the Treasury used TIC S data through January 2022 and then shifted to using new TIC SLT data for the end-February 2023 as-of date. Return to text
4. As with the TIC annual surveys and the original SLT, however, the new SLT cannot address custodial bias (the reported holdings by non-resident clients in major custodial centers such as Belgium and Switzerland) or the distortions posed by incorporation in financial centers (see Bertaut, Bressler, and Curcuru (2019)). Return to text
5. This change was made because nearly every reporter has reporting heavily concentrated in either custodial holdings or issuer/end-investor holdings, and it is possible to make this distinction based on annual SHL/SHL survey responses. Return to text
6. TIC can only collect from reporters with a U.S. presence, and some investors can and do hold securities either directly or with custodians that have no U.S. subcustodial relationship. Return to text
Bertaut, Carol, and Ruth Judson (2025). "Measuring U.S. Cross-Border Securities Flows: Out With the Old, In with the New," FEDS Notes. Washington: Board of Governors of the Federal Reserve System, October 15, 2025, https://doi.org/10.17016/2380-7172.3935.
Disclaimer: FEDS Notes are articles in which Board staff offer their own views and present analysis on a range of topics in economics and finance. These articles are shorter and less technically oriented than FEDS Working Papers and IFDP papers.