FEDS Notes
April 18, 2024
Introducing New Valuation Change Data for U.S. Cross-Border Portfolio Holdings
Andrew H. McCallum, Laura DeMane, Nyssa Kim, Emily Liu, Andrew Loucky1
Introduction
The most comprehensive data on cross-border capital holdings for the United States come from the Treasury International Capital (TIC) system. These data inform the official U.S. balance of payments statistics and are crucial for understanding U.S. capital flows, their causes, and their effects on the U.S. economy. The U.S. Treasury and Federal Reserve recently began publishing valuation changes as part of the new expanded Securities Long-Term form (TIC SLT).2 Valuation changes are gains or losses from revaluing securities holdings at current market prices, as well as those from revaluing foreign-currency-denominated securities to dollar prices using spot exchange rates.
The SLT now collects, on a single form and directly from the same reporters, the level of cross-border long-term securities holdings and changes in holdings due to purchases, sales, valuation, and other reasons, thereby providing a more accurate portrayal of U.S. portfolio flows. This note highlights the new SLT valuation change data, first published by the U.S. Treasury in April 2024 back to February 2023.3 It documents the new SLT valuation change data and shows that such data are crucial for accurately decomposing the changes in cross-border holdings attributed to net U.S. sales and purchases versus those attributed to valuation and other changes. It also compares these reported valuation changes with estimated valuation changes that use price indexes.
Decomposition of Changes in Holdings
The change in foreign holdings reported by custodians, issuers, and end-investors can be decomposed into a) valuation change due to price, plus b) net U.S. sales to foreigners, plus c) other changes as,
$$$$ \Delta Holdings_t = \Delta Valuation_t + Net \ U.S. \ Sales_t + \Delta Other_t \ , (1) $$$$
in which $$ Net \ U.S. \ Sales_t = U.S. \ Sales_t – U.S. \ Purchases_t $$. The right-hand side of Equation (1) reports sales and purchases from the U.S. perspective. As such, when U.S. sales to foreigners are greater (less) than U.S. purchases from foreigners, foreign holdings of U.S. securities increase (decrease). "Other changes" in holdings is a residual and can include custody shifts, stock swaps, and other reasons. Details about the U.S. perspective, examples for how reporters fill out the SLT form, and more details about "other changes" are given in the appendix below.
Interpreting a change in holdings as sales or purchases can be misleading. Figure 1 decomposes changes in foreign holdings of long-term U.S. Treasuries (UST) into three parts using Equation (1). After accounting for offsetting valuation changes (yellow bars), net U.S. sales (green bars) were positive in every month shown despite changes in foreign holdings of UST swinging from positive to negative throughout the period (black dots).
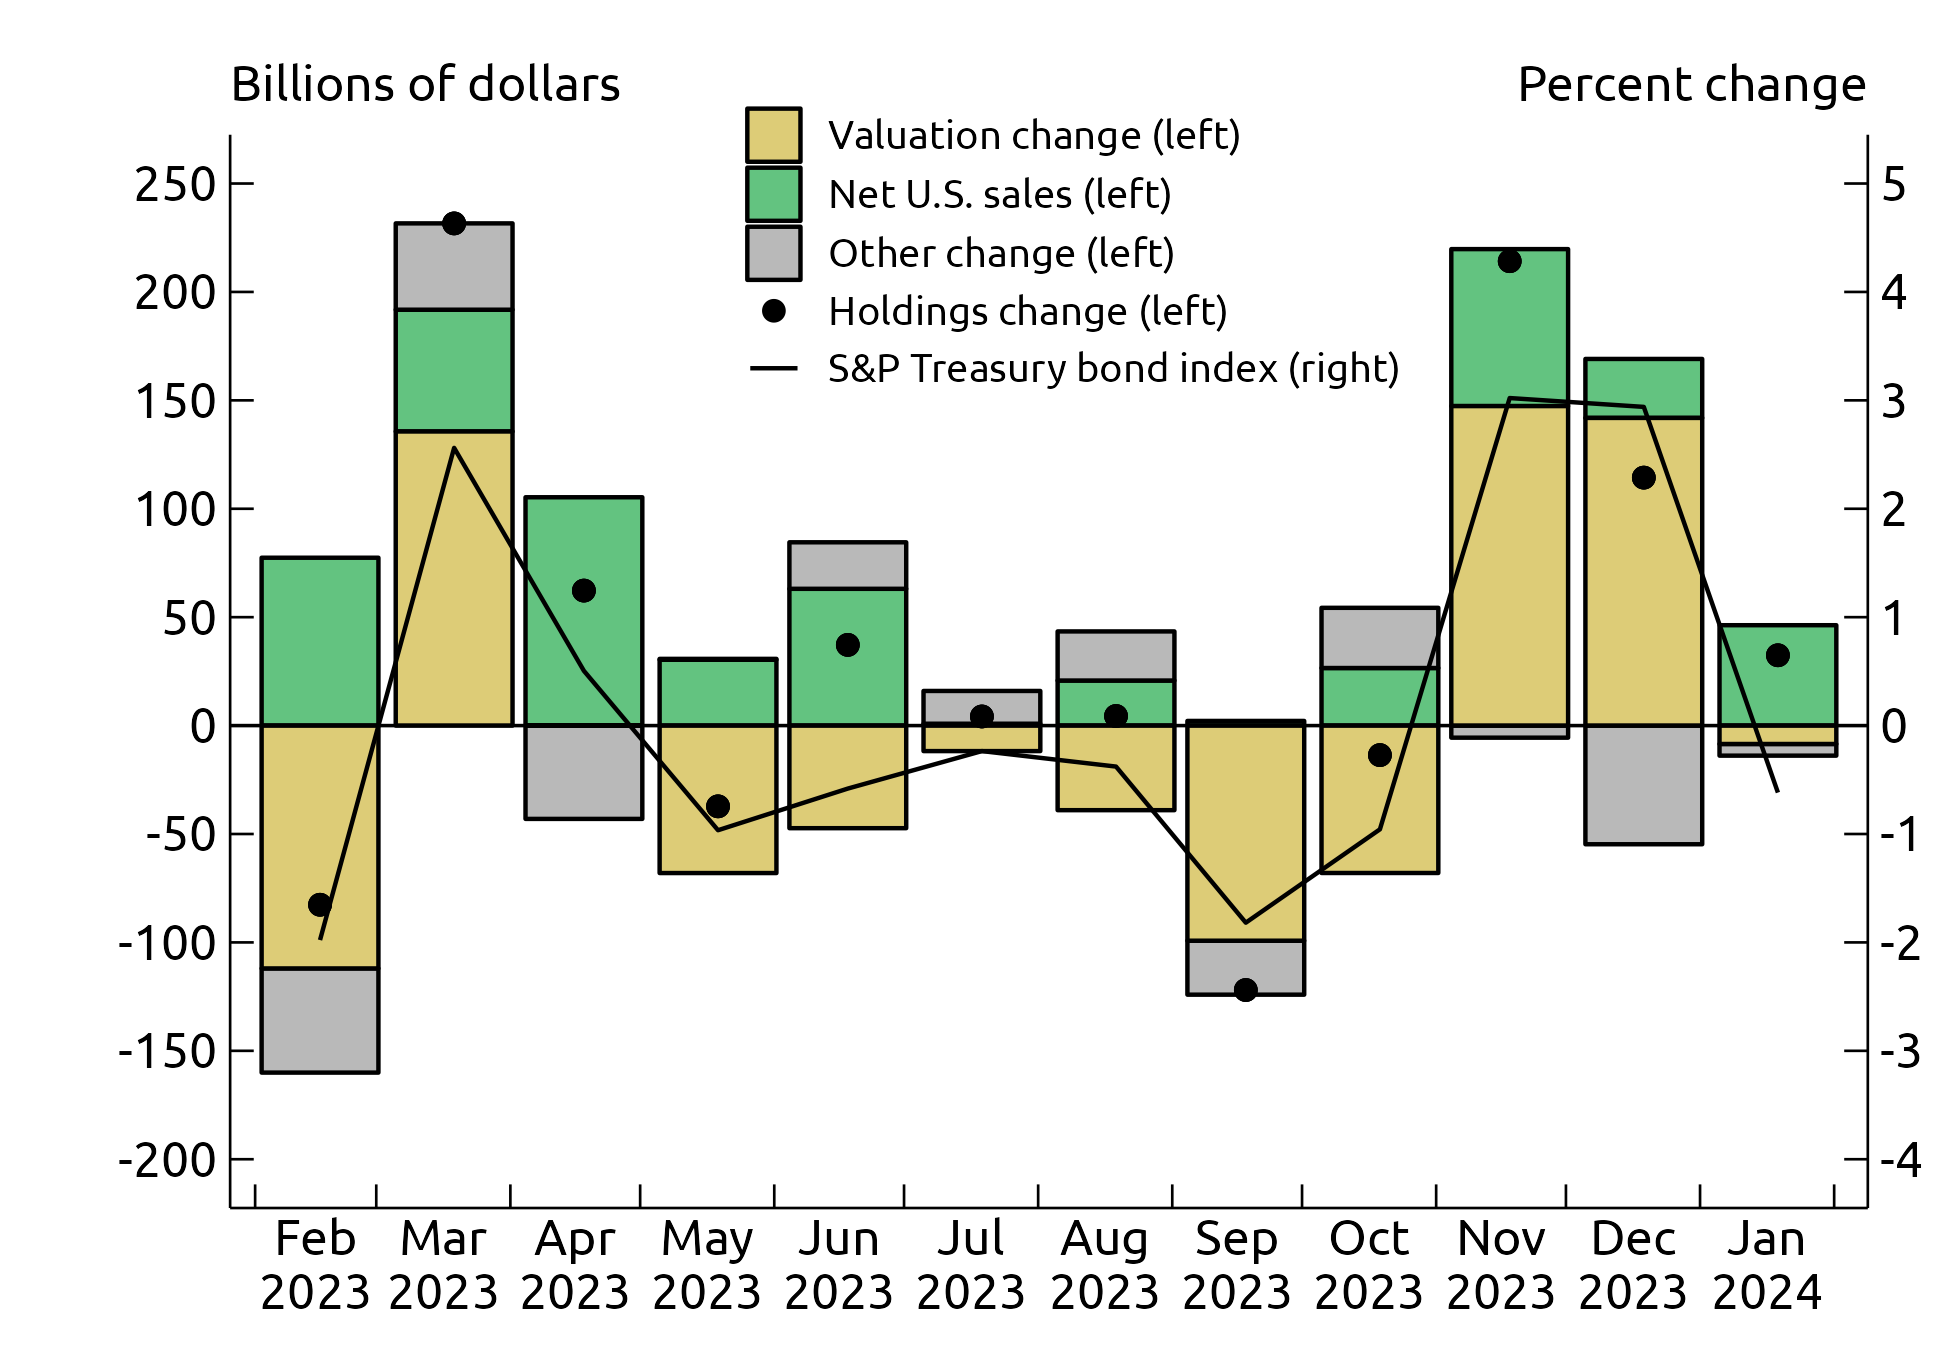
In May 2023, for example, net U.S. sales to foreigners were positive, but valuation and holdings changes were negative. During that month, incoming economic data for the U.S. showed the resilience of the economy and led to an upward revision to the market-implied path for the expected federal funds rate and a decline in Treasuries prices (black line).4 Those price declines correspond closely to valuation loss (yellow bar) and more than offset the $30 billion in net U.S. sales of UST to foreigners (green bar), leading to a decline in foreign holdings of Treasuries (black dot).
Accounting for valuation changes is also important when accurately evaluating net U.S. sales of UST to specific foreign countries. Using May 2023 again as an example, Figure 2 decomposes holdings changes for the 20 countries in the widely watched Major Foreign Holders (MFH) table.5 The MFH includes long- and short-term Treasuries, but Figure 2 omits short-term because they are not included on the SLT. The MFH has long been used to draw conclusions about specific countries' appetite for UST with emphasis on the largest holders, currently, Japan, China, and the United Kingdom.
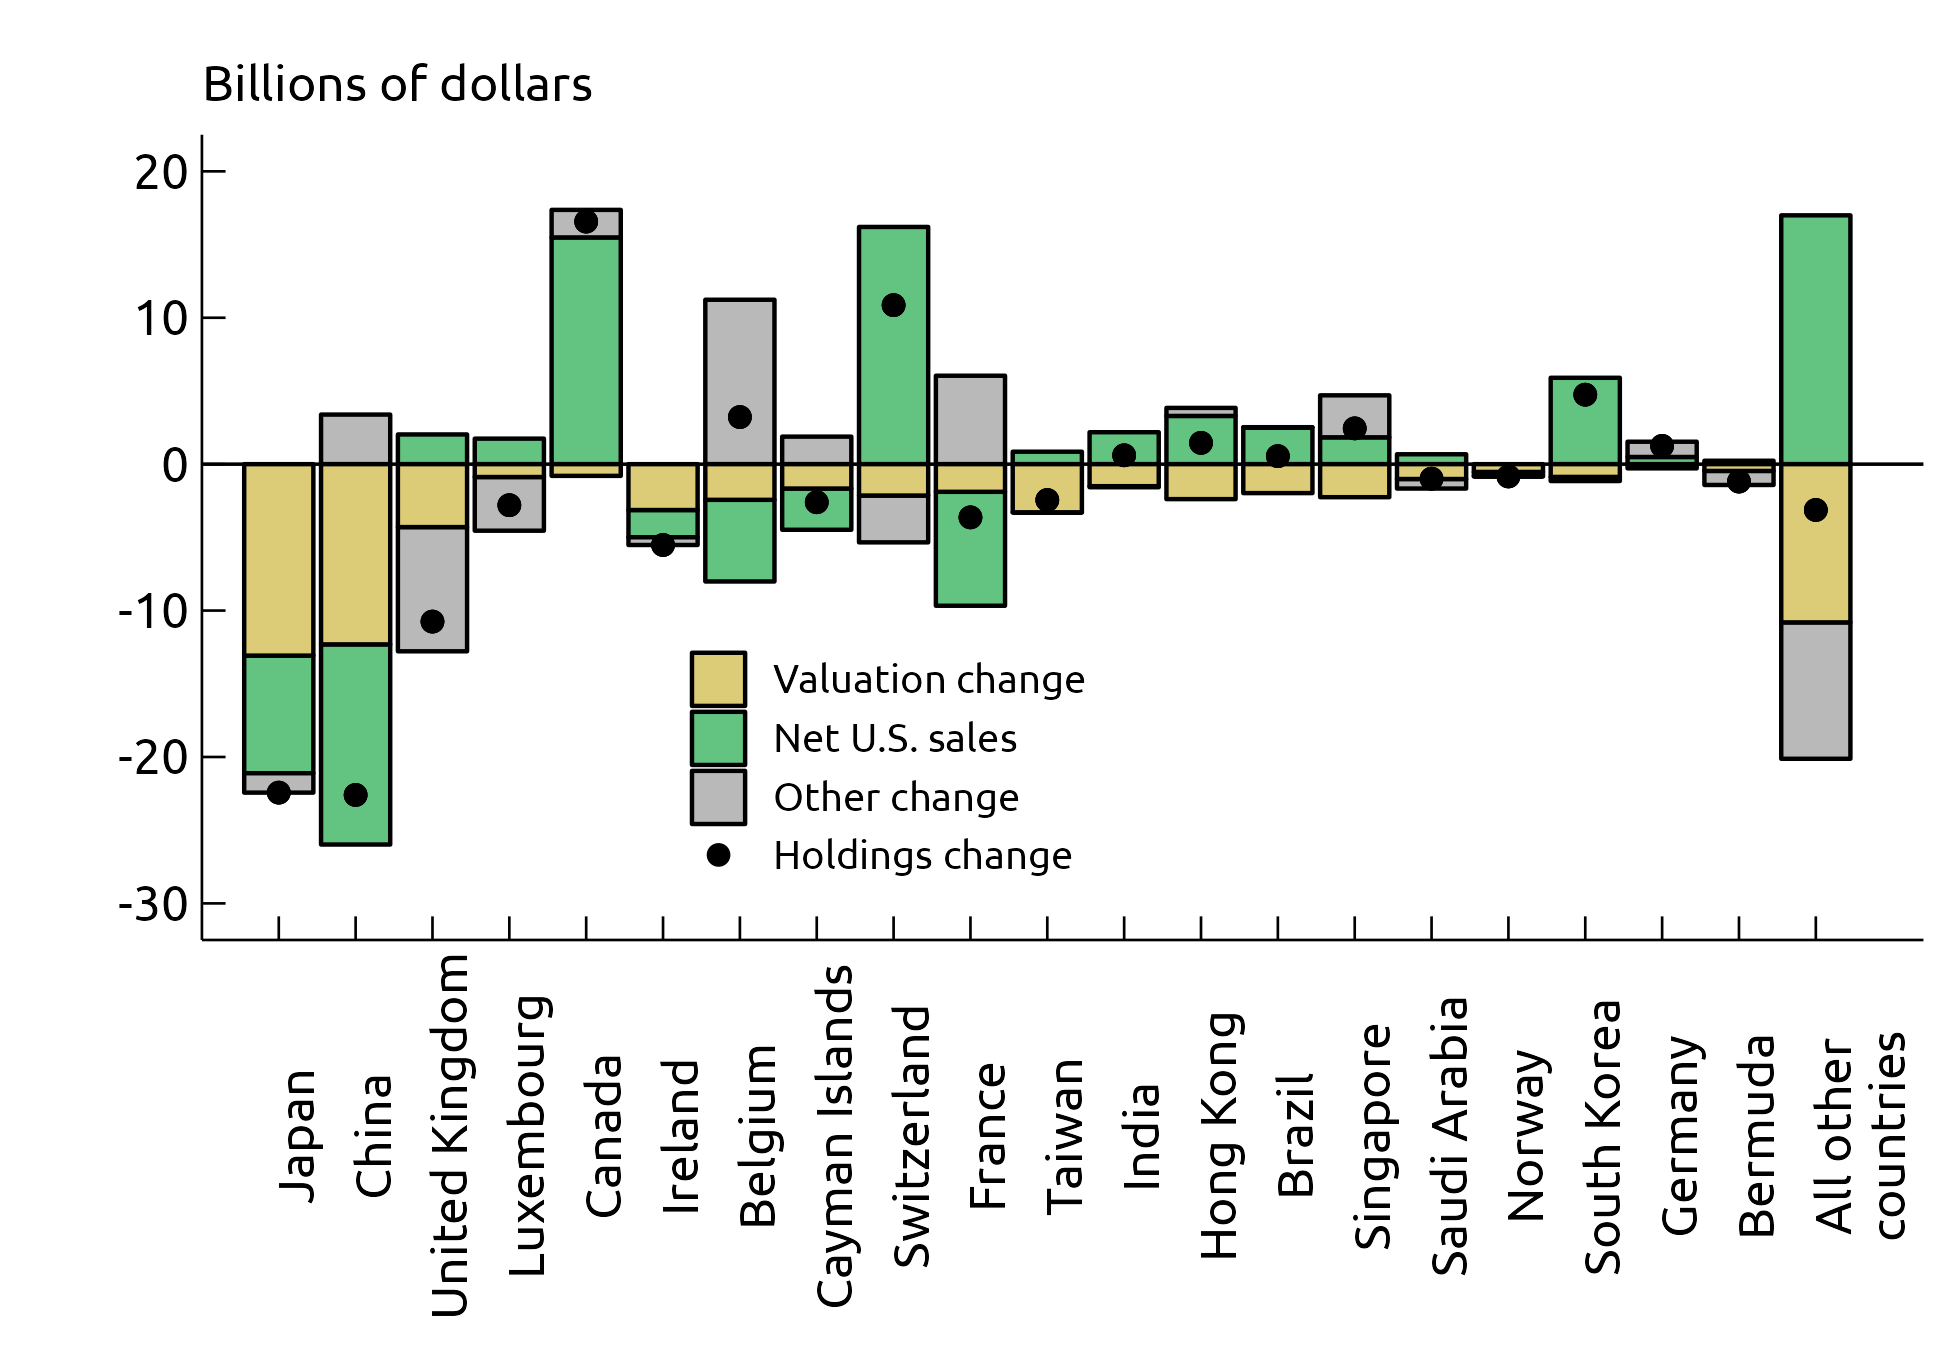
Figure 2 shows that net UST sales to countries including Canada, Switzerland, and "All other countries," among others, were strong and together more than offset negative net U.S. sales to multiple countries including Japan and China.
Figure 2 has other important implications. For Japan and China, roughly half of the decline in holdings of Treasuries during this period is accounted for by valuation losses. Valuation losses vary substantially for countries that have similar levels of holdings, such as Luxembourg and the United Kingdom, implying that the mix of UST held by each country also differs substantially. Differing portfolio compositions in each country imply that reported valuation change, when available, will be a better measure of true valuation change than price-index based estimated valuation change.
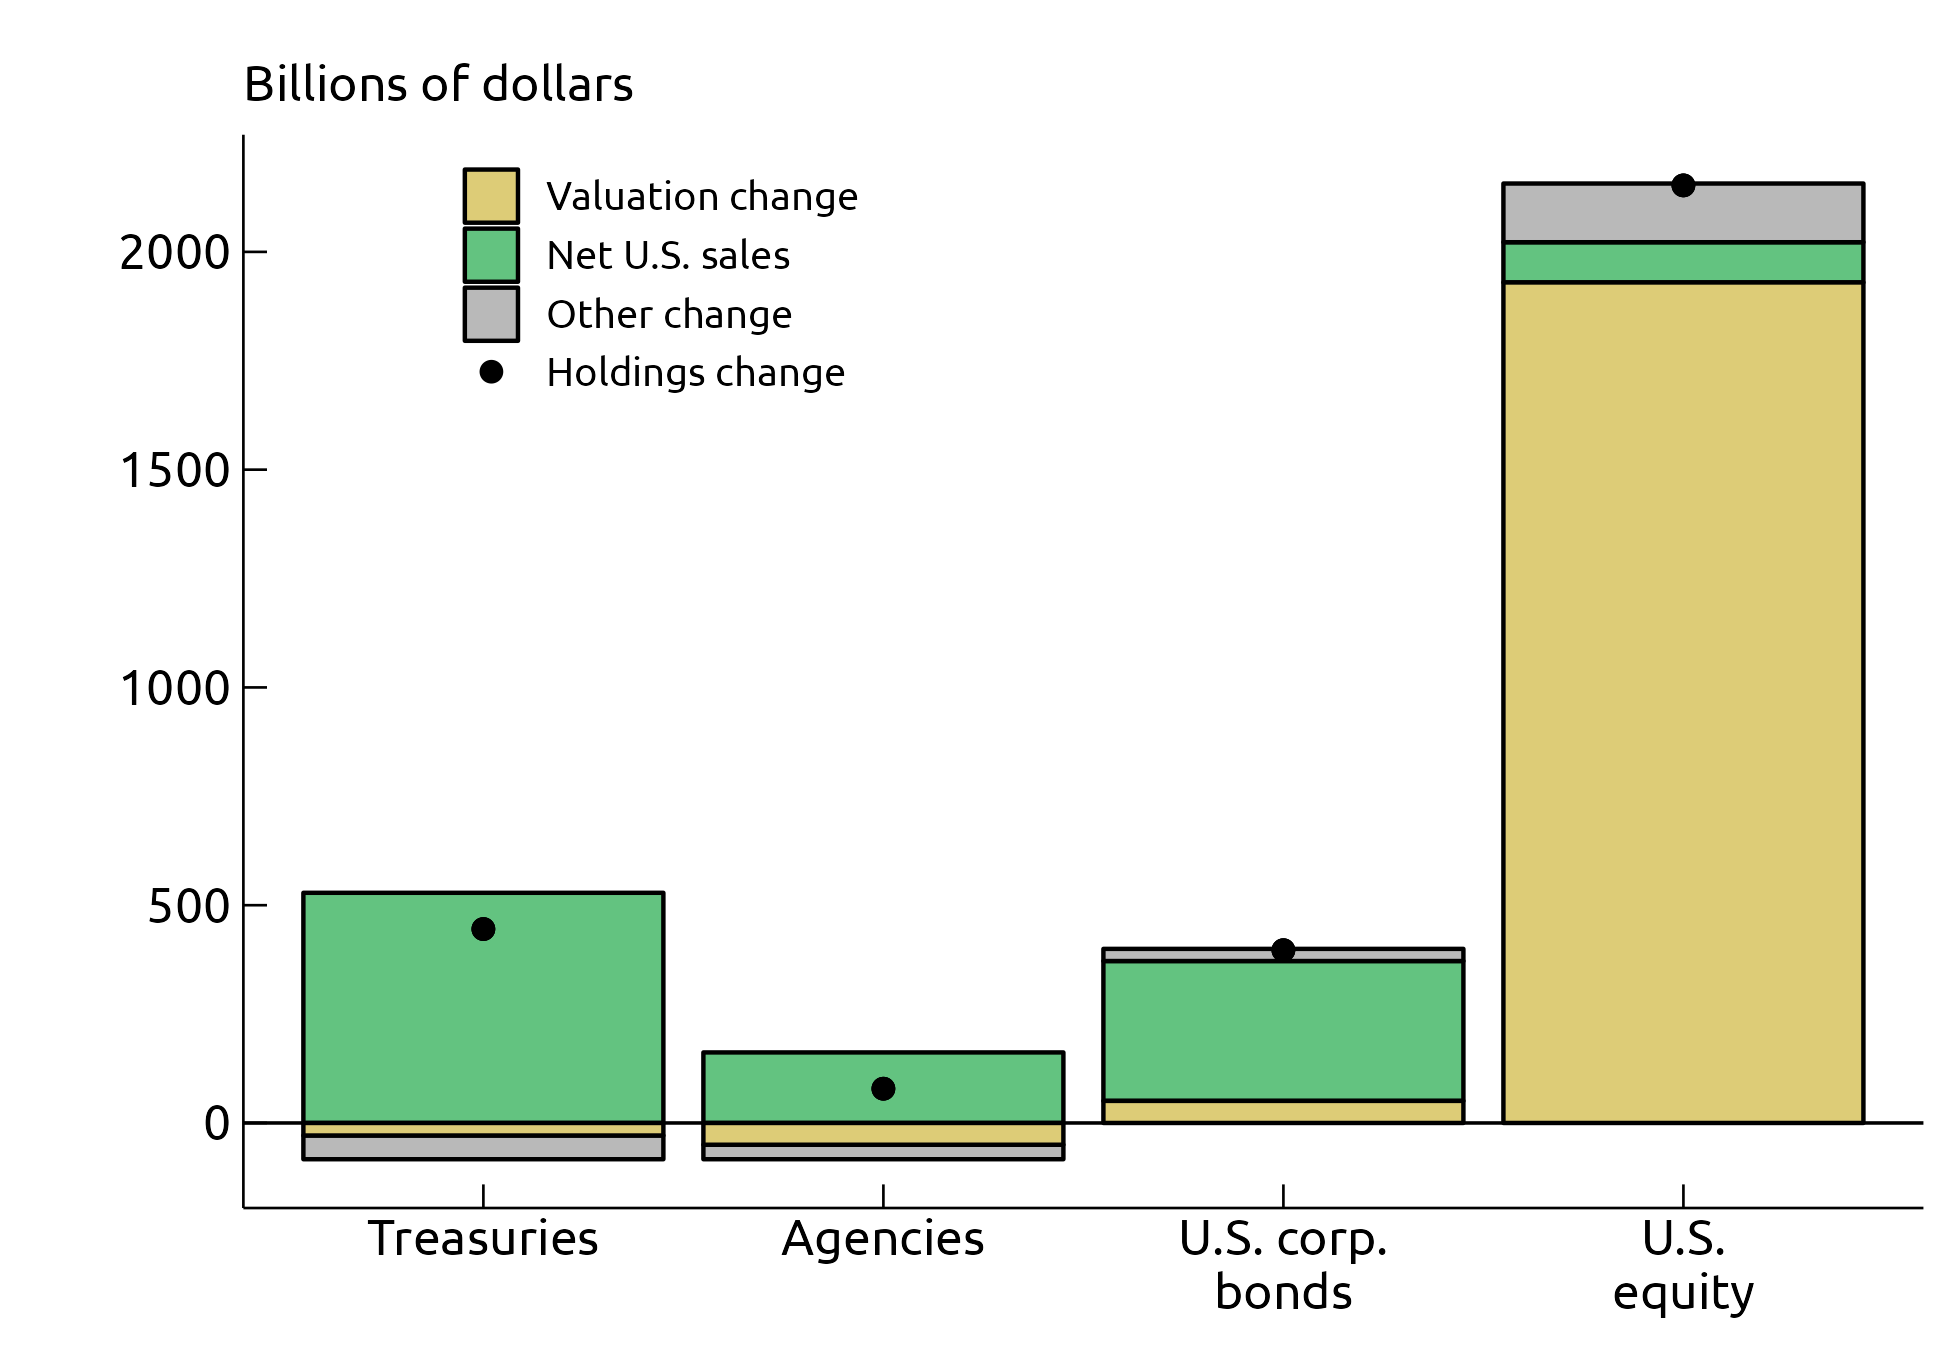
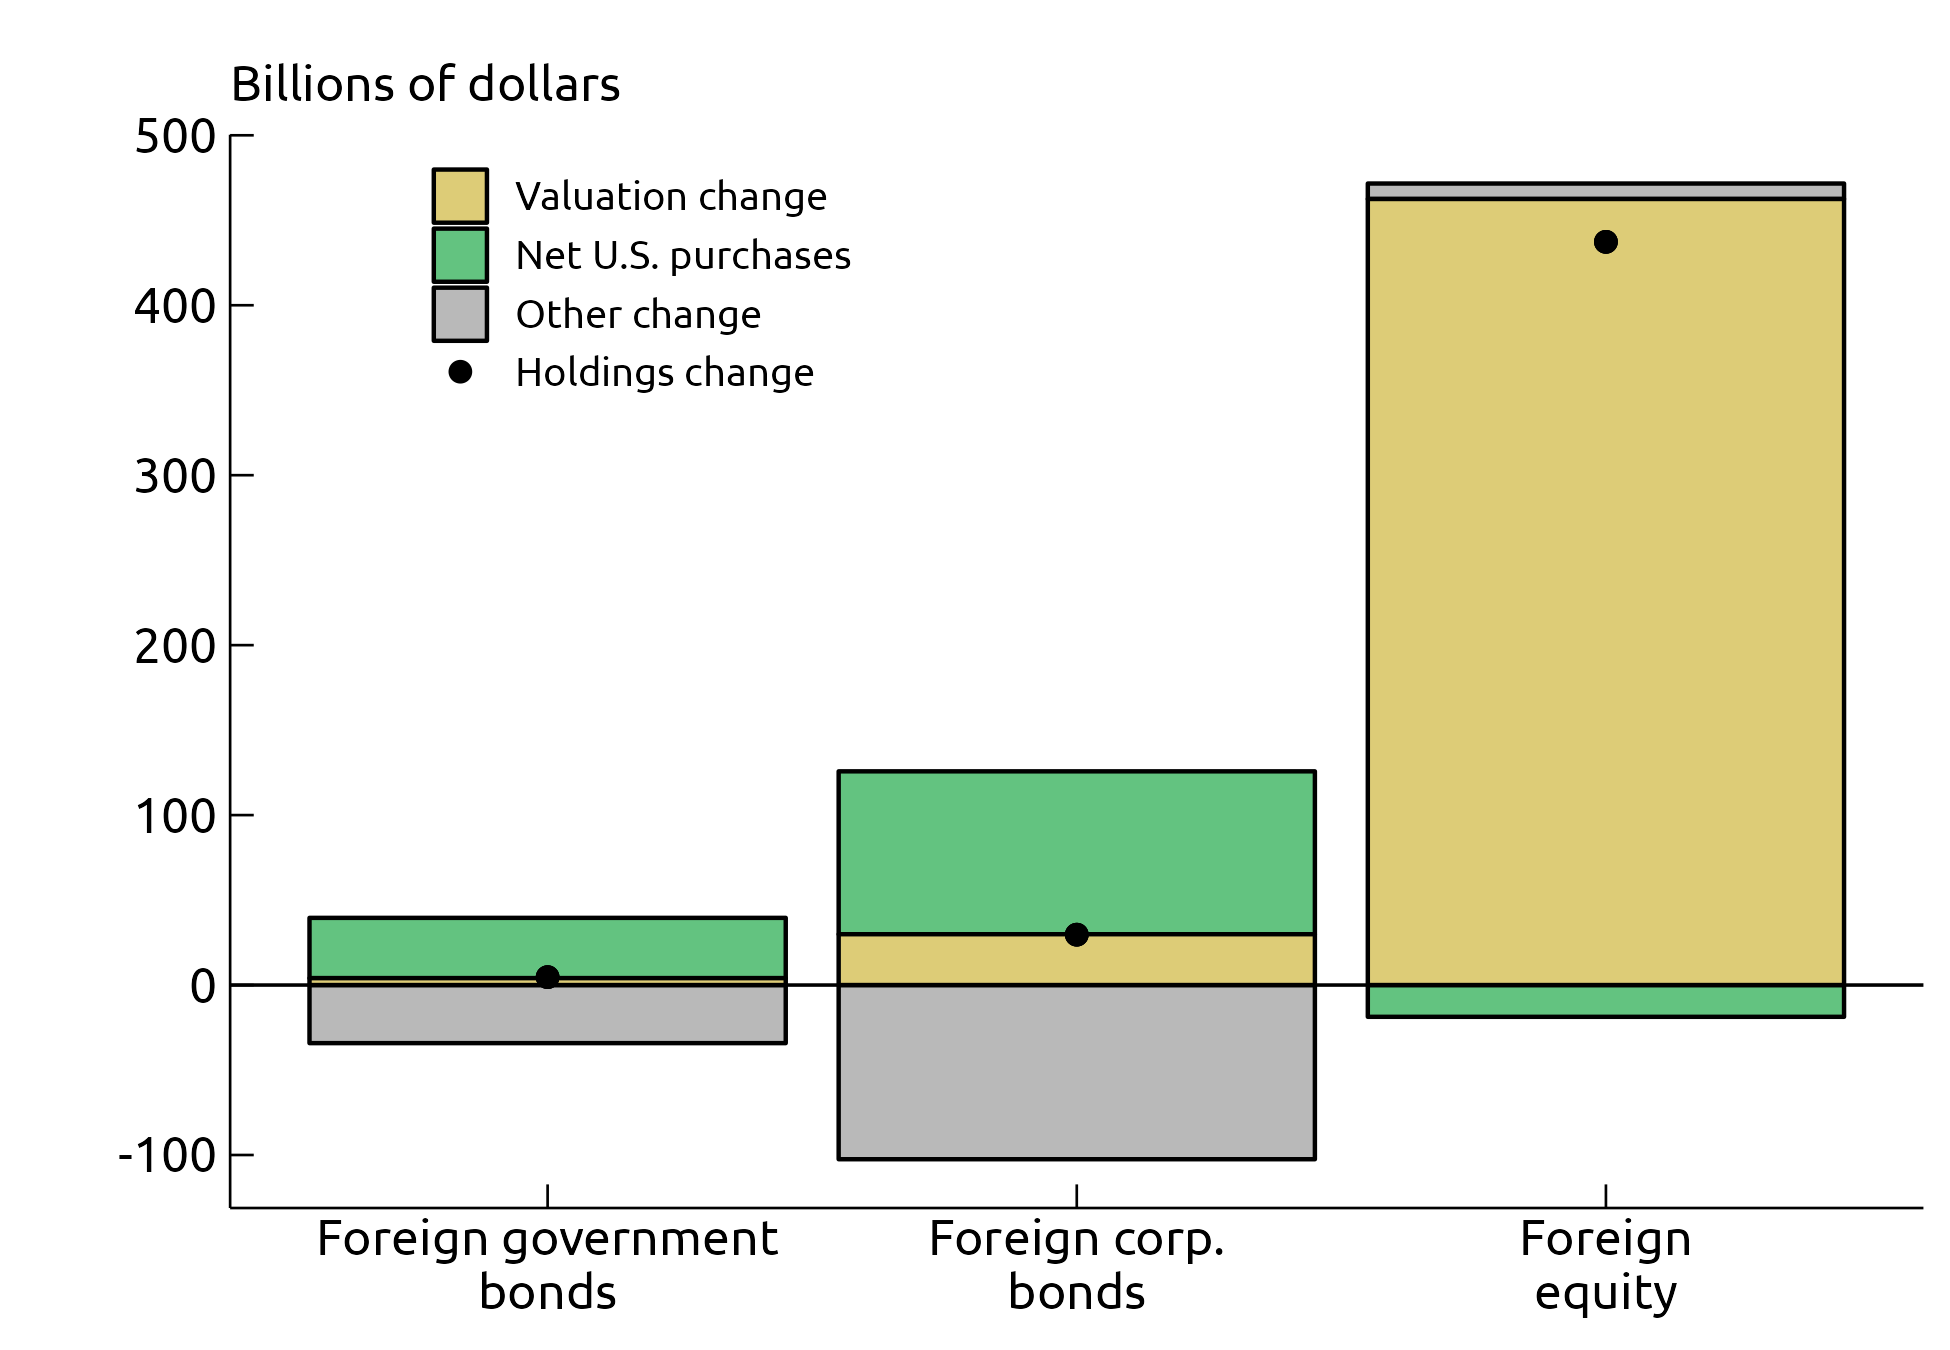
Valuation changes in themselves can be so large that they affect the economy directly (for example, via wealth effects) and they can account for most of the change in holdings, especially for equities. Valuation change for foreign holdings of U.S. equity was a massive $1.9 trillion between February 2023 and January 2024 and accounts for nearly all the change in holdings (Figure 3). Valuation change for U.S. holdings of foreign equity was also very large at about $460 billion over this period (Figure 4).6 Bond prices are typically less volatile than equites prices. As such, valuation changes typically make a smaller contribution to changes in bond holdings than to change in equity holdings, an example of which is in Figures 3 and 4.
Comparing Estimated to Reported Valuation Changes
Because of the important role that valuation change plays in understanding portfolio flows, before being collected on the SLT, researchers estimated valuation change by applying changes in benchmark indexes to securities holdings.7 To gauge the accuracy of these estimated valuation changes, we compare them to those reported on the SLT.
Averaging over country-month observations, the absolute value of the difference between estimated and reported valuation changes are small, and tiny in comparison to holdings.8 Figure 5 shows the country and security-type pairs that have the largest Root Mean Square Errors (RMSE).9 A larger RMSE implies a greater average discrepancy between the estimated and reported valuation changes.
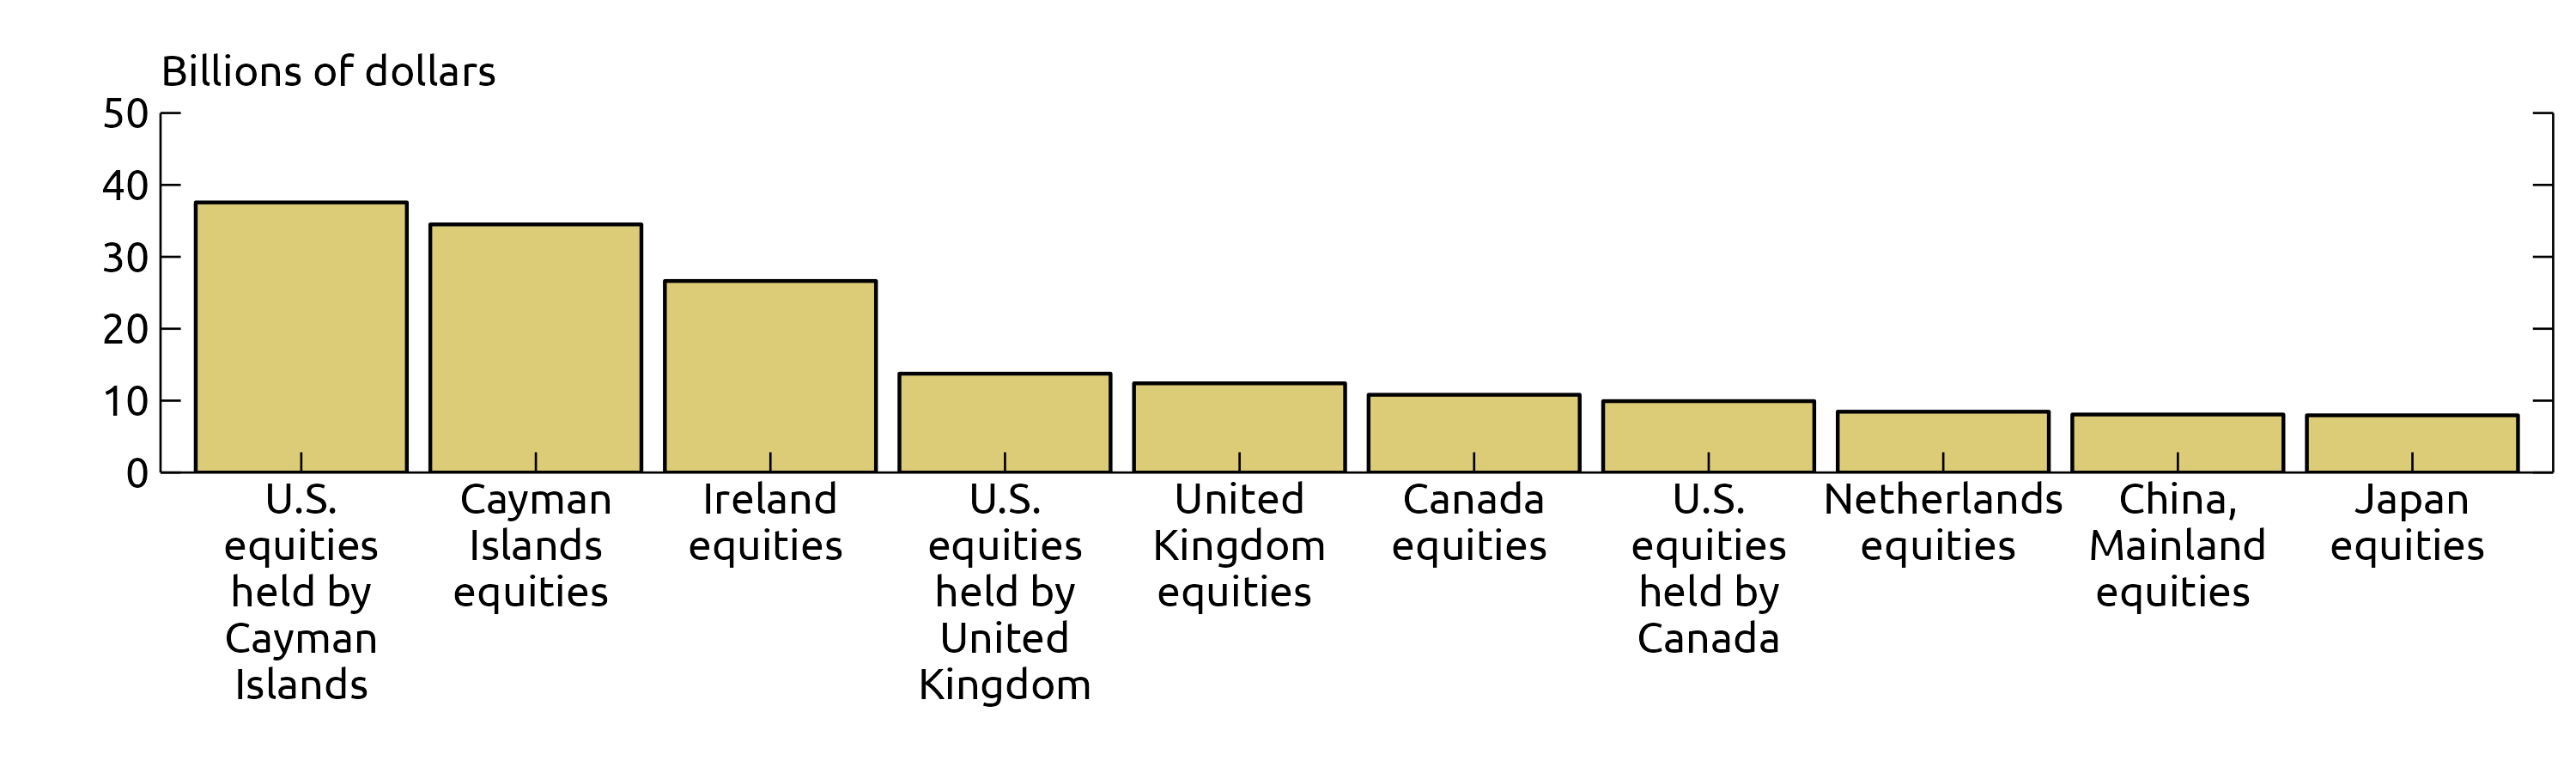
The biggest RMSEs are for the Cayman Islands and Ireland, financial center countries known as tax havens where a number of multinational firms are incorporated. The Cayman Islands and Ireland are also popular domiciles for hedge funds, mutual funds, exchange-traded funds, and other investments funds. The prices of the fund shares issued in these countries are determined by the prices of the underlying assets in the funds' portfolios, which are predominantly non-domestic securities and are thus also not reflected in the domestic equity indexes of these countries. Combining the effects of multinational incorporation and fund shares in 2022, an estimated 86 percent of Ireland's equity and 95 percent of Cayman Island's equity reflects exposure to other countries.10 Because estimates of valuation changes mainly use domestic equity indexes, those estimates do not capture price changes of equities that trade on non-domestic exchanges, leading to a large RMSE. Given these and other limitations in estimating valuation changes using benchmark indexes, we recommend that researchers use reported valuation changes that are now available in the TIC data whenever possible.
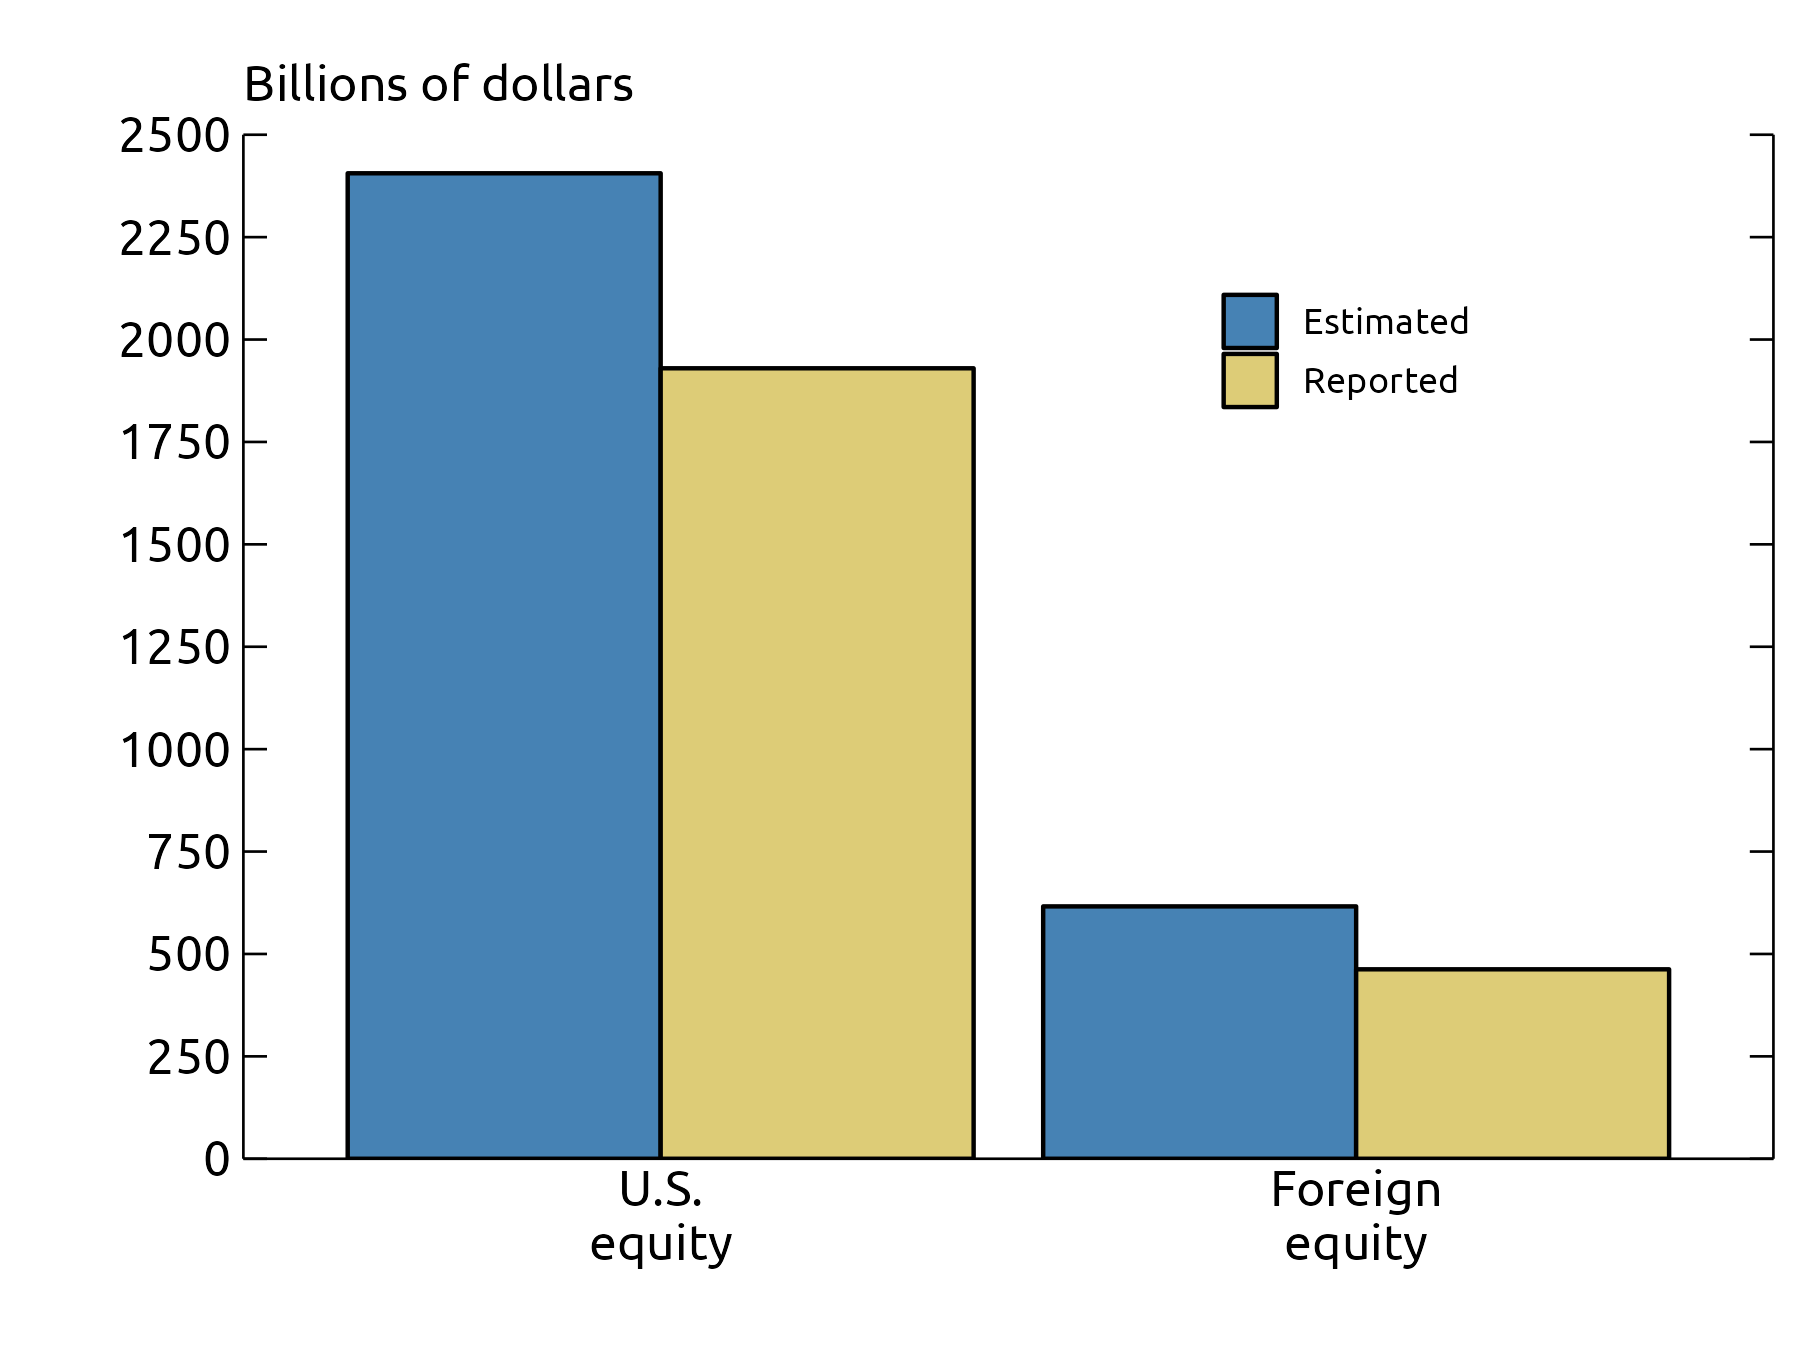
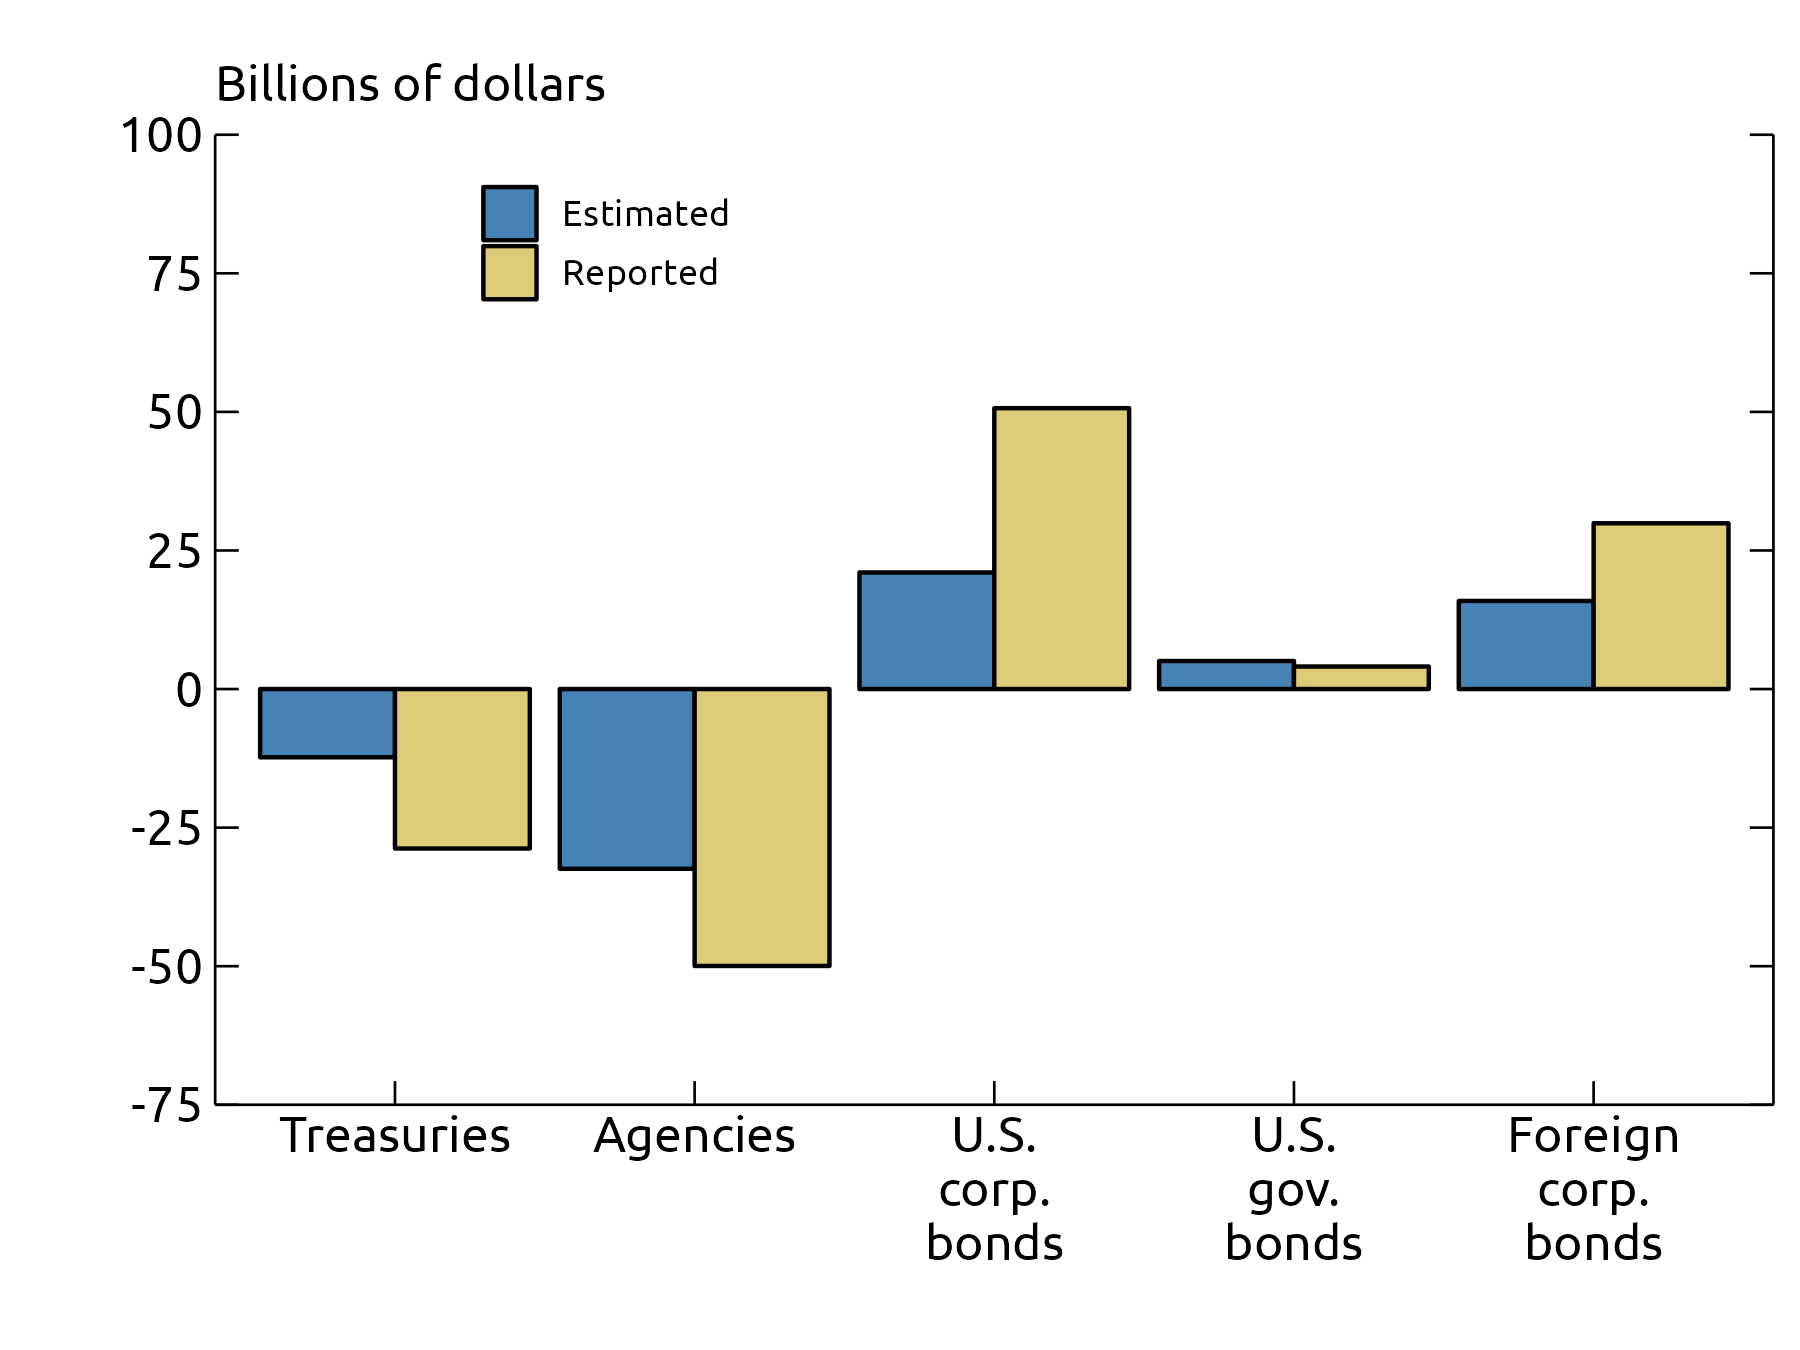
Despite small average absolute differences between estimated and reported valuation changes, differences can cumulate to become much larger over longer time horizons. Figure 6 shows the estimated (blue bar) and reported (yellow bar) valuation change from February 2023 to January 2024 for equities. For U.S. equities, estimated valuation change was almost $2.4 trillion, which was about $500 billion more than the reported valuation change. For foreign equities, estimated valuation change was over $600 billion, which was about $150 billion more than the reported valuation change. While equities have the largest gap between estimated and reported valuation change, Figure 7 shows there are also notable discrepancies in foreign holdings of U.S. corporate bonds, with a gap of nearly $30 billion, and UST, with a gap of over $15 billion.
The difference between estimated and reported valuation change is larger over longer time horizons because tiny country-month differences can accumulate when those differences are positively correlated, as they are in these data. Between February 2023 and January 2024, more than 90 percent of country-pairs had positively correlated U.S. equity valuation change differences. Likewise, foreign holdings of U.S. corporate bonds and Treasuries also had 84 and 62 percent positively correlated country-pair differences, respectively. One source of these positive correlations is that estimated valuation changes for foreign holdings of U.S. securities rely on the same or very similar benchmark indexes for many countries. As such, differences in country-level estimates tend to be positively correlated.
Reported and estimated valuation changes also differ because the SLT now reports valuation changes for all countries in the survey panel, whereas the estimated valuation change omitted 130 countries for data privacy and benchmark availability reasons. Those previously unpublished countries only make up about 0.6 percent of U.S. holdings of foreign securities but account for 5 percent of the difference between estimated and reported valuation change for foreign corporate debt, 9 percent of the difference for foreign stock, and 63 percent of the difference for foreign government bonds.
Conclusion
The addition of valuation change data to the SLT is a major improvement in the compilation of official statistics on U.S. cross-border portfolio flows. Valuation changes often move in the opposite direction of net U.S. sales/purchases and are often large enough to drive overall changes in holdings. As such, changes in holdings alone are an unreliable measure of cross-border demand for U.S. or foreign securities. Researchers interested in analyzing valuation changes for the period since February 2023 should use the newly reported valuation change data from the TIC SLT. For the period prior to February 2023, previously developed estimates of valuation changes can be used with renewed confidence. The quality of those estimates is likely to be good for changes over shorter time periods and for aggregates of countries. To construct a longer time series, we recommend splicing the historically estimated and newly reported valuation changes together.
Appendix: Detailed Description of the Expanded SLT Form
The following section provides a detailed discussion of the expanded SLT form and background that was used in the construction of preceding exhibits. On the SLT, custodians, issuers, and end-investors must report information about their securities holdings in three dimensions: A) countries, B) type of counterparties, and C) type of securities. There are two types of counterparties: i) foreign official institutions, and ii) all other foreigners. There are seven types of securities: 1) U.S. Treasuries, 2) U.S. agencies, 3) U.S. corporate bonds, 4) U.S. equities, 5) foreign government bonds, 6) foreign corporate and other bonds, and 7) foreign equities. The SLT collects four measures, I) Holdings, and changes in holdings due to: II) Purchases, III) Sales, and IV) Valuation due to Price (including spot dollar exchange rate changes). All reported values are end-of-month, taking the net of changes within the month.
Table 1 presents a stylized report from the expanded SLT form for one country, type of counterparty, and security. In the example, a U.S.-resident custodial bank reports end-of-month holdings of $37 million of UST on behalf of private investors resident in Albania in column 5. We assume the custodial bank started the reporting month holding $30 million. (This is not shown in Table 1 but would be reported in column 5 of last month's form). Four distinct changes over the course of the month account for the total $7 million increase in holdings. First, U.S. investors purchase $5 million of UST from U.S. custodial bank's Albanian resident customers. This is reported in column 6. Importantly, the transactions on the expanded SLT are reported from the perspective of U.S. investors so that a U.S. purchase is a foreign sale and vice versa. Second, U.S. investors sold Albanian customers $9 million of UST, as reported in column 7. Third, suppose that the value of last month's $30 million holdings increased to $32 million at this month's end due to price and exchange rate changes. This $2 million increase is reported in column 8. Valuation gains are reported as positive numbers while losses are reported as negative numbers.
Table 1. TIC Form SLT
| Foreign Economies, Organizations, and Issuers | U.S. Treasury and Federal Financing Bank Bonds and Notes Owned by Foreign Residents | Bonds of U.S. Government Corporations and Federally Sponsored Agencies Owned by Foreign Residents | |||||||||||||||
|---|---|---|---|---|---|---|---|---|---|---|---|---|---|---|---|---|---|
| Foreign Official Institutions | All Other Foreigners | Foreign Official Institutions | All Other Foreigners | ||||||||||||||
| Holdings | Changes due to: | Holdings | Changes due to: | Holdings | Changes due to: | Holdings | Changes due to: | ||||||||||
| U.S. Purchases | U.S. Sales | Valuation due to Price | U.S. Purchases | U.S. Sales | Valuation due to Price | U.S. Purchases | U.S. Sales | Valuation due to Price | U.S. Purchases | U.S. Sales | Valuation due to Price | ||||||
| 1 | 2 | 3 | 4 | 5 | 6 | 7 | 8 | 9 | 10 | 11 | 12 | 13 | 14 | 15 | 16 | ||
| Code | Millions | Millions | Millions | Millions | Millions | Millions | Millions | Millions | Millions | Millions | Millions | Millions | Millions | Millions | Millions | Millions | |
| Europe | |||||||||||||||||
| Albania | 1510-5 | 37 | 5 | 9 | 2 | ||||||||||||
| Andorra | 1010-3 | ||||||||||||||||
| Armenia | 1651-9 | ||||||||||||||||
Fourth, suppose that the U.S. custodial bank gains a new Albanian customer with a $1 million UST holding. This "other change" in foreign holdings is not explicitly reported on the form but can be calculated as a residual from the following equation:
$$$$ \Delta Other_t = Holdings_t – Holdings_{t-1} + U.S. \ Purchases_t – U.S. Sales_t - \Delta Valuation_t \ , (2) $$$$
in which $$ \Delta X_t = X_t – X_{t-1} $$ denotes change over one month for the variable $$ X_t $$. Each of the additive terms on the right-hand side of this equation are explicitly reported in the current month – or previous month for $$ Holdings_{t-1} $$ – except for $$ \Delta Other_t $$, which is defined as the residual on the left-hand side. Because it is a residual, "other changes" measures any change in holdings not identifiable as purchases, sales, or valuation change. Such "other changes" may result from the addition (or removal) of custodians, issuers, or end-investors to the reporting panel, the transfer of custody of securities to a custodian in a different country, or other reasons. In the example for Albania above, other changes are $1 =$37 - $30 + $5 - $9 - $2.
Rewriting Equation (2) one can decompose changes in U.S. holdings of foreign securities as follows:
$$$$ \Delta Holdings_t = \Delta Valuation_t + Net \ U.S. Purchases_t + \Delta Other_t \ , (3) $$$$
in which $$ Net \ U.S. \ Purchases_t = U.S. Purchases_t – U.S. Sales_t$$. This ensures that the meaning of net U.S. purchases is again consistent with the U.S. perspective employed by the SLT form, and that positive (negative) net U.S. purchases from foreigners imply U.S. purchases were greater (less) than U.S. sales to foreigners, thus increasing (decreasing) U.S. holdings, all else equal.
1. We thank Anna Rowbatham, Ben Stagoff-Belfort, Illiyuna Islam, and Jialin Zhang for their diligent and careful work in preparing these data and exhibits for publication. Any opinions and conclusions expressed herein are those of the authors and do not necessarily represent the views of the Board of Governors of the Federal Reserve System, or any other person associated with the Federal Reserve System. Corresponding author can be reached at [email protected]. Return to text
2. The complete name of SLT form is, "Aggregate Holdings, Purchases and Sales, and Fair Value Changes of Long-term Securities by U.S. and Foreign Residents." TIC SLT Form and Instructions and data are available on the U.S. Treasury website. Return to text
3. The expanded SLT first published holdings and transactions as-of February 2023 and supersedes the original SLT which reported only holdings and was introduced in late 2011. Valuation change data was embargoed for one year to validate the data and test the collection process. The expanded SLT also supersedes long-term cross-border securities transactions reported on the TIC S form, which has been discontinued as-of February 2023. More details about publication changes and analysis of the expanded SLT transaction data are available from Bertaut and Judson (2023). Return to text
4. The black line in Figure 1 is the S&P U.S. Treasury Bond Index (SPBDUSB). Return to text
5. The MFH table combines holdings of long-term Treasury securities from the SLT form and short-term Treasury securities from the TIC BL2 form to define the top 20 foreign holders and is available from the U.S. Treasury at https://ticdata.treasury.gov/resource-center/data-chart-center/tic/Documents/slt_table5.txt. Return to text
6. Figure 4 decomposes U.S. holdings of foreign securities using Equation (3) from the appendix, which is analogous to Equation (1). Return to text
7. The price indexes used in those estimation approaches vary by country and security type and come from commercial providers such as MSCI, Bloomberg Finance, and J.P. Morgan Chase & Co.
Thomas, Charles, Francis Warnock, and Jon Wongswan (2004). "The Performance of International Equity Portfolios," IFDP. Washington: Board of Governors of the Federal Reserve System, August 2004, https://www.federalreserve.gov/pubs/ifdp/2004/817/ifdp817.htm.
Bertaut, Carol, and Ralph Tryon (2007). "Monthly Estimates of U.S. Cross-Border Securities Positions," FEDS Notes. Board of Governors of the Federal Reserve System, November 2007, https://www.federalreserve.gov/econres/ifdp/monthly-estimates-of-us-cross-border-securities-positions.htm.
Bertaut, Carol, and Ruth Judson (2014). "Estimating U.S. Cross-Border Securities Positions: New Data and New Methods," IFDP. Washington: Board of Governors of the Federal Reserve System, https://doi.org/10.17016/IFDP.2014.1113. Return to text
8. Bertaut, Carol, and Ruth Judson (2023). "Measuring U.S. Cross-Border Securities Flows: New Data and A Guide for Researchers," FEDS Notes. Washington: Board of Governors of the Federal Reserve System, October 02, 2023, https://doi.org/10.17016/2380-7172.3392. Return to text
9. RMSE is a measure of accuracy which we define as the square root of the average of the squared differences between the estimated valuation changes and the SLT-reported valuation changes. Return to text
10. Bertaut, Carol, Beau Bressler, and Stephanie Curcuru (2019). "Globalization and the Geography of Capital Flows," FEDS Notes. Washington: Board of Governors of the Federal Reserve System, September 6, 2019, https://doi.org/10.17016/2380-7172.2446. Return to text
McCallum, Andrew H., Laura DeMane, Nyssa Kim, Emily Liu, and Andrew Loucky (2024). "Introducing New Valuation Change Data for U.S. Cross-Border Portfolio Holdings," FEDS Notes. Washington: Board of Governors of the Federal Reserve System, April 18, 2024, https://doi.org/10.17016/2380-7172.3493.
Disclaimer: FEDS Notes are articles in which Board staff offer their own views and present analysis on a range of topics in economics and finance. These articles are shorter and less technically oriented than FEDS Working Papers and IFDP papers.