FEDS Notes
December 16, 2019
Fiscal Flow Volatility and Reserves
Jeffrey Huther, Luke Pettit, and Mark Wilkinson
Introduction
Fiscal flows into and out of the U.S. Treasury's account have the effect of creating volatility in the Treasury's cash balances, its debt issuance, and the stock of reserves in the banking system. The spillover of fiscal flows into reserves can induce movements in short-term rates, directly affecting the traditional channel of the Federal Reserve's monetary policy implementation. In this way, the mechanisms by which fiscal flow volatility affect money markets are an important component of understanding how monetary policy operates.
A dollar paid to the Treasury in taxes directly reduces the amount of reserves in the banking system by one dollar, while a dollar paid by the Treasury directly increases the amount of reserves in the banking system by one dollar. This has not always been the case; prior to the financial crisis, tax receipts were held in (and expenditures paid from) the Treasury's accounts at commercial banks, a practice that left the stock of bank reserves unaffected by fiscal flows. In this note, we explain what changed and describe implications for monetary policy. We first illustrate how temporal imbalances in the Treasury's cash flows were transmitted through financial markets prior to the financial crisis and how they are transmitted now. We conclude by discussing implications of this volatility on monetary policy implementation.
The past, present and future of the volatility of fiscal flows
The imbalances in the Treasury's operating cash balances (the difference between the amount of tax revenues it takes in on any given day and the amount it expends) are the result of asymmetric schedules determined by a mix of convention and law. The largest share of tax receipts comes from individuals whose employers make withheld tax payments on schedules that coincide with paycheck dates. Corporate and non-withheld taxes are paid on a periodic (roughly quarterly) basis. In contrast, the largest expenditures (Social Security and Medicaid/Medicare) largely follow monthly schedules. As a result, fiscal balances are subject to large swings that vary on weekly, monthly and quarterly bases. Said otherwise, the flows into the Treasury's account that are associated with various taxes do not typically match the patterns of monthly disbursements (such as Social Security payments, which are paid on most Wednesdays). This mismatch gives rise to volatility in Treasury cash balances, independent of whether the federal budget is balanced or not.
Pre-crisis volatility management
Prior to the 2007-08 financial crisis, the Treasury targeted a level of cash held in its account at the Federal Reserve (Treasury's General Account, or TGA) of $5 billion, with excess funds flowing back into deposits at commercial banks in the Treasury's tax and loan (TT&L) program.1 This program minimized effects of fiscal flows on the stock of reserves; a corporation paying taxes, for example, would write a check to the Treasury that would be deposited in a bank, where the funds would be deposited in a Treasury account and stay on the bank's balance sheet rather than going into the TGA. If the corporation's bank was not the same bank as the Treasury's bank, interbank trading would be used to reallocate reserve balances.
Even under this system, the Treasury played a role in minimizing the effects of its cash flow volatility, chiefly through changes in bill issuance. That is, some of the volatility of fiscal flows would be absorbed by holders of short-dated Treasury securities (e.g. money market funds and foreign central banks), with bill issuance falling when tax receipts were high and rising when expenditures rose. The Treasury's efforts to dampen fiscal flow volatility, however, were limited to small changes in its bill issuance to preserve the lower borrowing costs it achieved from regular and predictable issuance.2
In practice, the Treasury's use of its TT&L accounts was constrained by the requirement that its deposits at banks be collateralized (the Treasury accepted a wide range of collateral, but banks still needed to make that collateral available). The need to collateralize Treasury deposits occasionally led banks to cap the amount of funds they were willing to hold for the Treasury. The most notable instances of binding collateral constraints occurred in the late 1990s when the Treasury received unexpectedly large non-withheld tax payments from investors. Figure 1 shows the Treasury's largely successful efforts to target $5 billion in its balances at the Federal Reserve from 1995 to 2005. While there are a few notable misses corresponding to tax dates in which the TGA exceeded $10 billion, these large misses account for only 3.7% of the total number of working days between 1995 and 2005.
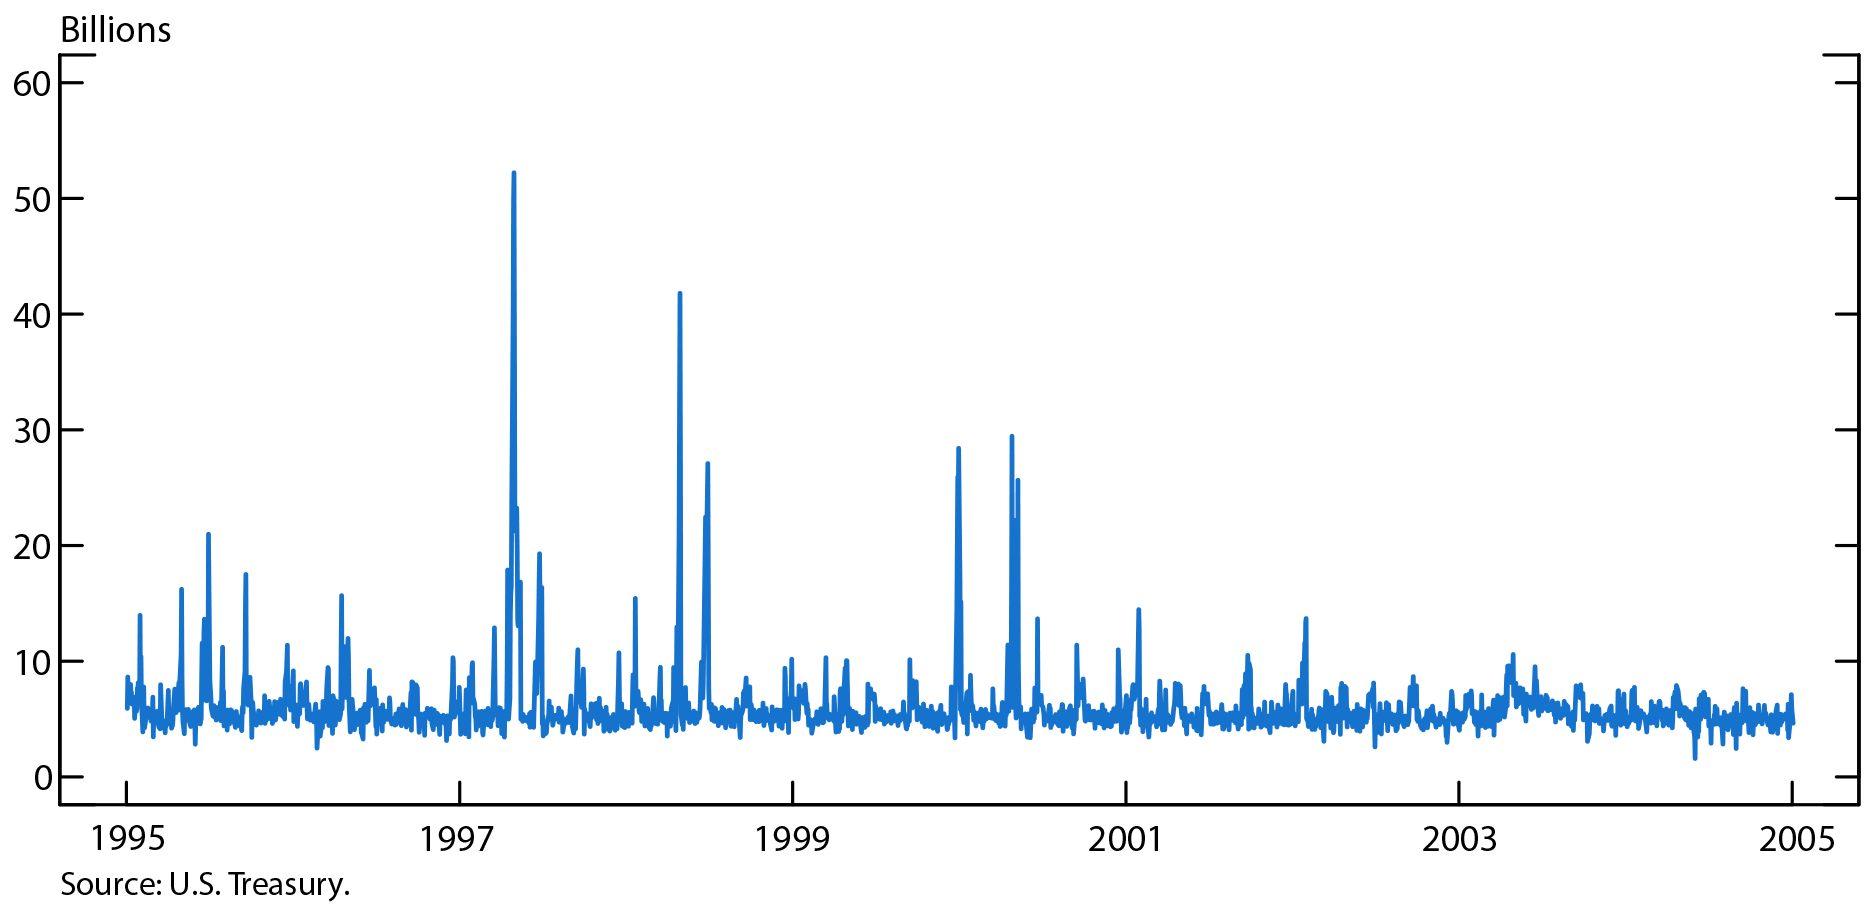
Source: U.S. Treasury.
The Federal Reserve actively managed the level of reserves to offset temporary pressures in the banking system that arose from the redistribution of reserves that came with the TT&L program (as reserves moved from dealers' banks to commercial banks and from surplus banks to deficit banks). The Fed regularly supplied small amounts of reserves through open market operations) to ensure that banks had sufficient reserves to meet reserve requirements.3 To emphasize this point, Table 1 shows that over the 2003-2007 period, fluctuations in reserves and the TGA were relatively small, especially in comparison to their movements in recent years.
The TT&L system broke down when the effective federal funds rate (EFFR) dropped below 25 basis points (bps) in late 2008. TT&L balances earned interest at EFFR less 25 bps, and as EFFR dropped below 25 bps, the Treasury emptied the accounts rather than receive negative interest. With the demise of the TT&L system, these balances were transferred to the TGA at the same time as the general increase in reserves that accompanied the Federal Reserve's Large Scale Asset Purchases. This concomitant increase in reserves mitigated the impact of TGA-induced reserve volatility.
The low volatility of the Treasury's account at the Federal Reserve, the stock of reserves, Treasury bills and open market operations pre-crisis is shown in column 1 of Table 1. The largest source of pre-crisis changes in factors affecting reserves was changes in Treasury's bill issuance – changes that were generally well telegraphed to market participants. The TGA, in contrast, exhibited very low volatility.
Table 1: Volatilities of selected factors affecting reserves
Average of absolute value of weekly changes (billions of dollars)
| Jan. 2003 - Dec. 2007 | Jan. 2010 - Feb. 2018 | Mar. 2018 - Sept. 2019 | |
|---|---|---|---|
| TGA | 1 | 24 | 35 |
| Reserves | 5 | 45 | 40 |
| Treasury Bills | 15 | 16 | 21 |
| Repo | 6 | 0 | 2 |
| Reverse Repo | 0 | 19 | 9 |
Note: Weekly observations are taken from last business day of each week.
Post-crisis volatility management
A comparison of the first and second columns of Table 1 shows how the volatility of fiscal cash flows changed following the financial crisis. The TGA had average pre-crisis weekly changes of less than $1 billion. Between 2010 and 2018, the TGA fluctuated by $24 billion, about half as volatile as reserves over this period. Table 1 also highlights several other important factors affecting reserves in recent decades. Open market operations, which had generally been in the form of repos (i.e. lending cash to primary dealers and receiving Treasury securities as collateral) prior to the financial crisis, took the form of reverse repos provided through the Overnight Reverse Repurchase Agreement Facility (ON RRP) beginning in 2013.4
The charts below highlight the migration of volatility from the TT&L accounts, which contained fiscal flow shocks within the banking system, to the TGA. Illustrated in Figure 2, the winding down of the TT&L program was accompanied by a transfer of these balances to the TGA. The rise in the TGA beginning in 2015 was the result of a policy change at the Treasury to maintain cash balances sufficient to meet five days of outflows.5 Also of note, the large declines in cash balances in late 2015, 2017 and 2019 were the result of debt ceiling impasses that limited the ability of the Treasury to maintain precautionary balances.
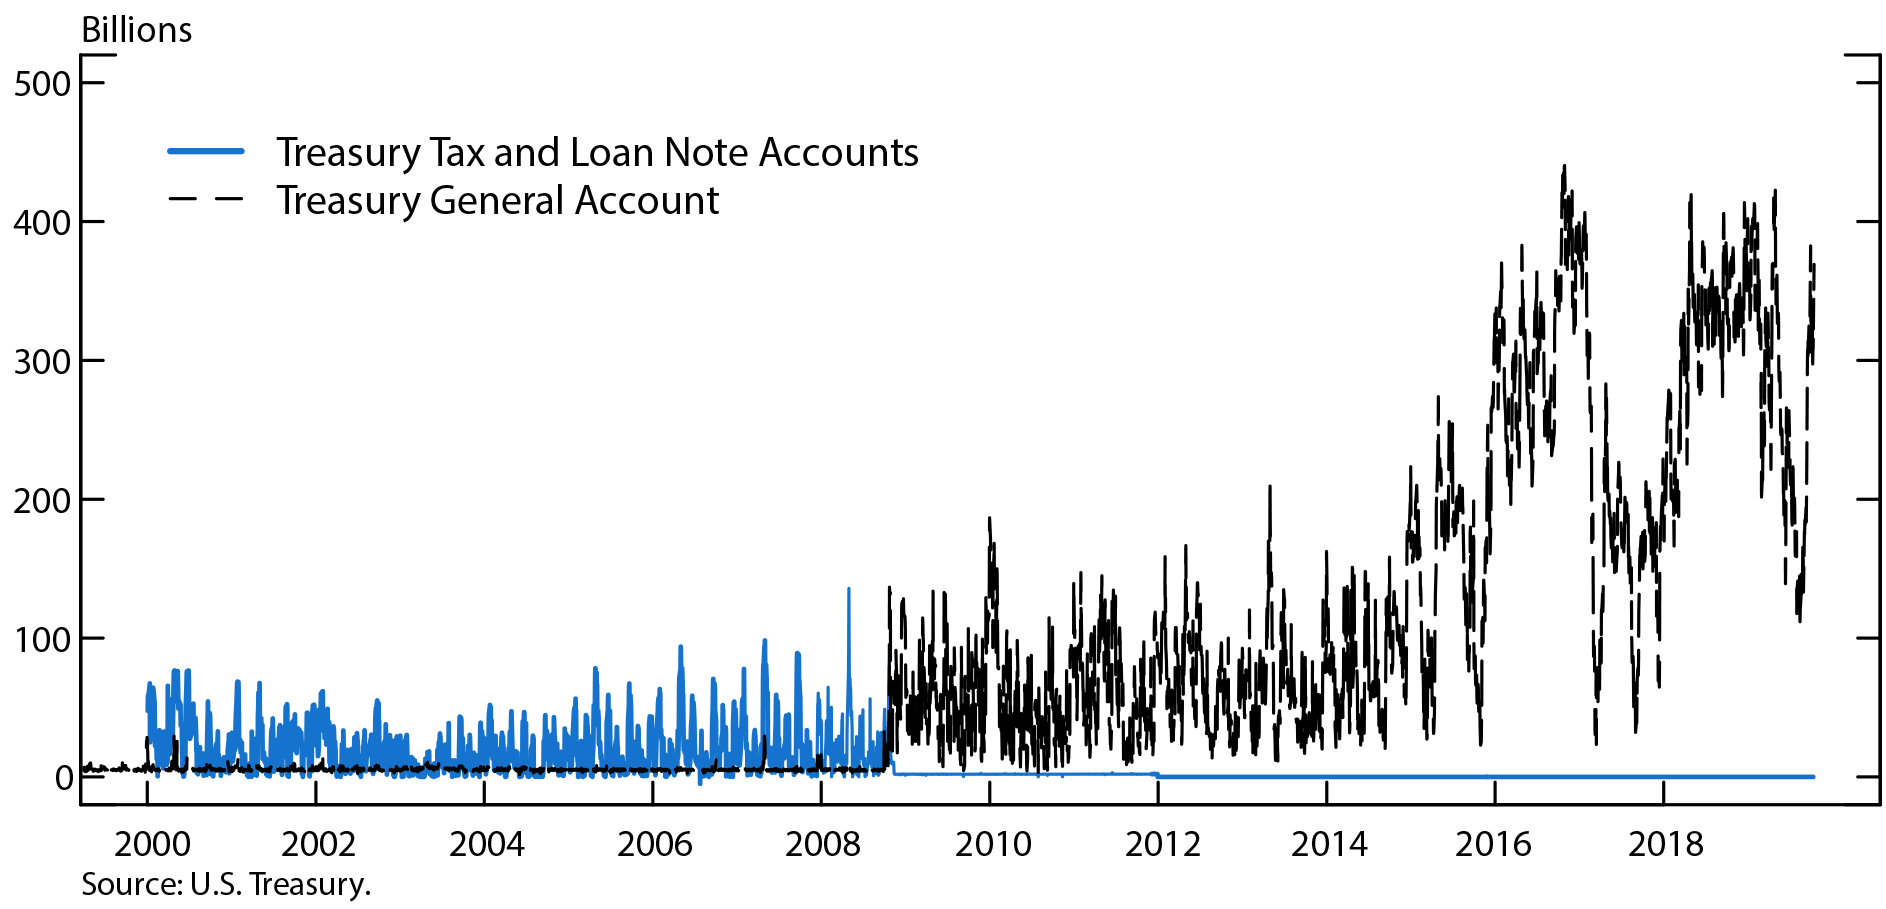
Source: U.S. Treasury.
Figure 3 illustrates the increases in the volatility of reserves that coincided with the changes in the Treasury's cash management, the Federal Reserve's quantitative easing programs, and the use of the ON RRP program on quarter ends.6
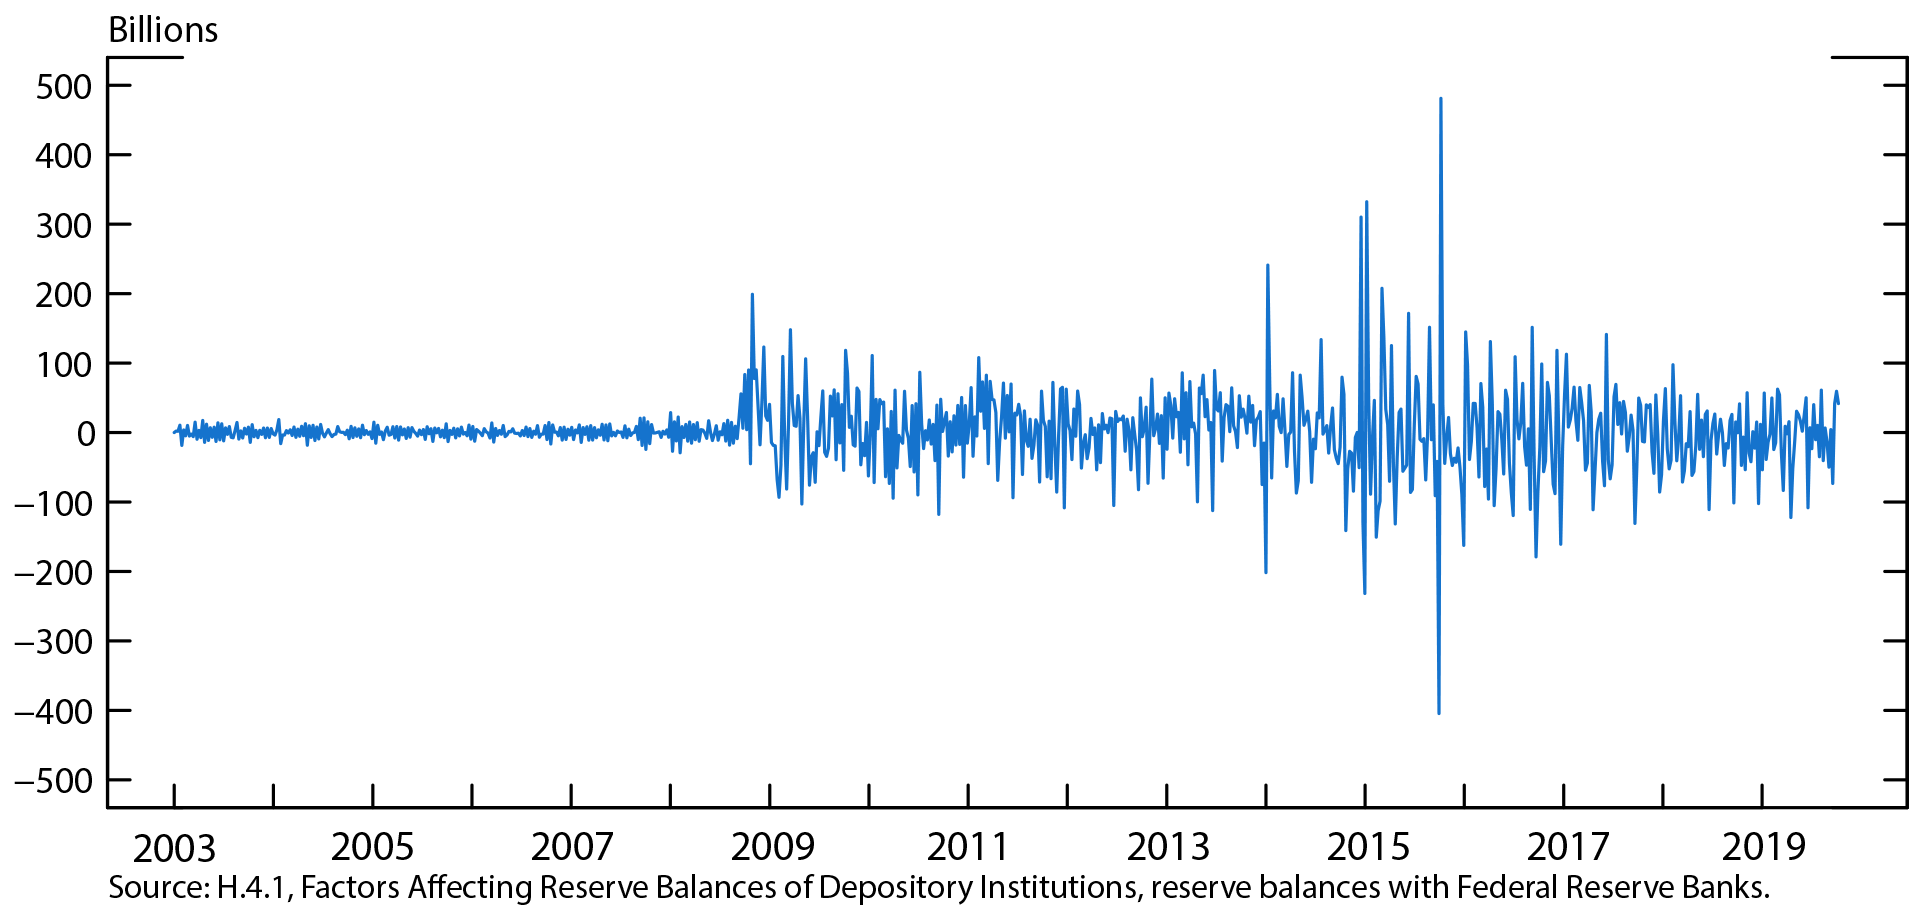
Source: H.4.1, Factors Affecting Reserve Balances of Depository Institutions, reserve balances with Federal Reserve Banks.
Conclusion
The changes in Treasury cash management outlined in this note have strengthened the connection between fiscal flows and the short-term level of reserves. Recent events have provided further evidence of this link, extending beyond reserve levels and into money market rates. In the third quarter of 2019, the TGA rose by roughly $140 billion following the resolution of the debt ceiling impasse and seasonal receipts. The consequent drain in reserves coincided with notable volatility in money market rates.
In light of these developments, future research is warranted to better understand the relationship between the Treasury's fiscal flows and money market volatility.
References
Garbade, Kenneth (2015). Treasury Debt Management under the Rubric of Regular and Predictable Issuance: 1983-2012. Federal Reserve Bank of New York.
Garbade, Kenneth, John Partlan, and Paul Santoro (2004). "Recent Innovations in Treasury Cash Management." Federal Reserve Bank of New York Current Issues in Economics and Finance, Volume 10 (11) (November).
Martin, Antoine, James McAndrews, Ali Palida and David Skeie (2019). "Federal Reserve Tools for Managing Rates and Reserves." FRBNY Staff Reports. No. 642, originally published 2013, revised April 2019.
Meulendyke, Ann-Marie (1988). "A Review of Federal Reserve Policy Targets and Operating Guides in Recent Decades." FRBNY, Quarterly Review, Volume 13 (3).
Santoro, Paul (2012). "The Evolution of Treasury Cash Management during the Financial Crisis". Current issues in Economics and Finance. FRBNY. Volume 18 (3).
1. See Garbade, Partlan and Santoro (2004) for a detailed description of Treasury's cash management practices prior to the financial crisis. Return to text
2. See Garbade (2015) for details on the Treasury's debt management framework. Return to text
3. See Meulendyke (1988) for a history of open market operations prior to the financial crisis. Martin, McAndrews, Palida and Skeie (2019) model post-crisis monetary policy implementation. Return to text
4. The ON RRP program is described in FAQs at https://www.newyorkfed.org/markets/rrp_faq.html. Return to text
5. See the Treasury's Quarterly Refunding Statement, May 2015: https://www.treasury.gov/press-center/press-releases/Pages/jl10045.aspx Return to text
6. The large regular spikes in reserves, followed by comparably sized drops, beginning in 2014 were the result of the ON RRP program which allowed lenders to switch counterparties on financial reporting dates Return to text
Huther, Jeffrey, Luke Pettit, and Mark Wilkinson (2019). "Fiscal Flow Volatility and Reserves," FEDS Notes. Washington: Board of Governors of the Federal Reserve System, December 16, 2019, https://doi.org/10.17016/2380-7172.2470.
Disclaimer: FEDS Notes are articles in which Board staff offer their own views and present analysis on a range of topics in economics and finance. These articles are shorter and less technically oriented than FEDS Working Papers and IFDP papers.