FEDS Notes
February 18, 2022
Global Real Economic Uncertainty and COVID-19
Ranie Lin, Juan M. Londono, and Sai Ma1
Introduction
The COVID-19 pandemic led to unprecedented disruptions in supply, demand, and productivity, which have had cataclysmic health, social, and economic implications across the globe. In this note, we explore the large increase in global real economic uncertainty observed during the pandemic as a channel that explains or magnifies the economic implications of COVID-19. We use the methodology in Jurado, Ludvigson, and Ng (2015) to calculate an index for real economic uncertainty (REU), and we center the attention on the dynamics and the economic effects of REU during the COVID-19 pandemic. To understand why the economic effects of REU might have been different during the pandemic compared to other crises, we exploit a cross section of 30 countries, which represent 65% of total global GDP, and we extend the time series of REUs in Londono, Ma, and Wilson (2021) to April 2021.
We find that, though the increase in REU during the COVID-19 pandemic was unprecedented and almost synchronized across all countries in our sample, the drops in industrial production (IP) that followed were similar in magnitude to those observed during the 2008 global financial crisis (GFC). However, unlike during the GFC, countries that suffered the largest increases in REU did not necessarily experience the largest declines in IP. To explore this apparent disconnect between, on the one hand, the unprecedented increase in REU and the relatively more modest decrease in IP during the COVID-19 pandemic, and, on the other hand, the heterogeneity in the economic effects of REU across countries, we explore two channels unique to the pandemic that drive the economic impact of REU over this period. Our results suggest that countries that experienced the more severe COVID-19 outbreaks suffered the largest economic effects; that is, relative to countries that suffered less severe outbreaks, their domestic IP dropped more following an increase in REU. However, fiscal stimulus packages moderated these economic effects. Thus, countries where governments responded more actively and injected more money into their economies during the pandemic suffered less declines in domestic IP in response to changes in REU relative to countries with more moderate fiscal stimulus packages over this period.
Real Economic Uncertainty during the COVID-19 Pandemic
We calculate the monthly REU index for the following 30 countries: Australia, Austria, Belgium, Brazil, Canada, Denmark, Finland, France, Germany, Greece, Iceland, Ireland, Israel, Italy, Japan, Korea, Luxembourg, Mexico, the Netherlands, New Zealand, Norway, Poland, Portugal, Slovenia, Spain, Sweden, Switzerland, Turkey, the United Kingdom, and the United States.
Following the methodology in Jurado, Ludvigson, and Ng (2015), we measure REU as an aggregate of the standard deviations of the unforecastable component of a set of economic indicators. Specifically, for each economic indicator (indexed by j) for a particular country at time $$t$$, $$v_{it}$$, the $$h$$-period ahead uncertainty is calculated as
$$ {U}_{{jt}}\left({h}\right)=\sqrt{\mathbb{E}{\underbrace{\left({y}_{{jt}+{h}}-\mathbb{E}\left[{y}_{{jt}+{h}}\middle|{I}_{t}\right]\right)}_{Forecasting\ errors}}^\mathbf{2}|{I}_{t}}, $$
where the forecast is made based on a dynamic factor model using all information currently available ($$I_t$$). Intuitively, uncertainty is higher when the volatility of the forecast error is high; that is, when it is harder to predict this indicator. For each country, aggregate uncertainty is calculated as the average of all individual economic indicator uncertainties. We use data from the OECD Main Economic Indicators to calculate REU for all 30 countries in our sample. Using the same data source for all countries allows us to guarantee the comparability of economic indicators across countries.2 As pointed out by Ng (2021), variations of many underlying economic indicators during the pandemic could be interpreted as outliers, which poses a challenge for calculating REU in this period. To address this issue, we follow Ng (2021) and adjust REUs for each country using the number of COVID-19 related hospitalizations and positive cases after February of 2020.3
Figure 1 shows the time series of the equal-weighted average of REUs across all countries in our sample and the 12-month-rolloing window cross-country average of monthly IP growth.
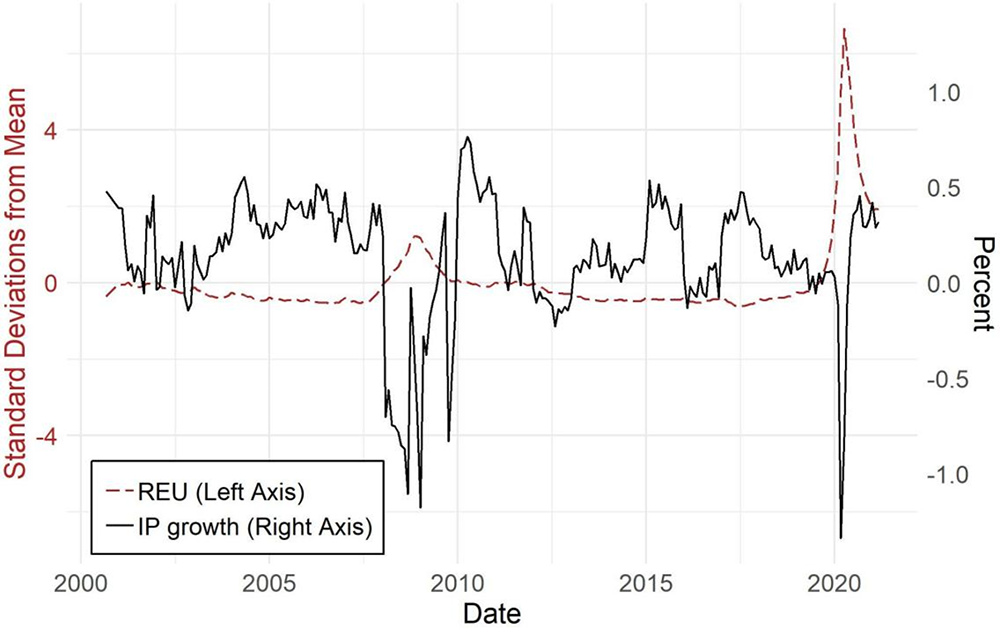
Note: this figure shows global REU and IP growth from December 2000 to April 2021. Global REU, in the left axis, is computed as the average REU index across all 30 countries in the sample. To facilitate interpretability, global REU is expressed in standard deviations from its historical mean. We standardize REU for each country and then take the average across all countries. Each country's IP growth is computed as the 12-month rolling average of 1-month IP growth series, and global IP is calculated as the average across all 30 countries in the sample.
The increase in REU during the pandemic was, indeed, unprecedented, reaching a maximum value of around seven standard deviations above its historical mean between March and May of 2020. For comparison, the previous maximum average REU realization, which could still be characterized as an extreme event, was around the collapse of Lehman Brothers in 2008 at 1.2 standard deviations above its full-sample historical mean.4 Overall, as documented by Londono et al. (2021), an increase in global REU is followed by a decrease in IP. Interestingly, however, the drop in IP during the pandemic is only slightly higher than that observed during the GFC. There are, of course, large fluctuations in IP during crises, including large rebounds in the second and third quarters of 2020 for many countries in our sample. Nevertheless, the 12-month-rolling-window average allows us to look at longer-term trends in IP.
Comparing the relation between REU and IP growth across countries can help us further understand this apparent disconnect between the unprecedented increase in REU during the COVID-19 pandemic—almost 5 times that during the GFC—and the somewhat similar decline in IP during this episode compared to the GFC. Figure 2 compares the maximum decline in IP during the GFC and the COVID-19 pandemic for countries grouped into low, medium, or high REU bins. The pattern for the GFC seems to follow better the intuition that a larger increase in REU is followed by a larger decline in IP. However, this pattern seems to break during the pandemic, not only because the magnitudes of the largest IP drops are smaller during this period but also because countries that experienced the largest REU did not necessarily experience the largest drop in IP.
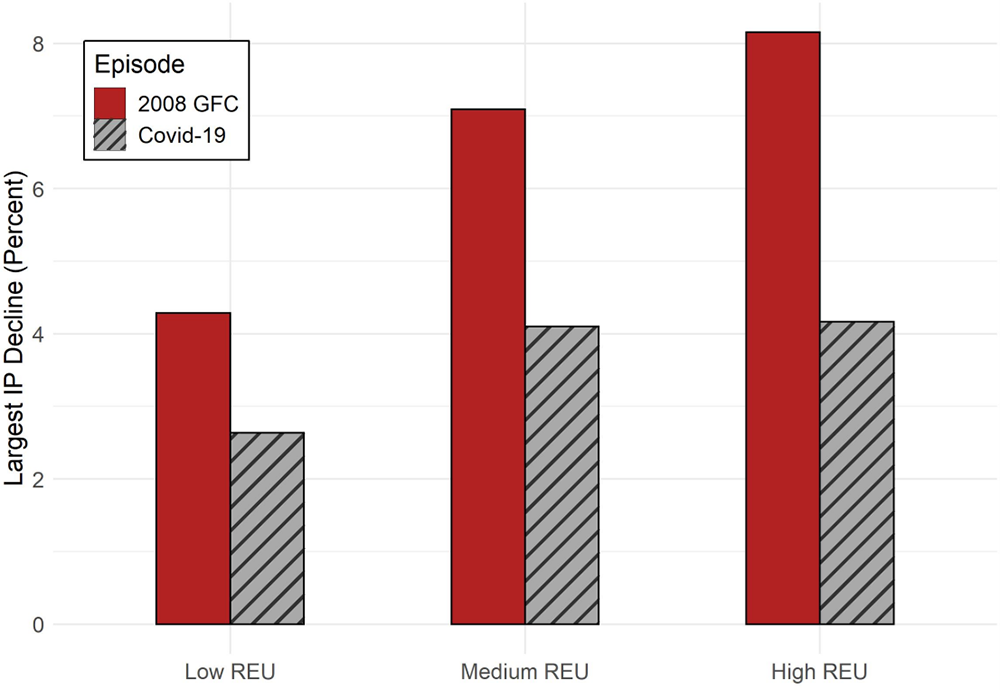
Note: this figure shows the relation between countries' IP declines and REU indexes during the 2008 GFC and the COVID-19 pandemic. In each episode, countries are grouped into low, medium, or high REU bins corresponding to maximum monthly REU indexes falling in the lowest, middle, or highest tercile, respectively, among all countries. IP decline is computed as the maximum 6-month rolling window average IP decline, averaged across all countries in each bin. The time periods covered for the 2008 GFC and COVID-19 pandemic are January 2007 to December 2008 and January 2020 to April 2021, respectively.
Severity of COVID-19 Outbreaks and Fiscal Stimulus
Measures to prevent the spread of the virus and its effects were also unprecedented. For instance, in an effort to prevent the spread of the virus, governments implemented confinement measures, and these measures not only varied as the pandemic evolved but were also largely heterogeneous across countries, ranging from limited restrictions to total lockdowns that lasted for months in many countries. These measures partially explain why the severity of the outbreak varied substantially across countries and at different points in time during the pandemic. Governments around the world also implemented unprecedented packages to stimulate demand in their economies. For example, in the United States, a 2.2 trillion U.S. dollar stimulus package (around 10 percent of GDP), known as the U.S. CARES Act, was signed into law in March 2020; Finland's fiscal package, which supported unemployment and various sectors of the economy was valued at 10 percent of Finnish GDP; Japan's Emergency Economic Measures were valued at 1.1 trillion U.S. dollars (21 percent of GDP).5
To explore whether these two factors could explain the different economic impact of REU during the pandemic, we estimate the following regression:
$$ (1) \ \ \ \ \ \ \Delta{ip}_{i,t+h} = \alpha + (\beta_1 + \beta_2{Severity}_{i,t} + \beta_3{Stimulus}_{i,t}){REU}_{i,t} + \gamma{C} + \varepsilon_{i,t}, $$
where $$\Delta{ip}_{i,t+h}$$ is the annualized percentage growth in country $$i$$'s IP between months $$t$$ and $$t+h$$ and $${REU}_{i,t}$$ is the country's domestic REU index. The economic effect of REU can be time varying and country specific as a function of both the severity of the outbreak and the magnitude of the fiscal stimulus package. $$C$$ includes the following control variables: the foreign REU, which is calculated as the equally-weighted average of all other countries' REUs, the level of the severity of the outbreak, and the level of the stimulus package. The last two control variables allow for a direct effect of the severity of the pandemic and the stimulus packages on IP, in addition to affecting the size of the response to REU.
Table 1 shows the estimates of the coefficients in equation (1). Our results confirm those in Londono et al. (2021) and Jurado et al. (2015) that REU has significant and economically meaningful effects. In the absence of COVID-19 cases and fiscal stimulus, a one standard deviation increase in domestic REU is followed by a maximum drop in IP of around one percent after 3 months.
Table 1: Economic effects of REU, COVID-19 severity, and fiscal stimulus
| H | 1 month | 3 months | 6 months |
|---|---|---|---|
| REU ($$\beta_1$$) | 4.008 | -1.186* | -0.798*** |
| (4.034) | (0.619) | (0.262) | |
| REU*Severity ($$\beta_2$$) | -0.958 | -1.500** | -0.570*** |
| (5.02) | (0.562) | (0.196) | |
| REU*Stimulus ($$\beta_3$$) | 1.290* | 0.457*** | 0.176*** |
| (0.746) | (0.112) | (0.0366) | |
| R2 (%) | 3.1 | 12 | 10.2 |
| N | 12,450 | 12,396 | 12,396 |
Note: this table shows panel regression results of IP growth on REU and a set of control variables across multiple time horizons. The severity of the Covid-19 outbreak is measured for each country as monthly new cases per billion residents, and the data are obtained from the Our World in Data (OWID) databank. Stimulus responses come from the Oxford COVID-19 Government Response Tracker, which assigns a monthly numerical index between 0 and 100 for each country capturing the strength of the overall government response to the pandemic. For each $$h$$-month time horizon, IP growth is computed as the annualized percentage growth in IP from time $$t$$ to time $$t + h$$. Country fixed effects are included to control for other time-invariant characteristics, and standard errors are clustered at the country level. The period spans January 1980 to April 2021. For brevity, we omit the coefficients for the control variables.
We also find evidence supporting our hypotheses that these the severity of COVID outbreaks and the magnitude of fiscal stimulus packages affect the size of the response to REU during the COVID-19 pandemic. In particular, the coefficient associated with the interaction between REU and the severity of the outbreak is negative and significant, which suggests that more severe outbreaks are followed by larger drops in IP when uncertainty increases. In contrast, the interaction between REU and fiscal stimulus is positive and significant, consistent with these stimulus packages being successful at preventing a further economic deterioration following the increase in REU.
To understand the economic magnitude of how the severity of outbreaks and stimulus packages drive the economic effects of REU, figure 3 plots these economic effects for different levels of each variable. The panel to the left shows different scenarios for the severity of outbreaks in the absence of fiscal stimulus. For countries with average COVID-19 cases, an increase in REU is followed by a two-month-ahead decrease in IP of about 8 percent, much higher than the one percent for countries with zero cases (minimum).
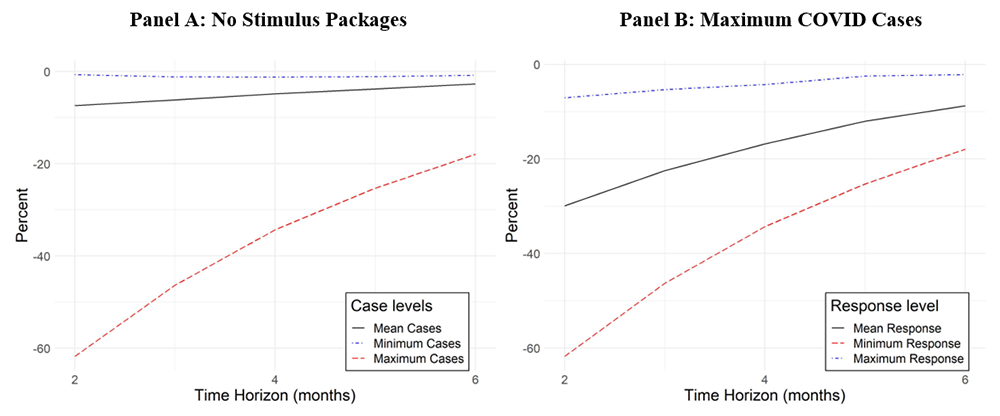
Note: this figure shows how heterogeneity in COVID-19 cases (left panel) and stimulus packages in response to the pandemic (right panel) affect the relation between IP growth and REU during the COVID-19 pandemic. Using the coefficients in table 1, we plot the effect of REU on IP. In the left panel, countries are assumed to have no stimulus packages, and cases vary between the minimum, mean, and maximum number of monthly COVID-19 cases per billion observed. In the right panel, countries are assumed to have the maximum number of COVID-19 cases per billion, and policy response indexes vary between the minimum, mean, and maximum policy responses observed.
The panel to the right shows the economic effects of REU under different stimulus package scenarios, assuming as a reference the extreme case of the country with the maximum COVID-19 cases, Poland. In the absence of stimulus, a country that had as high a number of cases, an increase in REU is followed by a two-month-ahead drop in IP of more than 60 percent (annualized). Fiscal stimulus does counteract the magnifying effect of the severity of outbreaks. In particular, even if COVID cases were extreme, an increase in REU is followed by a drop in IP of around 7 percent when the stimulus package is the maximum in our sample, which corresponds to Greece in February of 2021.
In sum, in this note, we extend the time series of real economic uncertainties (REUs) for 30 countries in Londono, Ma, and Wilson (2021) to investigate the dynamics and the economic effects of REU during the COVID-19 pandemic. We find evidence that, while REUs are almost 5 times larger during the pandemic than during the 2007-09 GFC, the declines in global IPs are of a similar magnitude in both episodes. We show that two factors present during the COVID-19 pandemic, namely the severity of COVID outbreaks and the magnitude of fiscal stimulus packages, counteract each other and help explain the economic effects of REU on IP during the pandemic.
References
Jurado, K., Ludvigson, S. C., Ng, S., 2015. Measuring uncertainty. American Economic Review 105, 1177–1216.
Londono, J. M., Ma, S., Wilson, B. A., 2021. The global transmission of real economic uncertainty. IFDP working papers 1317.
Ng, S., 2021. Modeling macroeconomic variations after covid-19. Tech. Rep., National Bureau of Economic Research.
Ritchie, H., Mathieu, E., Rodés-Guirao, L., Appel, C., Giattino, C., Ortiz-Ospina, E., Hasell, J., Macdonald, B., Beltekian, D., Roser, M., 2020. Coronavirus Pandemic (COVID-19). Published online at OurWorldInData.org. Retrieved from: 'https://ourworldindata.org/coronavirus' [Online Resource]
1. Ranie Lin is at Rice University, Juan M. Londono is a Senior Economic Project Manager and Sai Ma is a Senior Economist at the Division of international Finance of the Federal Reserve Board. The analysis and conclusions set forth are those of the authors and do not indicate concurrence by other members of the research staff or the Board of Governors. Return to text
2. See Londono, Ma, and Wilson (2021) for more details. Return to text
3. Data on cases and hospitalizations are obtained from Our World in Data (https://ourworldindata.org/covid-hospitalizations). Return to text
4. The sample mean is significantly affected by the COVID-19 period. REU is around 4 standard deviations above its mean during the GFC when the COVID-19 period is excluded. Return to text
5. Source: the OECD coronavirus country tracker (https://www.oecd.org/coronavirus/country-policy-tracker/). It's worth noting that other types of policy support such as monetary policy and liquidity policies are not considered because of limited and ununified measures in the international sample as well the focus on the real activities instead of financial markets in the paper. Return to text
Lin, Ranie, Juan M. Londono, and Sai Ma (2022). "Global Real Economic Uncertainty and COVID-19," FEDS Notes. Washington: Board of Governors of the Federal Reserve System, February 18, 2022, https://doi.org/10.17016/2380-7172.3045.
Disclaimer: FEDS Notes are articles in which Board staff offer their own views and present analysis on a range of topics in economics and finance. These articles are shorter and less technically oriented than FEDS Working Papers and IFDP papers.