FEDS Notes
December 31, 2020
How Do Principal Trading Firms and Dealers Trade around FOMC Statement Releases?1
James C. Harkrader and Daniel J. Weitz*
This FEDS Note examines how different types of market participants transact in the interdealer broker venue of the Treasury market in the periods immediately following statement releases at the conclusion of Federal Open Market Committee (FOMC) meetings.2 We compare intermediation patterns following scheduled statement releases with those following an unscheduled statement release.
We observe several distinct patterns in trading activity following scheduled FOMC statement releases. First, principal trading firms (PTFs), which specialize in electronic and automated intermediation, transact larger volumes than any other type of market participant (that is, dealers and end-investors), and trade most heavily with other PTFs. We also observe a less pronounced increase in traded volume between PTFs and dealers. Finally, we observe a discrete decrease in the concentration among PTFs and, to a lesser extent, dealers, following the statement releases.3
Drawing upon conversations with market participants, we posit several possible explanations for these patterns. First, some PTFs may seek primarily to serve as liquidity providers. These PTFs may compete among each other to transact with dealers that are acting to fulfill the liquidity demands of end-investors. Meanwhile, other PTFs may seek to rapidly process and trade upon the information contained in policy communications to profit from perceived mispricing. Both of these trading patterns would lead to the observed increase in overall trading volumes. In the case that additional PTFs enter the market, either to provide liquidity to dealers or to profit from perceived mispricing, these trading patterns would also lead to the observed decrease in concentration among PTFs.
Following an unscheduled statement release, we would expect to observe different patterns in trading activity. Specifically, we would expect to observe an increase in trading activity among a certain subset of firms that could immediately react to the new information, rather than all categories of firms. Indeed, on March 3, 2020, when the FOMC announced a surprise 50-basis-point cut to the target range, we observe a stark increase in PTF trading volume, but no analogous decrease in concentration among PTFs. Although we cannot be certain of the underlying causes of these patterns, conversations with market participants provide insight into several possible drivers. Notably, they suggest that these patterns could stem in part from ultra-low-latency firms attempting to profit from perceived mispricing by transacting before other firms are able to adjust their limit orders.4
I. Background and Motivation
FOMC meetings serve as the venue for the setting of monetary policy in the United States. Because of the important role of the benchmark on-the-run Treasury market in transmitting monetary policy to financial markets and to the economy, it is useful to understand how market participants transact in this market in the minutes immediately following FOMC statement releases.
The FOMC currently issues several communications shortly after the conclusion of each meeting. In 1994, the FOMC began to release a statement announcing changes to monetary policy. Since May 1999, these statements have been released after each FOMC meeting. In 2007, the FOMC first published a Summary of Economic Projections (SEP). Since 2013, SEPs have been released once per quarter and coincide with the release of FOMC statements. The SEP currently contains FOMC participants' projections (under their individual assessments of projected appropriate monetary policy and assumptions about other factors likely to affect economic outcomes) for economic growth, unemployment, inflation, and the federal funds rate. Finally, under recent practice, approximately 30 minutes after the release of each FOMC statement, the Chair holds a press conference that lasts about one hour.5
The note proceeds as follows. In Section II, we briefly summarize the structure of the Treasury market, to provide context for the scope of our analysis and our data sources. In Section III, we compare the market concentration of firms within each participant type (dealers, PTFs, or other) on scheduled FOMC statement release days. In Section IV, we perform an analogous examination of March 3, 2020, when the FOMC unexpectedly cut the target range by 50 basis points. In Section V, we conclude.
II. Scope of Analysis and Data
We divide the cash Treasury market into three "venues," which we refer to as the dealer-to-client (DTC), dealer-to-dealer (DTD), and interdealer broker (IDB) venues.6 In the DTC venue, primary dealers and other dealers act as market makers and transact with a variety of end-investors. In the DTD venue, dealers trade directly with each other. In the IDB venue, dealers trade anonymously with each other, with end-investors such as hedge funds, and with PTFs on mostly electronic platforms. The majority of trading in the IDB venue occurs in on-the-run securities.
We restrict our analysis to trading activity in on-the-run securities in the IDB venue. There are several rationales for this decision. First, on FOMC statement release days, the volume traded in the IDB venue far exceeds that in the DTD and DTC venues. The elevated volume in the IDB venue supports the notion that much of the trading in reaction to the statement release takes place in this venue. Second, the prevalence of electronic trading platforms in the IDB venue has permitted the entry of actors outside the traditional bank and dealer community—most notably, PTFs, which first entered the market as high-frequency traders in the early 2000s. These firms, which account for approximately half of IDB volume on an average trading day, specialize in high frequency, fully-automated intermediation.7 Under some circumstances, this kind of intermediation may result in more rapid liquidity provisioning than had been possible previously. Moreover, PTFs are believed to transact predominantly within the IDB venue. As a result, examination of the IDB venue could elucidate the role of PTFs in shaping liquidity provisioning around statement releases.8
We use data from the Financial Industry Regulatory Authority's (FINRA) Trade Reporting and Compliance Engine (TRACE),9 which provides insights into Treasury trading activity that cannot be found in public data sources. Specifically, these data include counterparty identifiers for all FINRA members and, as of April 1, 2019, PTFs as well. Since that date, we use TRACE data for thirteen FOMC statement release days (twelve scheduled and 1 unscheduled).10
III. Main Results
We next turn to a discussion of intraday trading volumes on scheduled FOMC statement release days, with a particular focus on participant-level dynamics. FOMC statement release days are distinct from the average trading day in several important respects. First, the average trading volume between 2:00 and 3:00 p.m. on statement release days (about $60 billion) is roughly triple that observed on the average trading day (about $20 billion). Additionally, trading activity by participant type differs notably on statement release days.
A. Trading Volume
Trading volumes in cash Treasury securities follow a distinct pattern on scheduled statement release days. Figure 1 shows average 1-minute volumes by venue across the twelve scheduled statement release days in our sample.11 Trading volumes in the IDB venue increase notably upon the statement release at 2:00 p.m. and again at the start of the Chair's press conference at 2:30 p.m. Subsequently, volumes increase further, peaking sharply at 3:00 p.m., which is similar to the pattern observed on days with no major policy announcements.12 Finally, volumes start to decline around the end of the Chair's press conference, which tends to conclude around 3:30 p.m.13 Volumes in the DTD and DTC venues do not appear to respond substantially to these FOMC communications.
Figure 1. Average 1-Minute Volume Traded by Venue across Scheduled FOMC Meetings*
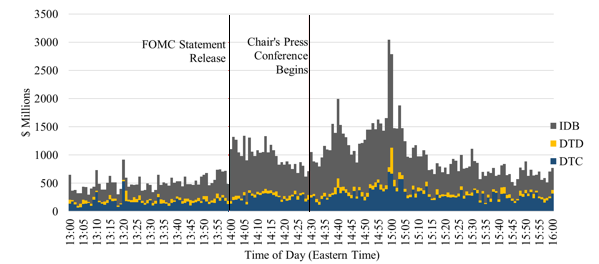
Note: Legend entries appear in graph in order from top to bottom.
Source: Authors' calculations based on Trade Reporting and Compliance Engine (TRACE) data from the Financial Industry Regulatory Authority (FINRA). Shows 1-minute average on-the-run volumes within the U.S. Treasury market.
*Refers to the volume traded, on average, across the second day of each scheduled FOMC meeting since May 2019.
B. Trading Volume by Participant Type
We next analyze trading activity by participant type around the event window in order to understand how each responds to statement releases. Dealers and PTFs account for the vast majority of traded volume on IDB platforms. We group the remaining participants into an "Other" category since they individually account for a small proportion of total daily volume.14 Figure 2 shows average 1-minute volumes by participant type across our sample of scheduled statement release days. In contrast with the average trading day, we observe increases in the volumes traded by all participant types following the statement release at 2:00 p.m. and, to a lesser extent, at the beginning of the Chair's press conference at 2:30 p.m.
Figure 2. Average 1-Minute Volume Traded by Participant Type across Scheduled FOMC Meetings*
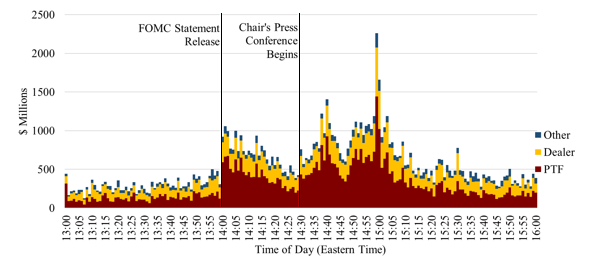
Note: Legend entries appear in graph in order from top to bottom.
Source: Authors' calculations based on Trade Reporting and Compliance Engine (TRACE) data from the Financial Industry Regulatory Authority (FINRA). Shows 1-minute average on-the-run volumes within the inter-dealer broker (IDB) venue of the U.S. Treasury market.
*Refers to the volume traded, on average, across the second day of each scheduled FOMC meeting since May 2019.
Volumes transacted by PTFs vary the most of any participant type on scheduled statement release days. In the minute preceding the statement release (that is, the minute starting at 1:59 p.m.), PTF volumes decline by more than 60 percent relative to the prior minute, before increasing sharply during the first minute following the statement release. Indeed, at both 2:00 and 2:30 p.m., PTFs exhibit larger increases in trading volumes than any other participant type.15
Figure 3 shows the proportion of average 1-minute volume across scheduled statement release days among pairings of dealers and PTFs (PTF to PTF, Dealer to/from PTF, and Dealer to Dealer).16 Following the statement release at 2:00 p.m., the proportion of trading between dealers and PTFs is little changed. Meanwhile, we observe an increase in the proportion of total volume transacted between PTFs from 20 to nearly 50 percent. This increase coincides with a sharp decrease in the proportion of trading between dealers, which declines from 14 to 3 percent.17 We see no such concurrent changes at 2:00 p.m. on the average trading day.
Figure 3. Average Proportion of Volume Traded by Pairing of Participant Types across Scheduled FOMC Meetings*
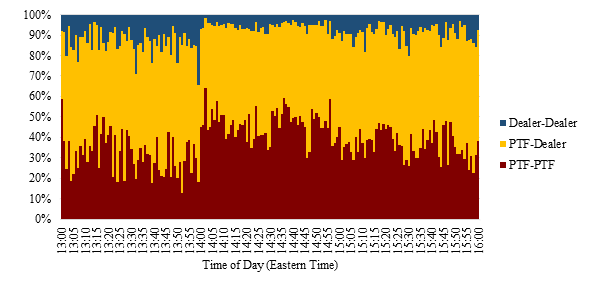
Note: Legend entries appear in graph in order from top to bottom.
Source: Authors' calculations based on Trade Reporting and Compliance Engine (TRACE) data from the Financial Industry Regulatory Authority (FINRA). Shows proportions of 1-minute average volumes of 10-year on-the-run securities within the inter-dealer broker (IDB) venue of the U.S. Treasury market.
*Refers to the volume traded, on average, across the second day of each scheduled FOMC meeting since May 2019.
Based on conversations with market participants, we posit several possible explanations for these patterns. First, some PTFs could have a comparative advantage in processing the information conveyed by the policy announcement. This advantage could entail faster abilities to transact based on the policy information, faster access to the news of the policy announcement through microwave towers, or more advanced natural language processing (NLP) of the language contained in the policy communications. Conversely, firms that are comparatively disadvantaged in these ways may retract from the market or widen bid-ask spreads to avoid exposure to unforeseen price movements. Additionally, some PTFs are likely attempting to intermediate profitable dealer flow. In so doing, some PTFs may trade with each other.
C. Concentration of Participant Types
We next examine the concentration of firm-level trading volumes within each participant type. Table 1 shows the average Herfindahl-Hirschman indices (HHI) from 1:45 p.m. to 1:59 p.m., at 2:00 p.m., and at 2:30 p.m. for each participant type. These HHI concentrations largely correspond to the numbers reported in previous FEDS Notes and the Joint Staff Report.18 The concentrations of both PTFs and dealers decrease in the minute following statement releases (that is, the minute starting at 2:00 p.m.) though the concentration of PTFs decreases more notably.
Based on conversations with market participants, we posit that the decrease in dealer concentration most likely reflects firms entering the market to fulfill actual or anticipated demands of end-investors. Moreover, the decrease in PTF concentration could reflect a combination of 1) heightened PTF competition to fulfill the liquidity demands of dealers, and 2) the entry of PTFs that seek to profit from the information conveyed by policy announcements.19 The concentrations of both PTFs and dealers subsequently increase gradually, and reach levels consistent with the average trading day by the start of the Chair's press conference (2:30 p.m.). These increases in concentrations could reflect a tapering of PTF liquidity provisioning as dealers reduce their demand for liquidity.
Table 1. Herfindahl-Hirschman Indices by Participant Type across Scheduled FOMC Meetings*
| Minute | Dealer HHI | PTF HHI | Dealer HHI Change | PTF HHI Change |
|---|---|---|---|---|
| Avg. (1:45-1:59) | 0.115 | 0.193 | ||
| 2:00 | 0.073 | 0.115 | -0.042 | -0.079 |
| 2:30 | 0.129 | 0.199 | 0.056 | 0.084 |
Source: Authors’ calculations based on Trade Reporting and Compliance Engine (TRACE) data from the Financial Industry Regulatory Authority (FINRA). This table shows the Herfindahl-Hirschman indices for major participant types for the 10-Year on-the-run security in the inter-dealer broker (IDB) venue of the U.S. Treasury market.
*Refers to the concentration of volume traded, on average, across the second day of each scheduled FOMC meeting since May 2019.
IV. Results for an Unscheduled FOMC Statement Release
Following the March 3, 2020 unscheduled meeting, the FOMC announced a 50-basis-point cut to the target range for the federal funds rate. Analyzing trading behavior during the event window could shed light on whether the above trading dynamics differ when the dissemination of policy information is not fully anticipated.
A. Trading Volume
There are several notable differences between the scheduled statement releases and the unscheduled statement release. In the minute following the unscheduled statement release, Treasury trading volumes increased more than nine times the average jump in volume that occurred following scheduled statement releases (Figure 4), though average daily volumes were also at the top of their recent historical distribution during this period.20 The outsized volumes on March 3 could stem in part from market participants not having the opportunity to retract or adjust quotes in advance of the statement release. High asset price volatility could also have contributed to these outsized trading volumes as volumes typically increase during periods of heightened volatility.
B. Trading Volume by Participant Type
Similar to scheduled statement release days, PTFs transacted greater volumes than any other participant type following the statement release on March 3 (Figure 4). Indeed, in the minute immediately following the statement release, the 1-minute volume transacted by PTFs was nearly ten times greater than the average volume transacted by PTFs in the minute following scheduled statement releases. Unlike scheduled statement releases, however, PTFs quickly tapered their activity, with their volumes declining by two-thirds in the subsequent minute (that is, the minute starting at 2:01 p.m.).
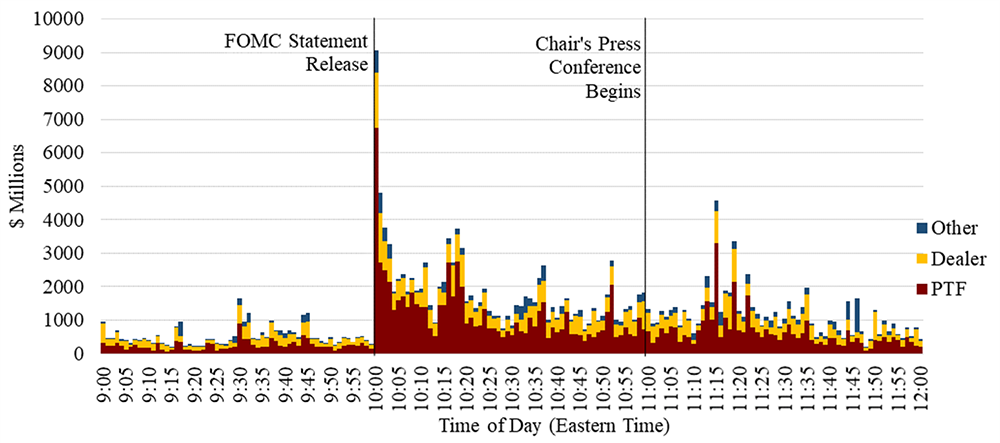
Note: Legend entries appear in graph in order from top to bottom.
Source: Authors' calculations based on Trade Reporting and Compliance Engine (TRACE) data from the Financial Industry Regulatory Authority (FINRA). Shows 1-minute average volume within the inter-dealer broker (IDB) venue of the U.S. Treasury market.
We posit several explanations for this behavior. Firstly, some market participants may not have been able to adjust their quotes in response to the increase in volatility from the statement release. In turn, many of their limit orders could have been executed by market participants who were able to more rapidly process the information conveyed by the statement release. Indeed, we observe that PTFs aggressed nearly all trades that occur in the 1 second following the unscheduled statement release (not shown).21 Secondly, some PTFs may have been able to immediately scale their liquidity provisioning in anticipation of increased liquidity demand from dealers. Although we see a drastic increase in PTF volumes, we see no clear change in the market concentration of PTFs preceding or following the statement release (not shown).
VII. Conclusion
This analysis uses TRACE data to explore changes in trading activity of on-the-run cash Treasury securities in the IDB venue around FOMC statement releases. Following both scheduled and unscheduled statement releases, we observe that PTFs transact more than any other participant type, and often trade with other PTFs. We also observe a stark decrease in PTF concentration following scheduled statement releases but not following an unscheduled statement release. Based on anecdotal information from market participants, we posit that these patterns reflect some combination of 1) intense competition among PTFs to capture profitable dealer order flow, and 2) a comparative advantage of some PTFs over other market participants to process and trade upon information conveyed by the statement release in an attempt to profit from perceived market mispricing. Overall, this analysis serves as a first step towards better understanding how Treasury market participants respond to the release of monetary policy communications, and perhaps new information more generally.
References
Brain, Doug, Michiel De Pooter, Dobrislav Dobrev, Michael Fleming, Pete Johansson, Collin Jones, Michael Puglia, Frank Keane, Liza Reiderman, Tony Rodrigues, and Or Shachar (2018). "Unlocking the Treasury Market through TRACE," FEDS Notes. Washington: Board of Governors of the Federal Reserve System, September 28, 2018.
Brainard, Lael (2018), "The Structure of the Treasury Market: What Are We Learning?".
Fleming, Michael, Piazzesi, Monika (2005), "Monetary Policy Tick-by-Tick", Bank of Canada.
Harkrader, James Collin, and Michael Puglia (2020). "Principal Trading Firm Activity in Treasury Cash Markets," FEDS Notes. Washington: Board of Governors of the Federal Reserve System, August 04, 2020.
Haynes, Richard, and John Robert (2015). "Macro News Announcements and Automated Trading (PDF)." Commodity Futures Trading Commission, December 2015.
Joint Staff Report, 2015, "The U.S. Treasury Market on October 15, 2014," U.S. Department of the Treasury, Board of Governors of the Federal Reserve System, Federal Reserve Bank of New York, U.S. Securities and Exchange Commission, and U.S. Commodity Futures Trading Commission.
* James Collin Harkrader is at the Federal Reserve Board and can be reached at [email protected]; Daniel Weitz is at the Federal Reserve Bank of New York and can be reached at [email protected]. Return to text
1. This analysis was conducted within the context of broader work on the Treasury TRACE data by partner agencies in the Interagency Working Group on Treasury Market Surveillance (IAWG). The IAWG's aims are to enhance official-sector monitoring of the Treasury securities market and improve understanding and transparency of this market more generally, while not impeding market functioning and liquidity. The authors would like to thank Ayeh Bandeh-Ahmadi, Michiel De Pooter, Dobrislav Dobrev, Michael Fleming, Pete Johansson, Don Kim, Andrew Meldrum, Michael Puglia, Nicholas Steele, and Brandon Taylor for their invaluable comments and feedback. Return to text
2. Throughout this note, the term statement release refers to all policy communications released at the conclusion of FOMC meetings. These include the post-meeting statement, which contains the rate announcement, and – on a quarterly basis - the Summary of Economic Projections. Return to text
3. Both here and throughout the document, concentration refers to our calculation of the Herfindahl-Hirschman Index (HHI), a commonly accepted measure of market concentration which we calculate by squaring the market share of each firm within a given participant type (dealers, PTFs, or other), and then summing the resulting numbers. It takes values between 1/N and 1, where N is the number of firms in each participant type. Values of the index closer to 1 indicate a higher degree of concentration within each participant type. This calculation of HHI is the same as that employed by the 2015 Joint Staff Report (PDF). Return to text
4. The 2015 Joint Staff Report defines latency as the time between when an order is generated by a firm and when it gets added to the order book at an exchange. Return to text
5. Between 04/2011 and 12/2018, the Chair held press conferences four times per year, and thus at every other meeting. Return to text
6. For a more detailed description of the structure of the Treasury market, see Doug Brain and others (2018a). Return to text
7. For additional information on PTF activity in Treasury markets, see Harkrader and Puglia (2020). Return to text
8. While outside the scope of the present analysis, our preliminary examination of major macroeconomic data releases—such as the Employment Situation Report—show that changes in Treasury volumes immediately following these releases are qualitatively in line with those observed on FOMC statement release days, although smaller in magnitude. Return to text
9. The collection of the Treasury TRACE data stems from official sector efforts to better understand market functioning and liquidity following the events of October 15, 2014, when the yield-to-maturity on the 10-year Treasury Note experienced a 37 basis-point round trip over the course of the day and which was analyzed in detail in the 2015 Joint Staff Report (PDF). Return to text
10. The scheduled FOMC meeting days in our sample are May 1, 2019, June 19, 2019, July 31, 2019, September 18, 2019, October 30, 2019, December 11, 2019, January 29, 2020, April 29, 2020, June 10, 2020, July 29, 2020, September 16, 2020 and November 5, 2020. We also analyze March 3, 2020—when the FOMC held an unscheduled meeting—separately, as one could reasonably expect the trading dynamics associated with unscheduled meetings to differ from those surrounding anticipated meetings. We omit a second unscheduled meeting on March 15, 2020 from our analysis entirely, as it occurred on a Sunday when most financial markets were closed. Return to text
11. We also do not distinguish between meetings based upon whether or not they are accompanied by the release of an SEP. A preliminary analysis did not show any meaningful differences in trading volumes on meeting days where an SEP release accompanied the FOMC statement. Return to text
12. There are several potential drivers of the spike in intraday volumes at 3:00 p.m. First, rebalancing of fixed income indices occurs at 3 p.m. Anecdotally, market participants have also associated this time with the rebalancing of passive bond funds by asset managers, a trend which is particularly acute on the last trading day of the month (July 31, 2019, one of the event days captured in our sample, falls on the last trading day of the month). Return to text
13. In unreported results, we find that immediately preceding the statement release, volumes drop most precipitously for shorter maturity tenors and, in general, following the statement release, volumes for these same tenors increase by more than their longer-dated counterparts. These results support the notion that the policy information communicated by the FOMC statement, the SEP projections, and Chair's press conference have the greatest impact on the front end of the yield curve. See Fleming and Piazzesi (2005) (PDF) for detailed analysis of changes in yields on FOMC statement release days. Return to text
14. This category includes participants not categorized elsewhere, such as hedge funds and asset managers. Return to text
15. Unreported results show that the majority of PTFs increase their trading volumes following the 2:00 p.m. statement release and again following the start of the Chair's press conference at 2:30 p.m. A smaller number of PTFs transacted in elevated volumes from the statement release through the end of the Chair's press conference (that is, between 2:00 p.m. and about 3:30 p.m.). Return to text
16. We omit the "Other" category as it represents a very small proportion of overall trading volume. Return to text
17. These proportions are estimates. The TRACE data includes both sides of each transaction, the buy and the sell. However, these sides are reported separately. We use a matching procedure to find the corresponding buy/sell for each sell/buy. See Harkrader and Puglia (2020) for a detailed description of this procedure. Return to text
18. See Harkrader and Puglia (2020). Return to text
19. Haynes and Roberts (2015) examine 10-year Treasury futures volumes around macroeconomic news announcements. They observe a notable increase in the passive positions of automated traders immediately following the announcements, in conjunction with an increase in the number of accounts that are actively trading. These findings conform to our observations of similar dynamics in the cash Treasury market. Specifically, we observe an increase in PTF and dealer volumes, and a decrease in PTF and dealer concentrations, immediate following the release of scheduled FOMC statements. Since PTFs exclusively employ automated trading strategies (whereas dealers employ both automated and manual strategies), one would expect these trading patterns to be most pronounced among PTFs. Return to text
20. TRACE Treasury Aggregate Statistics provide average daily trading volumes in U.S. Treasury securities reported to TRACE across each week beginning in March 2020. The highest average trading volume was recorded during the week of the unannounced FOMC meeting. Return to text
21. We identify which participant type aggressed the trade by merging data from TRACE and BrokerTec. See Harkrader and Puglia (2020) (PDF) for details on this merging procedure. Return to text
Harkrader, James Collin, and Daniel J. Weitz (2020). "How Do Principal Trading Firms and Dealers Trade around FOMC Statement Releases?," FEDS Notes. Washington: Board of Governors of the Federal Reserve System, December 31, 2020, https://doi.org/10.17016/2380-7172.2827.
Disclaimer: FEDS Notes are articles in which Board staff offer their own views and present analysis on a range of topics in economics and finance. These articles are shorter and less technically oriented than FEDS Working Papers and IFDP papers.