FEDS Notes
June 12, 2020
How do Rural and Urban Retail Banking Customers Differ?
David Benson, Serafin Grundl and Richard Windle*
This note documents differences and similarities between rural and urban retail banking clients using data from the Board's Survey of Consumer Finances (SCF). Understanding geographic differences in local demand conditions for banking is important for designing effective public policy. Regulations and market interventions affecting the supply of banking products and services could impact rural and urban areas differently because of rural-urban consumer heterogeneity. Moreover, if policies treat banks in rural areas differently from their urban counterparts, it is crucial to understand differences in consumer preferences and behavior.
For example, antitrust authorities might consider greater leniency toward proposed bank mergers in rural areas. Many banks operating in rural areas are relatively small and less profitable than larger banks that can exploit economies of scale. Community banks in rural areas also report facing challenges from shrinking populations and succession planning which mergers and acquisitions could help to remedy.1
However, banking customers in rural areas may be harmed if mergers in rural areas are treated more leniently. Rural communities have reported increasing costs in accessing financial services, in part due to branch closures in areas which already have fewer choice alternatives (Board of Governors of the Federal Reserve System, 2019). Mergers further reduce rural consumers' choice alternatives and increase rural banks' market power.
Differences between urban and rural banking customers could also shape the local effectiveness of monetary policy. Market power in deposit taking has been shown to affect bank pass-through of interest rate adjustments by a monetary authority (Adams and Amel, 2011; Drechsler et al., 2017). Market power in turn depends on banking clients' reasons for choosing their financial institution, as well as on their willingness and ability to switch banks and to search for alternative borrowing and savings options.
We investigate whether differences between urban and rural banking clients give grounds for more lenient antitrust policy and less aggressive monetary policy in rural areas. In the SCF, we find that conditional on using banking services, rural and urban retail banking clients have similar reasons for choosing their primary financial institution, visit brick-and-mortar branches at similar rates, and use direct deposit and autopay services with similar frequency. There are several notable differences, however.
Perhaps most importantly, rural households are less likely to use online banking, and are less likely to use the internet to obtain information for borrowing and savings decisions. Rural households are also more likely to be "unbanked" and tend to travel farther for banking services than urban households. Rural households are less likely to have high search intensity for banking as well, evidence consistent with greater search costs in rural banking markets. These differences suggest that it is more difficult for rural banking clients to leave their bank if they are confronted with quality degradation or a price increase. Therefore, these differences do not justify greater leniency towards proposed bank mergers in rural areas, and suggest that monetary policy interventions may be less effective in rural areas.
Survey of Consumer Finances
Using SCF data at the Federal Reserve Board2, we document households' branch visitation, use of direct deposit and autopay services, households' distances to their chosen bank and their primary reasons for choosing that financial institution, their adoption of online banking and use of the internet for gathering banking information, as well as households' search or shopping intensities for good deals on savings and credit products. We compare the most recent survey wave to the findings from earlier waves going back to 2004. This allows us to document current differences, as well as detect any differential trends between rural and urban markets.
The sample size is 6,254 households for 2016 and ranges from 4,421 to 6,492 for the earlier waves between 2004 and 2013. We divide the sample into three groups. The first group are households in large metropolitan statistical areas with more than 1.5 million residents ("Large MSAs"). There are 40 such MSAs. The second group are households in MSAs with fewer than 1.5 million residents. There are 344 such MSAs ("Small MSAs"). The third group are households outside of MSAs ("Rural Areas"). In the 2016 SCF, the large MSA group accounts for 57 percent of the sample, households from small MSAs make up 30 percent, and households from rural areas comprise 13 percent. A finer breakdown of rural areas would be desirable, because some of these areas are likely similar to small MSAs. However, a finer breakdown is not practical due to the limited sample size.
Evidence from the Latest Survey Wave
Our analysis proceeds in two steps. First we consider the latest SCF wave from 2016, and describe cross-sectional differences between urban and rural areas at this point in time. Next, we study how urban and rural markets have changed over time. This allows us to see whether differences have become larger over time, and may also allow us to predict how differences will evolve in the future. Table 1 summarizes the survey responses from 2016.
Table 1: 2016 SCF: Unless otherwise noted all figures are percentages. Large MSAs have more than 1.5 million inhabitants.
| Large MSA | Small MSA | Rural Areas | |
|---|---|---|---|
| Demographics | |||
| Age (in years) | 52 | 51 | 54 |
| Bachelor's Degree | 40 | 28 | 21 |
| Nonwhite | 42 | 29 | 26 |
| Unbanked | |||
| Do not have checking or savings account | 5.7 | 7.6 | 9.2 |
| Internet Usage | |||
| Use online banking | 75 | 68 | 56 |
| Use internet to find borrowing information | 56 | 51 | 43 |
| Use internet to find saving information | 44 | 39 | 32 |
| Branch Usage, Direct Deposit, Autopay | |||
| Visit branch in person | 79 | 78 | 78 |
| Use Direct Deposit | 85 | 84 | 83 |
| Use Automatic Payment | 66 | 64 | 63 |
| Distance to Nearest Branch (in miles) | |||
| 10th percentile | 0 | 1 | 1 |
| 25th percentile | 1 | 2 | 4 |
| 50th percentile | 2 | 4 | 10 |
| 75th percentile | 9 | 27 | > 50 |
| 90th percentile | > 50 | > 50 | > 50 |
| Reason for Choosing Main Institution | |||
| Location | 43 | 34 | 42 |
| Many Services | 14 | 14 | 17 |
| Low Fees | 13 | 14 | 10 |
| Number of Institutions | |||
| 0 | 3.7 | 3.8 | 5.3 |
| 1 | 28 | 34 | 36 |
| 2 | 28 | 30 | 29 |
| 3 | 18 | 17 | 16 |
| 4 | 10 | 8 | 6 |
| 5 or more | 13 | 8 | 7 |
| Search Intensity: Borrowing | |||
| Very Low Intensity | 13 | 16 | 17 |
| Low Intensity | 7 | 7 | 8 |
| Medium Intensity | 18 | 19 | 20 |
| High Intensity | 28 | 25 | 22 |
| Very High Intensity | 34 | 33 | 33 |
| Search Intensity: Savings | |||
| Very Low Intensity | 16 | 18 | 21 |
| Low Intensity | 9 | 11 | 10 |
| Medium Intensity | 23 | 21 | 24 |
| High Intensity | 27 | 25 | 22 |
| Very High Intensity | 25 | 26 | 23 |
| Share of Households | 57 | 30 | 13 |
Demographics
We begin with some basic demographics for the three household groups. Households in rural areas are on average slightly older (54 years) than households in large MSAs (52 years) and in small MSAs (51 years). They are also substantially less likely to have a bachelor's degree (21%) compared to those in large MSAs (40%) and small MSAs (28%); and are more likely to white than respondents in MSAs. Easing some concerns we have with our urban-rural household group definitions, the demographic differences between urban and rural areas in the SCF are largely consistent with those reported from other data sources.
The Unbanked
The "unbanked" are households with neither a checking nor a savings account. In the 2016 SCF, households in rural areas are substantially more likely to be unbanked (9.2%) than households small MSAs (7.6%), and in large MSAs (5.7%). More generally, households in rural areas are customers of a smaller number of financial institutions than households in MSAs, as shown in Table 1. Rural consumers are substantially more likely to be unbanked, and significantly less likely than urban consumers to have three or more financial institutions. Participation in the banking sector is an important margin in the context of public policy, as it captures a consumer's primary "outside option" to choosing any retail bank. Mergers reduce the number of available banking options and, if market power significantly increases, can raise prices or reduce quality. A smaller number of banking options, higher prices, and lower quality might spur even more rural consumers to leave the banking sector. Greater substitution outside the banking sector also diminishes the local effectiveness of monetary policy. Therefore, these data do not support more lenient antitrust policy for rural banks, nor do the data suggest monetary policy is more effective in rural areas.
Internet Usage
Residents of rural areas typically have fewer available banking options with a local branch presence. However, the rise of online banking likely reduced the importance of branches in rural markets, and residents of rural areas who have internet access can choose among many alternatives that do not have a local branch presence. These online competitors potentially limit the market power of banks with a local presence, even if the number of local options is substantially reduced through mergers. In addition, the internet is useful to collect information about borrowing and saving options and to compare prices, even for banks with a local branch presence. If the internet expands rural consumers' banking options and makes it easier to compare different borrowing and saving options, this could increase competition among banks and may therefore mitigate the anticompetitive effects of rural mergers.3
In the SCF, households in rural areas are substantially less likely to adopt online banking (56%), and to use the internet to find information about either borrowing (43%) or saving (32%), than households in MSAs. For comparison, in large MSAs 75% of households use online banking, 56% use the internet to gather borrowing information, and 44% to gather saving information. The figures for small MSAs fall between large MSAs and rural areas for all three items, see Table 1.
There are various interpretations of this evidence. Residents of rural areas are less likely to have broadband internet access, or even internet access altogether, than residents of MSAs. In addition, the rural online banking gap may be due to demographic factors that differ in rural and urban areas, such as age or wealth. Lastly, the gap may also be due to varying quality of online banking options. Large banks that tend to operate predominantly in MSAs also tend to offer better or more comprehensive online banking services.
Branch Usage, Direct Deposit and Autopay
Branch visitation and the use of direct deposit and autopay services are important indicators of convenience. However, use of direct deposit and autopay can also result in switching costs that reduce competition among banks (Kiser, 2002). In the 2016 SCF, there are no substantial differences between rural areas and MSAs in the usage of local branches, direct deposit, or autopay.
Distance to the Nearest Branch
Branch density is an important consideration in merger policy. Close proximity implies banks are closer substitutes, and hence are more likely to compete head-to-head for consumers. As consumers have to travel farther to obtain branch services, their banking options become more distant substitutes. A merger of banks in close proximity can result in branch closures, because the merged bank does not want one branch to compete with its own other branches for consumers. Alternatively, mergers between geographically distant banks can reduce consumers' distances to branches by expanding the merged entity's branch network, increasing consumer access to banking services.
The distances traveled for branch services also affects the critical mass of consumers needed to sustain a bank branch. Merging parties often argue that one of the merging banks is too small to profitably operate branches in rural areas that are not densely populated, and that these branches can only be preserved through mergers. Depending on the relative importance of these two factors, substitutability versus market size, branch distance considerations could support a more lenient or a more stringent approach to antitrust in rural areas.
In the data, residents of rural areas have to travel much farther to the nearest branch of their main institution. For example, the median distance to the nearest branch is 2 miles in large MSAs, 4 miles in small MSAs, and 10 miles in rural areas. Greater distance suggests rural banks are likely weaker substitutes, and compete less fiercely, than urban banks. However, notice that this argument assumes that the greater distance to branches is not solely driven by differences in household preferences. If rural households are simply willing to travel much greater distances to the nearest branch, then competition among rural banks may be equally fierce than among urban banks.
Reasons for Choosing Main Institution
The SCF also asks households about their preferences by soliciting the most important reasons for choosing their main institution. Table 1 lists the three most common answers. Preferences are similar in rural areas and MSAs, with location being the most important reason across all three household groups. This strong revealed preference for location in bank selection underscores the policy relevance of consumer distances to branches and bank substitutability.
Households in rural areas are also somewhat more likely to name "many services" and somewhat less likely to name "low fees" as a primary reason for choosing their financial institution. One possible interpretation for this pattern is that in MSAs most banks offer a large number of services, so service offerings are less important for consumers to distinguish banks in urban markets. Whereas the number and types of services varies more among banks in rural areas, service offerings are relatively more important for consumers to distinguish between rural banks.
Search intensity
Search or shopping effort is another indicator of healthy competition. If search costs are low, consumers are more likely to substitute between their choice alternatives. In the SCF, households are asked to self-report their search intensity for good deals in borrowing and savings using a five-point scale from "very low" to "very high" search effort. We find that the fraction of households recording "high" or "very high" borrowing search intensity is 8%-10% greater than the corresponding fraction reporting high or very high search intensity for savings. Greater search intensity for borrowing may indicate a lower cost of search for credit products relative to savings products, a higher opportunity cost of obtaining good terms of credit, or relatively less information on borrowing options.
Rural search intensity is lower than urban search intensity for both borrowing and savings. The fraction of households reporting high or very high search intensity in rural areas was 7% lower than households in MSAs. Lower search intensity in rural areas suggests rural consumers may have a greater cost of searching. Lower search effort is consistent with traveling farther distance to bank branches, and with using the internet less to obtain borrowing and savings information.
Evolution of Urban-Rural Differences Over Time
We now examine trends in responses over prior waves of the SCF, from 2004-2016. The data are plotted in Figures 1-5. All measures exhibit some evolution over time. Most survey questions have highly correlated trajectories across rural, small MSA, and large MSA household groups.
Demographics
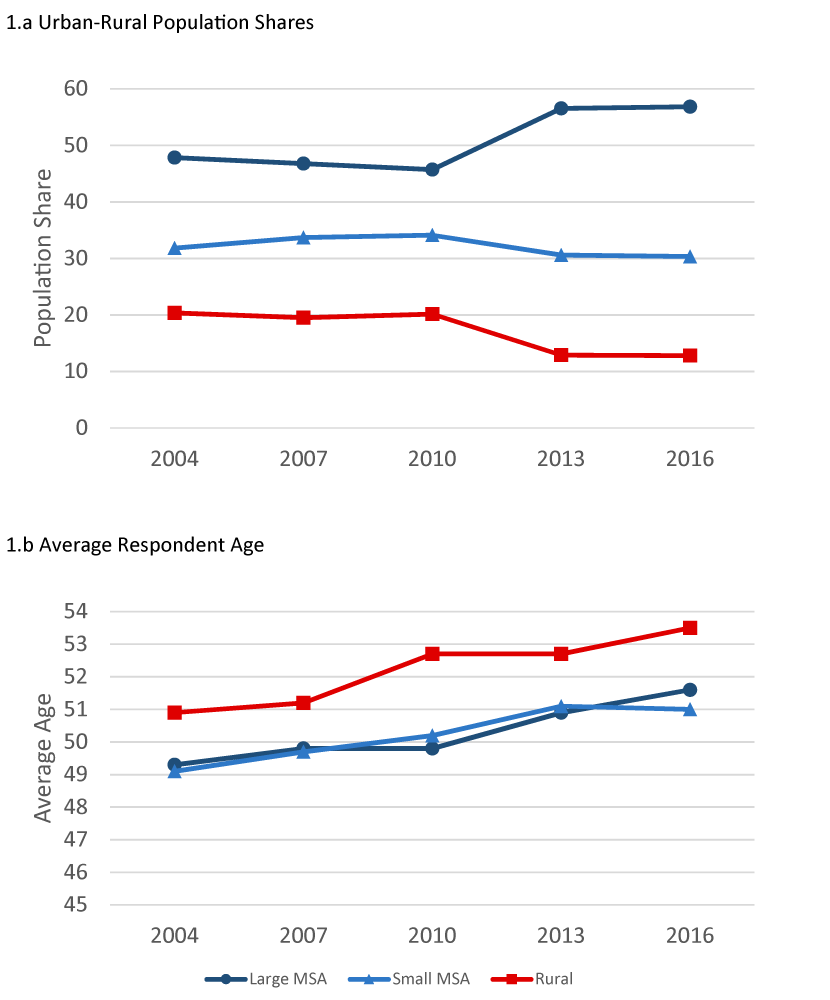
We begin with trends in household demographics, plotted in Figure 1. The proportion of SCF households living in large MSAs increased from 2004 to 2016 (+9%) and decreased in both rural areas (-7.6%) and small MSAs (-1.5%). Notice that during this time the MSAs themselves also grew. Age across the rural-urban household groups trended upward in parallel, and households in rural areas remained slightly older compared to households in MSAs across survey waves. While the prevalence of non-white SCF households increases over time, there is no differential change in racial compositions between rural areas and MSAs.
Source: Board of Governors of the Federal Reserve System (U.S.), Survey of Consumer Finances.
Unbanked
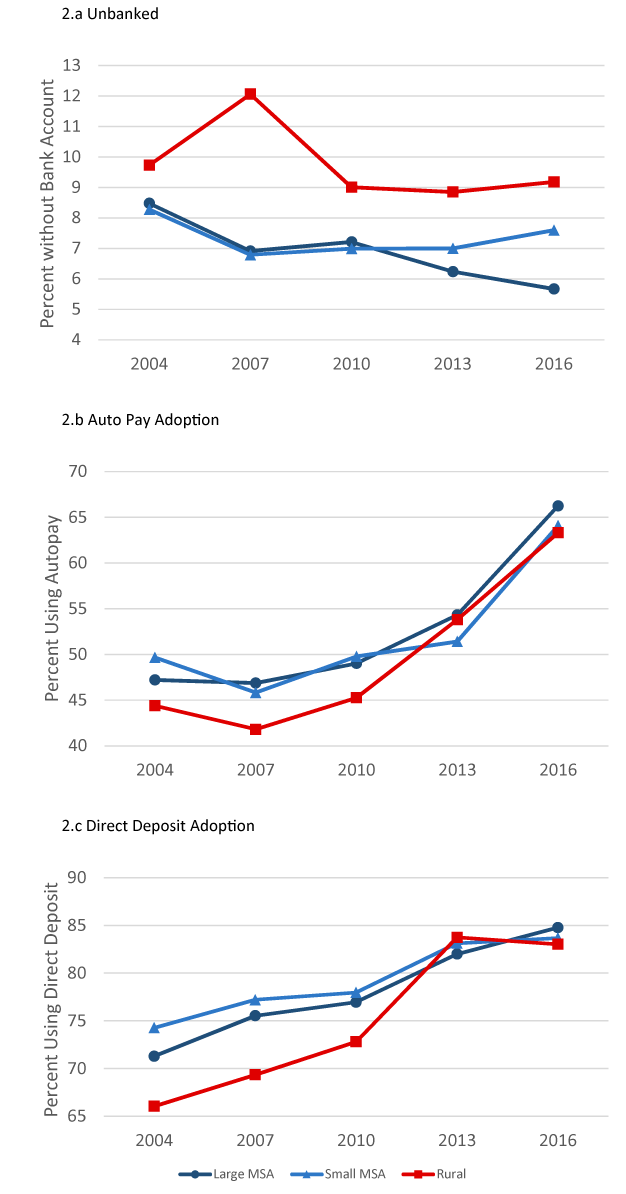
Figure 2 plots trends in respondents' use of banking services. The fraction of all households without a checking or savings account shrank from 2004-2016 2a). The unbanked proportion was largest in rural areas throughout the period. The relative decline in the unbanked population from 2004-2016 was actually smallest in rural areas (-5.7%), followed by small MSAs (-8.2%). In large MSAs, the fraction of unbanked households fell from 8.5 to 5.7, having the greatest relative decline of -33%. These data suggest an overall increase in consumer welfare stemming from the banking sector since 2004. Reduced substitution outside the banking sector also suggests monetary interventions may have become relatively more effective since 2004.
Source: Board of Governors of the Federal Reserve System (U.S.), Survey of Consumer Finances.
Branch Usage, Direct Deposit and Autopay
In the 2016 SCF wave, there were no substantial differences between rural areas and MSAs in use of branches, autopay, or direct deposit. We cannot examine trends in branch use, because branch use was not surveyed in SCF waves prior to 2016. However, trends in autopay and direct deposit use are observable in Figure 2b and Figure 2c, respectively.
Disparity in use of autopay services between rural areas and MSAs was larger than in 2004 than in 2016. In 2004, the fraction of households in rural areas reporting autopay use was 44.4%, compared to 49.7% in small MSAs, and 47.2% in large MSAs. The 2004 rural-urban gap in autopay usage (-5.3%) persisted into 2007 (-5.1%), but disappeared over 2007-2013 (-0.5%).
Differential trends in direct deposit use were more pronounced but similar. In the 2004 SCF, 66.1% of households in rural areas used direct deposit, versus 74.3% in small MSAs and 71.3% in large MSAs. The 2004 rural-urban gap in direct deposit use (-8.2%) continued into 2007 (-7.9%), and was closed by 2013 (-0.5%).
Distance to the Nearest Branch
Strikingly, there are no trends in the distribution of consumer distances to branches, nor are there differential trends between rural areas and MSAs in branch distance between 2004 and 2013. The methodology for recording branch distances changed with the 2016 survey wave from self-reported distances to distances calculated using external data. The methodology change prevents direct comparison to earlier years, but the differences between rural areas and MSA in 2016 are similar to earlier years.
Internet Usage
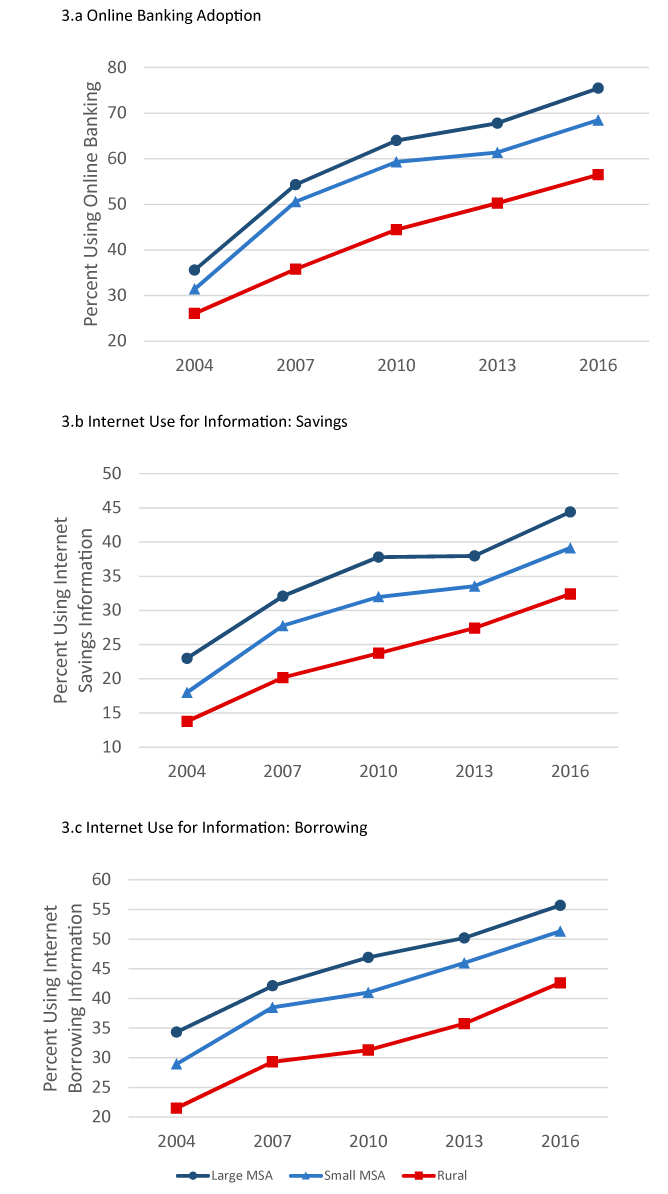
Use of the internet for banking markedly increased throughout 2004-2016. Figure 3 plots respondents' adoption of online banking (Figure 3a) and use of the internet to obtain information for making savings decisions (Figure 3b) and for making borrowing decisions (Figure 3c). Households in rural areas reported less internet use for banking compared to households in MSAs in all survey waves. Rural and MSA internet use trajectories are very similar, hence the relative gaps from 2004 persist to present day. The data suggest internet utilization in rural areas lags utilization in large MSAs by approximately ten years.
Source: Board of Governors of the Federal Reserve System (U.S.), Survey of Consumer Finances.
Adoption of online banking was slightly more accelerated in MSAs than in rural areas. The fraction using online banking services more than doubled from 2004-2016: from 26.1% to 56.5% in rural areas, from 31.4% to 68.5% in small MSAs, and from 35.6% to 75.5% in large MSAs. The proportion of households using the internet to obtain information for banking decisions also grew dramatically. The fraction using the internet for borrowing information increased over 2004-2016 from 21.5% to 42.6% in rural areas, from 28.9% to 51.3% in small MSAs, and from 34.3% to 75.5% in large MSAs. Internet use for savings information remains less frequent than internet use for borrowing information through all SCF waves, but trended similarly over 2004-2016. The fraction using the internet to obtain savings information increased from 13.8% to 32.4% in rural areas, from 18% to 39% in small MSAs, and from 23% to 44.4% in large MSAs.
Reasons for Choosing Main Institution
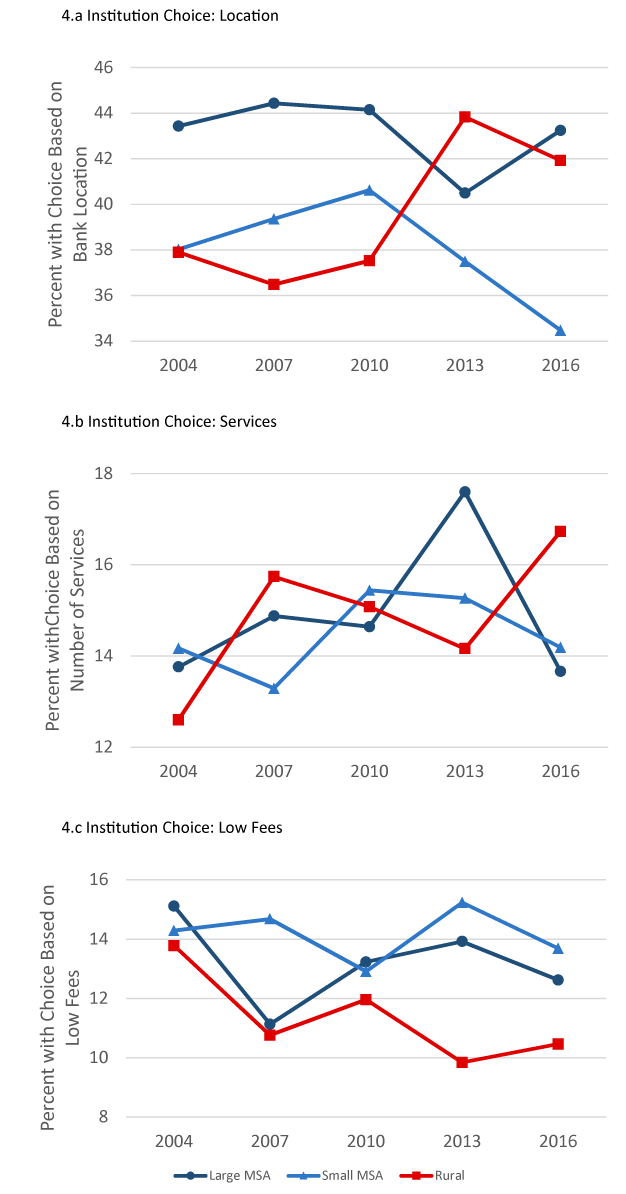
Consumers' overall ranking of primary reasons for choosing their bank remained relatively stable over time.4 Revealed preferences of households in rural areas saw the most change over 2004-2016. Figure 4 plots the proportion of respondents making their choice based on location (Figure 4a), how many services are offered (Figure 4b), and low fees (Figure 4c).
Source: Board of Governors of the Federal Reserve System (U.S.), Survey of Consumer Finances.
The fraction of rural households listing bank location as most important also increased by 4%. The proportion of rural households citing number of services as the reason for choosing their bank increased 4.1%, and the proportion citing fees as most important fell by -3.3%. In large MSAs, revealed preference for branch location and number of services services did not change from 2004-2016, while the fraction of households ranking fees as most important fell 2.5%. In small MSAs, revealed preference for branch location fell 3.6%. There are several possible interpretations of these trends, the most probable explanation being shifting demographics.
Search Intensity
Figure 5 illustrates the evolution across survey waves of household intensity of search for good deals in savings (Figure 5a) and borrowing (Figure 5b). Search intensity in rural areas remained lower than search intensity in urban areas across all SCF waves. However, the overall fraction of households reporting "high" or "very high" search intensity for both borrowing and savings increased over 2004-2016. Search effort trended upward similarly in rural and urban areas for both borrowing and savings.
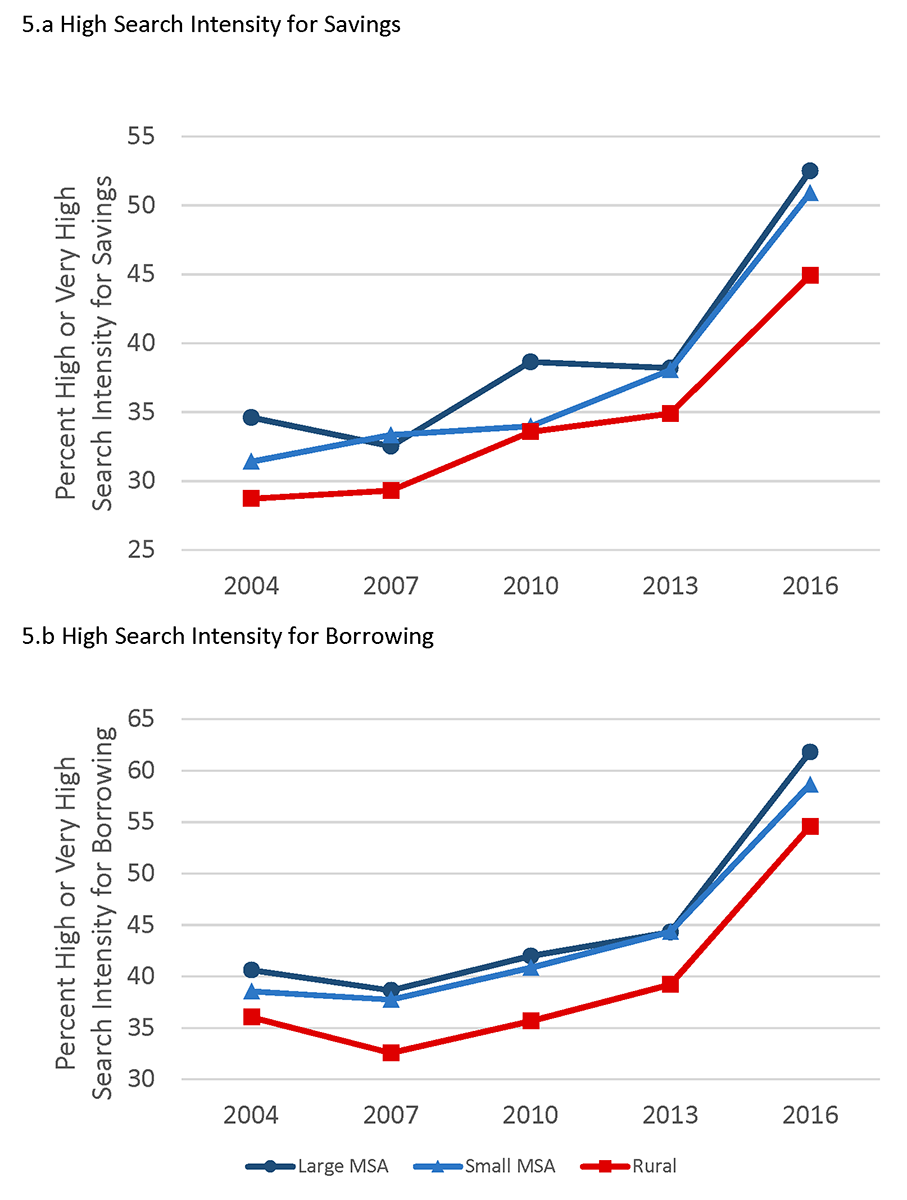
Source: Board of Governors of the Federal Reserve System (U.S.), Survey of Consumer Finances.
The overall increase in high and very high search intensity suggests the costs of searching for good deals in borrowing and savings may have fallen over time, or perhaps that information is more readily available. The persistent gap in rural search intensity suggests that search for banking products remains more costly in rural areas. These patterns are consistent with growing internet use for banking over time.
Takeaways
Overall, the data paint a picture of rural and urban consumers with similar preferences for banking products and services. Rural consumers, however, travel greater distances to obtain banking services, use internet banking less, obtain less information to make banking decisions, and search less intensely for good deals in banking. However, if anything, these differences suggest that it is more difficult for rural customers to switch their bank if they are confronted with degraded quality or a price increase. Therefore, the differences do not support more lenient antitrust policy in rural areas, and suggest that monetary policy may be less effective in rural areas.
References
Adams, R. M., Amel, D. F., 2011. Market structure and the pass-through of the federal funds rate. Journal of Banking & Finance 35 (5), 1087 – 1096.
Anenberg, E., Chang, A. C., Grundl, S., Moore, K. B., Windle, R., 2018. The branch puzzle: Why are there still bank branches? FEDS Notes. Board of Governors of the Federal Reserve System.
Board of Governors of the Federal Reserve System , Novermber 2019. Perspectives from main street: Bank branch access in rural communities.
Drechsler, I., Savov, A., Schnabl, P., 2017. The deposits channel of monetary policy. The Quarterly Journal of Economics 132 (4), 1819–1876.
Kiser, E. K., 2002. Predicting household switching behavior and switching costs at depository institutions. Review of Industrial Organization 20, 349 – 365.
∗Federal Reserve Board of Governors, [email protected], [email protected], [email protected]. We thank Kevin Moore, Beth Kiser and Gloria Sheu for helpful comments and suggestions. The analysis and conclusions set forth are those of the authors and do not indicate concurrence by other members of the staff, by the Board of Governors, or by the Federal Reserve System. Return to text
1. “Community Banking in the 21st Century, 2018 National Survey.” Conference Report. Co-sponsors: the Federal Reserve System, the Conference of State Bank Supervisors, and the Federal Deposit Insurance Corporation. Return to text
2. The analysis uses an internal version of the SCF data that contains geographic identifiers. Return to text
3. For analysis of the importance of online banking see Anenberg et al. (2018). Return to text
4. Primary reason for choosing a bank is the reason the household chose the institution of their main checking account. Return to text
Benson, David, Serafin Grundl, and Richard Windle (2020). "How do Rural and Urban Retail Banking Customers Differ?," FEDS Notes. Washington: Board of Governors of the Federal Reserve System, June 12, 2020, https://doi.org/10.17016/2380-7172.2513.
Disclaimer: FEDS Notes are articles in which Board staff offer their own views and present analysis on a range of topics in economics and finance. These articles are shorter and less technically oriented than FEDS Working Papers and IFDP papers.