FEDS Notes
October 20, 2020
Improving Housing Payment Projections during the COVID-19 Pandemic
Jeff Larrimore and Erin Troland
COVID-19 caused widespread job loss, raising concerns about whether people can still cover their rent or mortgage expenses. Policymakers and researchers are working to understand the effects of the pandemic on housing payments and predict future payment rates. The weekly Census Household Pulse Survey is a key source of data for analyzing and forecasting the effect of COVID-19 on household finances.1 In the last week of May, data from the survey showed that nearly one in three renters had little to no confidence they would pay rent on time in June. However, by June, the survey showed that a higher fraction of renters did end up making their June payments on time. As a result, this common approach to predicting future housing payments using the Census data underestimates future payment rates.
This note uses a key feature of the Census Pulse data to present a new method for estimating future rent and mortgage payments that better aligns with actual payments. A small subgroup of Census Pulse survey respondents take the survey in consecutive weeks. For these respondents, we can observe both their expectations of paying their rent and whether they actually made their payment. This new method is intended to predict payment rates for the upcoming month, which is one measure of financial distress. However, someone who ultimately does make their rent payment on time despite having no confidence in doing so the previous month may still be experiencing other types of financial distress.
Specifically, the Household Pulse Survey tracks rent and mortgage payments through two questions. The first is a backward-looking question that asks respondents a yes/no question about whether they paid their rent or mortgage on time last month.2 The second question is a forward-looking question that asks "how confident are you that you will be able to pay your next rent or mortgage payment on time?" Respondents to this question can select their level of confidence as either "no confidence," "slight confidence," "moderate confidence," or "high confidence;" or they can report that their rent will be deferred in the next month.
Most analyses of these data aggregate the confidence levels into two groups: respondents who have no or slight confidence that they will be able to make their housing payment, and those who have either moderate or high levels of confidence (see e.g. Callen 2020, Green and McCargo 2020). Doing so follows a common approach for aggregating survey responses when respondents are presented four answer choices. For example, the Federal Reserve Board (2020) frequently aggregates responses in this way when discussing the Survey of Household Economics and Decisionmaking.
Yet when comparing the housing payment confidence results with actual payments in the subsequent month, these groupings do not well align with payments that actually occur. In June, 68 percent of renters indicated that they were at least moderately confident that they would be able to pay their July rent on time. However, in July, 80 percent of renters reported that they actually paid their last rent payment on time – a 12 percentage point gap. Although the gap is smaller among homeowners, 84 percent of homeowners with a mortgage were at least moderately confident that they would pay their mortgage on time in July compared to 87 percent who did so. Consequently, a binary approach such as this for analyzing these data results in a substantial underestimate of the share who will subsequently make housing payments on time.
Using our new method, each of the payment expectations can be treated as having a conditional probability of being able to pay rent on time in the subsequent month. We estimate these conditional probabilities using the subset of respondents who take the survey in the last week of one month and the first week of the following month, so we can observe both the reported expectations for future rent payments and actual payments for the same people. Using the data from the last week of May and the first week of June, we determine that about 30 percent of people who are "not confident" that they will make their next month's housing payment on time will subsequently report making that payment on time. The likelihood of paying on time then increases with confidence. Over 98 percent of those who have high confidence later report making their housing payment on time. When using these actual conditional probabilities from historical data, we can more closely estimate the actual reported payment rates in subsequent months than is possible when using binary methods.
Data and Methods
We use data from the Census Household Pulse Survey, which is an experimental data product produced by the U.S. Census Bureau since the beginning of May 2020. The survey includes approximately 100,000 respondents each week. Once restricting the sample to those who either rent their home or own their home with a mortgage, the survey includes approximately 40,000 homeowners each week and 20,000 renters.
To use the confidence responses in the Census Pulse surveys to estimate future payments, we propose an approach that uses historical data on actual payment rates by reported confidence levels. To formalize these ideas, we write down a general forecasting equation for next month's payment rates for month $$t$$ and confidence level $$c$$:
$$ (1) \ \ \ \ \begin{array} \widehat{{payrate}_{t+1}} &=& \sum_{c \in \{no,slight,mod,high\}}\ \text{Pr}(\widehat{{pay}_{t+1} | {conf}_t} = c) * {share}_{c,t} ) \\\ &=& \text{Pr}(\widehat{{pay}_{t+1} | {conf}_t} = no) *{share}_{no,t} + \text{Pr}(\widehat{{pay}_{t+1} | {conf}_t} = {slight} ) *{share}_{slight,t} \\\ &+& \text{Pr}(\widehat{{pay}_{t+1} | {conf}_t} = mod ) *{share}_{mod,t} + \text{Pr}(\widehat{{pay}_{t+1} | {conf}_t} = {high} ) *{share}_{high,t} \end{array} $$
The forecasted payment rate for next month, $$\widehat{{payrate}_{t+1}}$$, is a function of the share of households in each confidence group this month multiplied by the forecasted payment probabilities for next month conditional on payment confidence. As an example, imagine forecasting the payment rates at the end of June for the upcoming month of July. Throughout June, respondents reported their confidence for paying their upcoming July rent or mortgage. We can then calculate $${share}_{c,t}$$, the share of households in June with each confidence level (no, slight, moderate, or high confidence) about their July payment. This share with each confidence level is known when making these forecasts. However, until payments are made we do not yet know the actual conditional payment probabilities. Therefore, we must use a forecast of these conditional payment probabilities $$\text{Pr}(\widehat{{pay}_{t+1} | {conf}_t})$$.
We compare two ways to calculate $$\text{Pr}(\widehat{{pay}_{t+1} | {conf}_t})$$, the forecasted probabilities of paying next month based on payment expectations in the current month: the binary probability model and the historical probability model. The accuracy of each model's estimated on-time payment rates relies on the accuracy of the payment rates assumed in the model.
The binary model, which is implied by the typical grouping of confidence responses, assumes all households with at least moderate confidence the previous month will pay this month, and all others will not. In equations (2) and (3), the binary model sets the forecasted probability of payment to zero for all households with no and low confidence and to one for all households with moderate or high confidence. Plugging (2) and (3) into (1), the population-wide expected payment rate simplifies to just third and fourth terms, as the first two become zero.
Binary Probability Model
$$ (2) \ \ \ \ \text{Pr}(\widehat{{pay}_{t+1} | {conf}_t} = no) = \text{Pr}(\widehat{{pay}_{t+1} | {conf}_t} = slight) = 0 $$
$$ (3) \ \ \ \ \text{Pr}(\widehat{{pay}_{t+1} | {conf}_t} = mod) = \text{Pr}(\widehat{{pay}_{t+1} | {conf}_t} = high) = 1 $$
The historical probability model instead assumes that the future payment probabilities are equal to the past payment rates conditional on expected confidence level $$c$$, as shown in equation (4). Hence, it assumes the relationship between payment confidence and actual payments are constant over time – although both confidence levels and actual payment rates can vary. To determine the historical conditional payment probabilities, we use the fact that a subset of respondents to the Census pulse survey take the survey in multiple consecutive weeks. For example, about 23 percent of renters and owners with a mortgage (around 15,000 people) who took the survey in the last week of May also took the survey in the first week of June.3 Hence, for these respondents who take the survey in the last week of one month and the first week of the following month, we can observe their actual conditional probabilities of payment. Specifically, we derive the conditional probabilities based on respondents who report their confidence about next month's housing payment in the last week of May and their actual payment the following week in the first week of June. We can then use historical information from this small subsample to calculate these forecasted probabilities in future months.4
Historical Probability Model
$$ (4) \ \ \ \ \text{Pr}(\widehat{{pay}_{t+1} | {conf}_t} = c) = \text{Pr}(\widehat{{pay}_{t} | {conf}_{t-1}} = c) $$
An important assumption with this approach is the month that respondents are referring to when responding to the question. In the survey, respondents are asked about their next rent or mortgage payment in the confidence question, and about last month's rent or mortgage payment when reporting on actual payments. Yet, the question wording does not include calendar months so we cannot observe with certainty the month that respondents are referring to. We therefore assume that all payments are due on the first of the month and that respondents are answering the confidence question for the payment due on the first of the next calendar month and that the previous payment due date is referring to payments that were due on the first of the current month.5 We acknowledge, however, that some respondents may have other due dates, or may consider the due date to be the date that late fees start accruing.6 To the extent that respondents are not answering for the months we expect, it will add error in our estimates since the expected and actual payments will be for different periods.
Estimating July payment rates: Binary and Historical Probability Models
We now test which model, the binary model or the historical probability model, is better able to predict actual payment rates in July. We find that the historical probability model is better at predicting payment rates than the binary model, particularly for renters.
Calculating the Components of the Forecasting Models
In Table 1, we first calculate the forecasted payment probabilities for July based on payment confidence as of June, $$\text{Pr}(\widehat{{pay}_{t+1} | {conf}_t} = c)$$, for each model. For the binary model, this calculation is simple and shown in the right most column of Table 2. For all households, renters and owners with no and slight confidence of making July rent as of June, the forecasted payment probability is zero. For households with moderate and high confidence, the forecasted payment probability is one. For the historical probability model, we use historical data from May and June to forecast payment probabilities for paying July rent as of June. To do so, we calculate actual payment rates in June for each confidence level reported in May. We observe these actual payment rates using the repeat sample of approximately 15,000 respondents who completed the survey both the last week in May and the first week in June. The first three columns show these historical payment probabilities using the May/June repeat sample for renters, owners, and all households combined.
Table 1: Estimated Payment Probabilities for July by Payment Expectations in June, Historical and Binary Models
Forecasted Conditional Payment Probability (Percent)
| Historical Probability Model (May/June data) | Binary Model | |||
|---|---|---|---|---|
| Renters | Owners | Combined | ||
| No confidence | 35.8 | 24.6 | 31.9 | 0 |
| Slight confidence | 70.8 | 69.2 | 70.1 | 0 |
| Moderate confidence | 86.0 | 85.6 | 85.8 | 100 |
| High Confidence | 98.1 | 98.7 | 98.5 | 100 |
| Payment will be deferred | 63.2 | 33.0 | 37.7 | 0 |
Note: Among respondents who were part of the repeat sample in week 5 (May 28 to June 2) and week 6 (June 4 to June 9) of the survey. Owners restricted to those who own their home with a mortgage. Deferrals and those expecting to have their payment deferred are included with payments not made on time. Excludes respondents who did not respond to the housing payment questions. N=4,469 renters, 9,141 owners.
Source: Author's calculations using Census Bureau Household Pulse Survey data from May 28 to June 2 and from June 4 to June 9.
Comparing the forecasted conditional payment probabilities reveals the differences between the two models. In the first two rows, the binary model predicts that no households who reported no or slight confidence in making their July rent payment as of June will end up making their payment. However, we know from historical data from the May/June repeat sample that thirty-six percent of renters with no confidence that they will make their rental payment on time will subsequently make a timely payment. Similarly, one-quarter of homeowners with no confidence made their next payment on time (although few owners expressed this little confidence). Among those with slight confidence, about 70 percent of owners and renters made their payments on time. Conversely, the binary approach overestimates payments among those with moderate confidence. Among this group, 86 percent of people paid on time in June - although the binary approach assumes that all individuals with moderate confidence do so. It is only among the high confidence group that the binary approach accurately reflects actual payment rates.
We now calculate $${share}_{c,t}$$, the proportions of households in each payment confidence group in June, which are the same for both models. Table 2 shows these shares. Sixty-eight percent of renters in this group, and 84 percent of homeowners, said that they were at least moderately confident that they would make their next payment on time (the sum of row three and row four for renters and homeowners respectively). The lower payment confidence rates among renters is consistent with results from the Survey of Household Economics and Decision making that renters typically have lower incomes, have less emergency savings, and have less access to credit than owners.
Forecasters can choose how and when they use the current month data to calculate $${share}_{c,t}$$. We use data from the entire month of June to increase our sample size. However, a forecaster who wants a forecast as early as possible may choose to calculate $${share}_{c,t}$$ after the first week in June. The forecast may change if $${share}_{c,t}$$ changes throughout the month. A forecaster who wants a more accurate, but more delayed forecast, may choose to wait until later in the month to calculate $${share}_{c,t}$$. In the next section, we find that calculating the July payment rates using the last week of June data is slightly more accurate than using the whole month.
Table 2: Shares Confident that July rent payment will be made on time (by tenure)
| Renters | Owners | Combined | |
|---|---|---|---|
| No confidence | 11.8 | 4.5 | 7.5 |
| Slight confidence | 18.8 | 9.1 | 13.1 |
| Moderate confidence | 25.2 | 20.3 | 22.3 |
| High Confidence | 43.2 | 64.0 | 55.5 |
| Payment will be deferred | 1.0 | 2.3 | 1.7 |
Note: Among respondents who were part of the repeat sample in week 6 through 9 (June 4 to June 30) of the survey. Owners restricted to those who own their home with a mortgage. Excludes respondents who did not respond to the housing payment questions. N=81,427 renters, 163,298 owners.
Source: Author's calculations using Census Bureau Household Pulse Survey data from June 4 to June 30.
Forecasting the Payment Rates and Comparing Accuracy of Binary and Historical Probability Models
We now calculate the forecasted payment rates $$ \widehat{{payrate}_{t+1}} $$ for July for each model using the calculations of $$\text{Pr}(\widehat{{pay}_{t+1} | {conf}_t} = c) $$ from Table 1 and $${share}_{c,t}$$ from Table 2. For the historical probability model, because the forecasted conditional probabilities in Table 2 are generally similar for renters and owners (with the exception of those who report no confidence or expect a payment deferral), we use the combined conditional probabilities for the purpose of these estimates. Table 3 provides this comparison for the national-level results.
Table 3: Predicted and actual housing payment rates in July
| Renters | Owners | Combined | |
|---|---|---|---|
| Estimation Approach | |||
| Binary Probability Model | 68.4 | 84.2 | 77.8 |
| Historical Probability Model | 81.5 | 89.0 | 86.0 |
| Actual | 79.8 | 86.9 | 84.0 |
Note: Forecasted results are based on all responses in June. Actual results from responses in the first three week in July. Deferrals and those expecting to have their payment deferred are included with payments not made on time. Excludes respondents who did not respond to the housing payment questions.
Source: Author's calculations using Census Bureau Household Pulse Survey data from June 4 to July 21.
The historical probability model performs much better than the binary model for renters. The binary model, which assumes that only moderately and highly confident respondents pay on time, predicts that 68 percent of renters will pay on time, compared to 80 percent who actually did so. Using the historical probability model, we estimate a much closer 82 percent of renters pay on time.
The slight overestimate of confidence in the historical probability appears to result at least partially from deteriorating confidence over the course of June. 7 We calculate $${share}_{c,t}$$ using the full month of June to maximize our sample size. However, if people fall in to the lower confidence groups as the month progresses, the model will tend to overestimate the aggregate payment rates. Using only the reported confidence levels from the last week of the month, rather than the full month of June, the forecasted on-time payment rate is 80 percent – within 1 percentage point of the actual result.8
Among homeowners, the benefits of the historical probability are less clear. This is because almost two-thirds of homeowners report that they are highly confident that they will pay on time – and nearly all in that group actually do so. Consequently, there is less ability to improve upon the binary model. While the binary approach underestimates the share of owners who will pay on time, the historical approach slightly overestimates the share who will do so. However, the historical probability will still better reflect which homeowners are paying, rather than systematically overestimating payment rates among those who are moderately confident and underestimating payment rates among those with less confidence.
To further demonstrate the potential benefits from thinking about these responses probabilistically, we also constructed state-by-state projected on-time payment rates under each approach and compared these results to actual payment rates. Panel A of Figure 1 does so using the binary approach, whereas panel B does so using the historical estimates. The X-axis shows the forecasted payment rate using each approach in each state, while the Y-axis shows the actual payment rates. The closer an estimate is to the 45-degree line, the more accurate the prediction is for that state.
Figure 1. State-level forecasted and actual on-time payment rates in July using the binary approach and the historical approach, by housing tenure
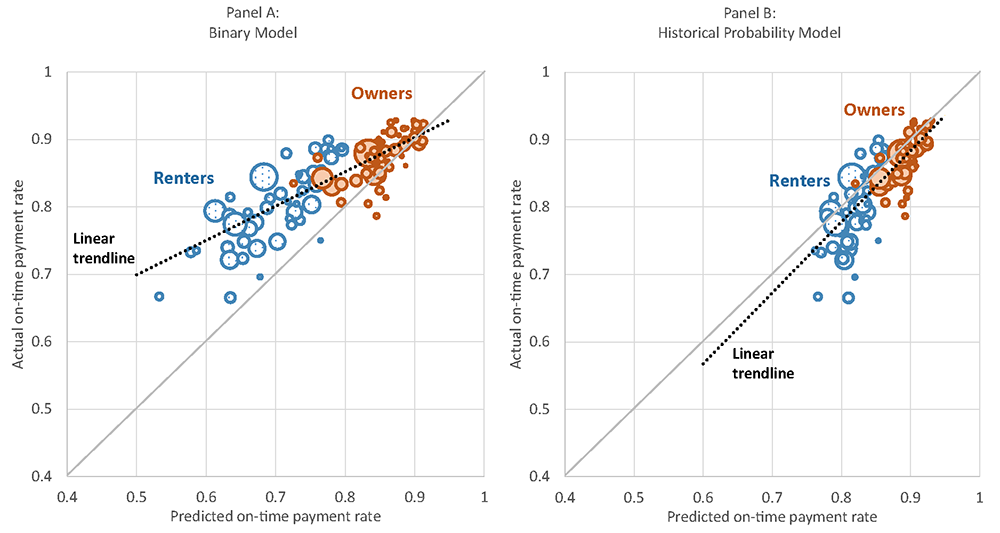
Notes: Forecasted results are based on all responses in June. Actual results from responses in the first three week in July. Bubble size represents the number of owners or renters in the state. Linear trend lines are weighted by the number of renters and owners with a mortgage in each state. The binary approach assumes that those who have moderate or high confidence that they will pay on time do so, whereas those who have no or slight confidence that they will pay on time to do not. The historical approach is based on the implied probabilities from late May. Deferrals and those expecting to have their payment deferred are included with payments not made on time.
Source: Author's calculations using the June and July Census Bureau's Household Pulse Survey.
Using the binary approach, nearly all states fall to the left of the 45-degree line, indicating that the forecasted payment rate is below the actual payment rate. This is particularly true among renter households. The weighted average difference between the actual and forecasted payment rates is approximately 8 percentage points.
Using a historical approach, the forecasted on-time payment rates slightly overstate the actual payment rates – matching that seen in the national estimates above. But the forecasted on-time payment rates for each state are typically far closer to the actual payment rates. Using this approach, the weighted average difference between the actual and forecasted payment rate is less than half the size – approximately 3 percentage points.
In addition to forecasting payment rates by housing tenure, one may also be interested in forecasting the payment rates for specific demographic and socioeconomic groups. Table 4 shows the actual and forecasted housing payment rates for July by income, race, ethnicity, and education. With the exception of those with household incomes over $100,000, for whom both the binary and historical probability models are quite accurate, the historical probability model is closer to the actual payment rates than the binary model for each group. However, while the historical probability model slightly overestimated payment rates overall, it did so more among Black adults in July. We cannot determine from the available data whether the relationship between payment confidence and actual payment rates is systematically different among Black respondents, although this is an area worthy of future exploration with additional months of data. If there are any systematic differences, we could further improve the model in the future by producing historical probabilities separately for demographic groups.
Table 4: Forecasted and actual housing payment rates in July by demographic and socioeconomic group
| Estimation Approach | Actual | ||
|---|---|---|---|
| Binary Model | Historical Probability Model | ||
| Household income | |||
| Less than $50,000 | 64.7 | 79.5 | 76.8 |
| $50,000–$100,000 | 81.8 | 87.8 | 86.1 |
| Over $100,000 | 93.8 | 94.1 | 93.7 |
| Race/ethnicity | |||
| White | 85.6 | 89.7 | 88.6 |
| Black | 63.6 | 79.2 | 72.5 |
| Hispanic | 61.8 | 78.6 | 77 |
| Other | 75.2 | 84.5 | 83.3 |
| Education | |||
| HS Degree or less | 53.5 | 74.3 | 73.7 |
| Some college or associate degree | 74.6 | 84.3 | 81.1 |
| Bachelor's degree or more | 90.1 | 92.2 | 92.2 |
Note: Forecasted results are based on all responses in June. Actual results from responses in the first three week in July. Deferrals and those expecting to have their payment deferred are included with payments not made on time. Excludes respondents who did not respond to the housing payment questions.
Source: Author's calculations using Census Bureau Household Pulse Survey data from June 4 to July 21.
Conclusion
The Census Household Pulse Survey is an important asset for understanding how households are faring during the pandemic. Additionally, there is the potential for substantial value in forward-looking questions on surveys that ask about the perceived financial risks. This note attempts to enhance the utility of these questions by providing insights into the underlying payment probabilities associated with forward-looking responses in the data.
When doing so, we estimate that approximately 30 percent of families with no confidence in their ability to make their housing payment on time will subsequently do so in the following month, as will 70 percent of those with slight confidence. This is not an indication that these families are not facing financial distress. For a family that typically pays their rent on time, a less than 50-50 chance of paying rent on time is consistent with saying that they are not confident in their ability to do so this month. Yet at least some of these families will make their payment on time and will show up in other data-sources as having done so. Consequently, using these implied probabilities can allow researchers and policymakers to better align results with those from other data sources and better estimate the likelihood that renters and homeowners are able to make their future housing payments on time.
References
Board of Governors of the Federal Reserve System. 2020. Report on the Economic Well-Being of U.S. Households in 2019, Featuring Supplemental Data from April 2020.
Callen, Jane. 2020. Weekly Census Bureau Survey Provides Timely Info on Households During COVID-19 Pandemic.
Green, Solomon and Alanna McCargo. 2020. New Data Suggest COVID-19 is Widening Housing Disparities by Race and Income.
1. Starting in August, the survey changed to a biweekly release with a 2-week field period. Return to text
2. The survey asks about the timing of payment, although not the amount. Consequently, some respondents may be reporting on-time payments even if only making a partial payment. For the full Census Pulse Survey Questionnaire, see https://www2.census.gov/programs-surveys/demo/technical-documentation/hhp/2020_COVID-19_Household_Pulse_Survey-Week-of-6_11_2020_English.pdf. Return to text
3. Reported payment rates are similar for repeat respondents to that for the full sample. Eighty-nine percent of homeowners and 82 percent of renters in the repeat sample from the first week of June reported on-time payments, compared to 88 percent of homeowners and 81 percent of renters in the full sample in that week. Return to text
4. For the repeat sample, only respondents who own with a mortgage or rent are asked about the last month rental payment. We therefore exclude those respondents who indicated one of these tenure statuses in May, but do not report their tenure status in June or report that they do not have a mortgage or live in a house without paying rent. Return to text
5. Because the Census Household Pulse Survey waves are conducted each week from Thursday until Tuesday, they also do not completely align with calendar months. For the survey wave of May 28 - June 2, we assume that respondents answering on June 1 and 2 are answering for May and June instead of June and July. Return to text
6. For example, some landlords do not charge late fees unless rent arrives after the 5th of the month and some mortgage servicers do not charge late fees unless the mortgage payment arrives after the 15th of the month. Return to text
7. Discrepancies between the historical probability model's forecasted payment rate and the actual payment rate can also come from differences in the historical conditional payment probability, which the forecaster can estimate using the smaller repeat sample, and the actual conditional payment probability, which is unobservable to the forecaster. While after the fact, we can compare the repeat sample conditional payment probabilities used in the model from May and June with the repeat sample from June and July, the differences between the two are very small. Note that since the repeat sample is much smaller than the full sample, we cannot construct the actual payment rates for the full sample using the conditional probabilities from the June and July repeat sample. Return to text
8. The decline in confidence would also reduce expected payments using the binary approach. Consequently, if just using the final week of data the binary approach would expect an even lower 67 percent of renters to pay on time. Return to text
Larrimore, Jeff, and Erin Troland (2020). "Improving Housing Payment Projections during the COVID-19 Pandemic," FEDS Notes. Washington: Board of Governors of the Federal Reserve System, October 20, 2020, https://doi.org/10.17016/2380-7172.2772.
Disclaimer: FEDS Notes are articles in which Board staff offer their own views and present analysis on a range of topics in economics and finance. These articles are shorter and less technically oriented than FEDS Working Papers and IFDP papers.