FEDS Notes
December 28, 2020
Information and Liquidity in the Market for Foreign Currency Denominated Sovereign Bonds
This note finds a negative, non-linear relationship between bond yield and liquidity using data on Portuguese, Irish, Italian, Greek, and Spanish (PIIGS) sovereign bonds from 2010-2015. This relationship is predicted by the asymmetric information model of bond liquidity by Holmstrom (2015) and Gorton (2017). Yields are negatively linked to liquidity through the generation of private information about a bond's backing, and associated adverse selection issues. As a bond becomes more likely to default, its yield rises along with the value of private information, and liquidity falls as traders worry about adverse selection.
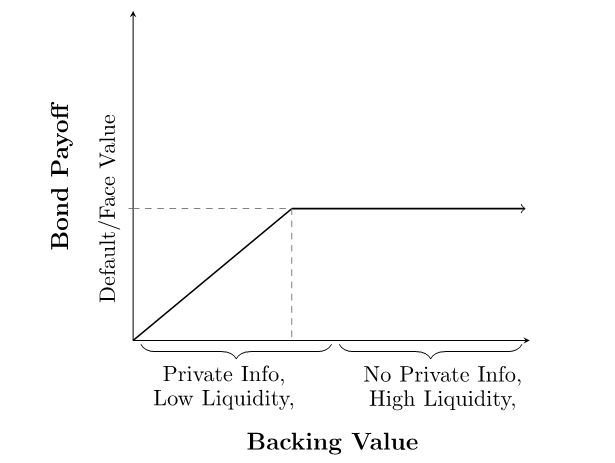
Figure 1 illustrates the payoff structure of a bond, and the model's predictions. If beliefs about the value the bond's backing are high enough, additional information is unlikely to move beliefs near the default boundary, and the bond's payoff will be constant. The value of private information will be low, and bonds will trade with high liquidity in a money-like fashion. Near the default boundary, additional information about the bond's backing will affect the bond's payoff. The value of private information will be high, leading traders to develop it. With private information, liquidity is low and bond trades are limited due to adverse selection: traders fear their trading partner knows more about the bond's value than they do.
I examine PIIGS debt from 2010-2015 because it is sovereign debt issued in a currency that the sovereign doesn't control during a particularly turbulent period. Between 2010 and 2015, the safety of PIIGS debt transforms from resembling German debt to each country following its own idiosyncratic path. Private information about Euro-area fiscal budgets is plausible as these budgets have been shown, as in Greece, to be difficult to interpret. Because none of the sovereigns examined can print Euros to repay their debt, the debt resembles corporate debt where a company must choose between repayment or default on its debt.
For the analysis, I follow the outline of Benmelech and Bergman (2017, 2017) who analyze the implications of the model in the context of corporate debt. I first run simple regressions showing the hypothesized negative, non-linear relationship between bond yield and liquidity, and private information and liquidity. Then I use CDS and equity measures as instrumental variables for yield to allay endogeneity concerns and reconfirm the relationship.
Analysis
I construct data on yields and liquidity. I use daily data from Bloomberg on generic 10-year government bonds from PIIGS countries over the period 2000-2015 in panel regressions with country and year-month fixed effects. I measure liquidity using the bid-ask spread in yield terms
$$$$ \text{Bid-Ask Spread} = \frac{{Ask}_t - {Bid}_t}{{Ask}_t} $$$$
Thus a higher bid-ask spread corresponds to lower liquidity, and a lower bid-ask spread corresponds to higher liquidity. I use the level of rates to calculate the bid-ask spread directly for simplicity despite stationarity concerns.
I first check that the hypothesized link between yields and liquidity exists. Column 1 of Table 1 shows the result of a simple regression of yield on the measure of liquidity. Liquidity falls as yields rise, as the model would predict. A higher yield indicates that default is more likely, hence the value of private information is high. With private information, bond trades are limited due to adverse selection: bond holders fear their trading partner knows more than they do and is taking advantage of them.
Table 1: Relationships with Liquidity
| Bid-Ask Spread | |||
|---|---|---|---|
| 1 | 2 | 3 | |
| Yield | 0.340*** | ||
| (0.002) | |||
| Yeld Q2 | 0.534*** | ||
| (0.032) | |||
| Yield Q3 | 0.682*** | ||
| (0.034) | |||
| Yield Q4 | 0.917*** | ||
| (0.034) | |||
| Yield Q5 | 1.728*** | ||
| (0.039) | |||
| Rating Difference Q2 | -0.039** | ||
| (0.017) | |||
| Rating Difference Q3 | 0.472*** | ||
| (0.028) | |||
| Rating Difference Q4 | 0.699 | ||
| (0.036) | |||
| Observations | 20,870 | 20,870 | 20,870 |
| Adjusted R2 | 0.768 | 0.572 | 0.542 |
| F Statistic | 360.214*** (df = 192; 20673) | 143.760*** (df = 195; 20670) | 130.152*** (df = 194; 20671) |
Specific to the model is a prediction that this fall in liquidity will be non-linear. The shape of the bond payoff curve means higher yields, indicating higher likelihood of default, should result in even lower liquidity as more information is in the market and adverse selection is higher. In order to capture this effect, Column 2 of Table 1 shows the effect of splitting yields into quintiles and re-running the regression of yield on liquidity. The results follow the model: higher yields have an increasingly larger effect on liquidity. The non-linear effect illustrates the boundary between regions.
The model predicts that information will enter the market when yields are high, and that more information will inevitably lead to heterogenous beliefs and disagreement about the proper price, depressing liquidity. In order to test this prediction, I look to see whether disagreement about the default probability of bonds leads to lower liquidity. I collect the Moody's and S&P ratings of the government bonds, then construct a measure of the rating difference between Moody's and S&P by calculating the number of bond rating notches between the two ratings
$$$$ \text{Rating Difference}_t = \lvert \text{Moody's Rating}_t - \text{S&P Rating}_t \ \rvert $$$$
Using this rating difference measure as a proxy for disagreement about the default probability, I split the rating difference into quantiles and regress them on the liquidity measure (excluding the no-disagreement quantile). Column 3 of Table 1 confirms that more disagreement leads non-linearly to lower liquidity as the model predicts.
Causality
The regression results reported in Table 1 are statistically significant, but don't suffice to establish causality. The model predicts that a high yield causes illiquidity. It's possible that the causation runs the other way, illiquidity causes a high yield. For example, investors may fear they won't be able to sell in the future, hence illiquidity goes up today along with yields.
In order to establish causality, I use two different instrumental variables for yields. First, I use the price of a credit default swap (CDS spread) from WRDS for each country. The CDS spread prices the risk of default directly. This instrument is obviously related to the yield of that country's bonds, while there is no reason to believe it would be linked directly to the liquidity of those bonds. Second, I use the log level of the main equity index in each country. Equity indices fall as a country nears default and yields rise, while there's no reason to believe it should be linked to the liquidity of the government's bond's directly.
Column 1 of Table 2 shows that the CDS spread for each country is strongly correlated with the yield on that country's bonds. The positive coefficient shows that the CDS spread is connected to a higher yield. Column 2 of Table 2 shows that the log of the equity index for each country is related to the yield. The negative coefficient shows that a higher equity index is connected to a lower yield.
Table 2: First Stage Instrumental Variables for Yields
| Yield | ||
|---|---|---|
| 1 | 2 | |
| CDS Spread | 30.883*** | |
| (0.153) | ||
| Log Equity Index | -1.522 | |
| (0.054) | ||
| Observations | 17,601 | 19,565 |
| Adjusted R2 | 0.849 | 0.577 |
| F Statistic | 590.540*** (df = 168; 17428) | 149.060*** (df = 180; 19380) |
Table 3 shows that the results in Table 1 hold when using either instrumental variable. Higher yields cause lower liquidity.
Table 3: Instrumental Variable for Yields
| Bid-Ask Spread | ||
|---|---|---|
| 1 | 2 | |
| Yield | 0.455*** | 0.257*** |
| (0.003) | (0.004) | |
| Instrument | CDS Spread | Log Equity Index |
| Observations | 17,601 | 19,565 |
| Adjusted R2 | 0.821 | 0.755 |
| F Statistic | 480.114*** (df = 168; 17428) | 329.961*** (df = 180; 19380) |
References
Benmelech, Efraim and Nittai K Bergman, "Credit Market Freezes," Working Paper 23512, National Bureau of Economic Research June 2017.
Benmelech, Efraim and Nittai K Bergman, "Debt, Information, and Illiquidity," mimeo, 2017.
Gorton, Gary, "The History and Economics of Safe Assets," Annual Review of Economics, 2017, 9 (1), 547–586.
Holmstrom, Bengt, "Understanding the Role of Debt in the Financial Sys em," BIS Working Papers, Jan. 2015, (479).
Miller, David S. (2020). "Information and Liquidity in the Market for Foreign Currency Denominated Sovereign Bonds," FEDS Notes. Washington: Board of Governors of the Federal Reserve System, December 28, 2020, https://doi.org/10.17016/2380-7172.2821.
Disclaimer: FEDS Notes are articles in which Board staff offer their own views and present analysis on a range of topics in economics and finance. These articles are shorter and less technically oriented than FEDS Working Papers and IFDP papers.