FEDS Notes
December 15, 2023
Money Market Fund Repo and the ON RRP Facility
Samuel J. Hempel, Calvin Isley, R. Jay Kahn, Patrick E. McCabe1
Between January 2021 and June 2022, money market funds' (MMFs') investments in the Federal Reserve's Overnight Reverse Repurchase (ON RRP) facility rose by $2 trillion, while their private repo lending fell by almost $500 billion. These sizable shifts give us an opportunity to examine how monetary policy implementation and the ON RRP facility interact with the private repo market. In this note, we use a new dataset linking MMFs to their repo transactions to show how the large increase in ON RRP take-up affected transactions in the private repo market between late 2019 and mid-2023.
MMFs are the largest providers of cash to the repo market and are also the largest investors in the ON RRP facility, which allows eligible counterparties to lend to the Federal Reserve overnight against Treasury collateral. The data allow us to examine individual funds' daily investments in both ON RRP and private repo markets and provide visibility into rates, counterparties, and collateral. We use these data to explore both how the option to invest in ON RRP has affected MMFs' private repo investments and how their private counterparties have responded to this shift in MMFs' repo lending.
We find that despite MMFs' increased ON RRP usage, they continued to lend in private repo markets at rates below the ON RRP rate. We also find that as MMFs' counterparties – mostly dealers – lost repo funding from MMFs, they turned to other sources of liquidity, including their affiliates, to mitigate this loss of funding. Thus, aggregate private repo volumes held steady, even as MMFs' private repo lending volume declined.
We begin by examining how the ON RRP facility has affected private MMF repo rates and quantities. The ON RRP facility allows eligible MMFs to invest in repo at a rate set by policymakers, which helps to set a floor on lending rates for MMFs. To be sure, some repo transactions still occur at rates below the ON RRP rate, and we find that the "permeability" of this floor for private repo rates varies over time and across funds. During the zero-lower-bound period between March 2020 and March 2022, private rates rarely fell below the ON RRP rate. But as monetary policy tightening commenced in March 2022, rates on private repo began to fall regularly below the ON RRP rate, and on average over all of 2022, roughly 40% of MMF private repo lending was at rates below the ON RRP rate. (That said, as MMFs shifted from private repo toward the ON RRP, private repo conducted at rates below the ON RRP rate comprised a small portion of MMFs' aggregate repo lending.) We discuss two factors that help to explain sustained demand by MMFs for sub-ON RRP investments: MMFs wish to preserve relationships with dealers, and private repo transactions offer greater intraday flexibility because they can be struck or adjusted for several hours after the ON RRP facility closes.
Next, we investigate how MMFs' private-repo counterparties have responded to MMFs' increased use of the ON RRP facility. Even though private-repo lending by MMFs initially decreased during the tightening cycle as ON RRP volumes increased, aggregate private-repo borrowing did not decline. Instead, we show that dealers increasingly sourced funding from their affiliates while private repo rates declined relative to the ON RRP rate. The sources of this affiliate repo aren't clear; they could include funds from foreign affiliates seeking to profit from cross-currency interest rate differentials, trades done on behalf of customers or as agents reinvesting cash collateral from securities lending, or other lines of business. The trades likely represent a mix of arm’s length and non-arm’s length transactions. Regardless, our work suggests that these affiliate relationships became more important amidst the decline in private lending by MMFs.
Background
The repo market allows participants to lend against collateral on a short-term basis, usually overnight. Repo transactions can be settled either bilaterally, where cash and securities are transferred directly between a cash borrower and cash lender, or on a tri-party platform where cash and securities are transferred through the Bank of New York Mellon (BNYM), which provides custody and collateral management services.2 Almost all MMF repo is either tri-party repo or bilateral centrally cleared repo conducted through the sponsored DVP service of the Fixed Income Clearing Corporation (FICC). However, in recent years FICC's sponsored GC service, a centrally cleared tri-party venue, has begun to see more volume.
Traditionally, tri-party repo has made up the lion's share of money market funds' investments in the repo market because BNYM provides collateral management services – including valuation, delivery and management of collateral – that are operationally complex and time-consuming. MMFs engage in the tri-party market with dealers both directly and through omnibus accounts that are set up at the fund-family level. Omnibus accounts allow fund families to make transactions with dealers early in the day and then later in the day decide how these repo investments will be allocated among the family's individual funds after more information about fund-level flows is available.
Sponsored repo (both through DVP and sponsored GC) recently has become an important venue for MMF transactions in large part because it provides a netting benefit to dealers. Sponsored repo allows direct-clearing ("sponsoring") members of FICC (usually large financial institutions) to intermediate bilateral repo trades with counterparties that are not direct clearing members ("sponsored members"). MMFs and hedge funds are the largest sponsored participants in this market, though mutual funds, insurance funds, and sovereign wealth funds also take part. Since FICC is the nominal counterparty for all sponsored repo, dealers can net their borrowing from one sponsored entity (say, an MMF) against their lending to another sponsored entity (say a hedge fund) for repos with the same end date, which allows the dealer to avoid expanding its balance sheet.
MMFs are also the largest investors in the Federal Reserve's ON RRP facility; these funds provided 91% of the facility's average daily volume in 2022. This facility is intended to set a floor under overnight rates by offering approved counterparties the option to invest with the Federal Reserve at a fixed rate through overnight tri-party repo collateralized by Treasuries. This option gives ON RRP counterparties leverage to demand similar or higher rates from private borrowers in the repo market, thereby supporting the Federal Reserve's target range for the federal funds rate.3 ON RRP volumes rose dramatically from $10 billion at year-end 2020 to $2.5 trillion at year-end 2022.
The effect of the ON RRP facility
We use a unique combination of confidential datasets to examine the relationship between repo volumes and MMF lending. Our data capture (at a daily frequency) almost all MMF repo transactions in the United States. The details of this data construction are contained in the Appendix.
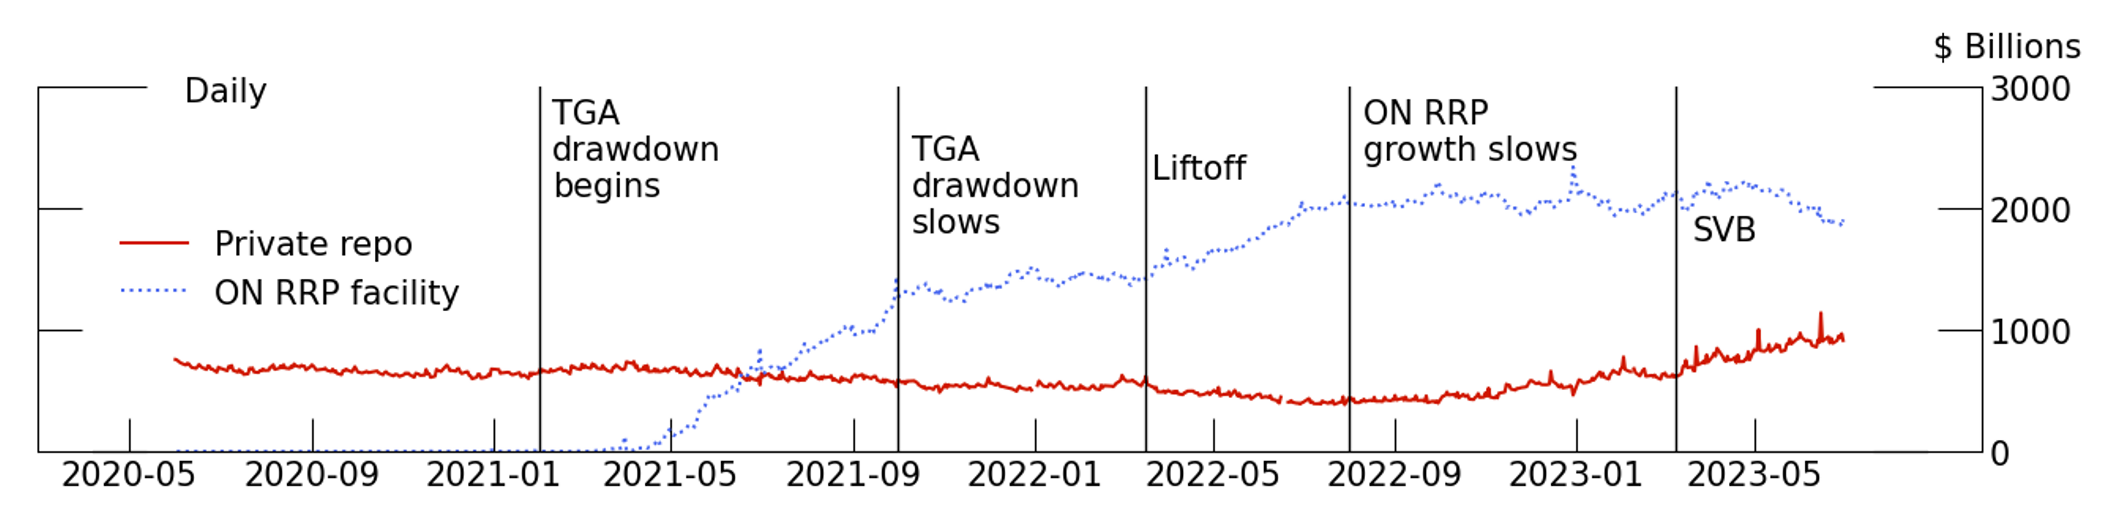
Note: Drop line dates are as follows: "TGA drawdown begins" is February 1, 2021. "TGA drawdown slows" is October 1, 2021. "Liftoff" is March 17, 2022. "ON RRP growth slows" is August 1, 2022. "SVB" is March 9, 2023.
Sources: Federal Reserve tri-party repo transaction data and the OFR cleared repo collection.
We begin by discussing recent developments in MMF lending in private repo (both tri-party and sponsored) markets and to the ON RRP facility. Since the facility is designed to provide a floor for repo rates by giving counterparties the option to invest at a fixed rate administered by the Federal Reserve, we would expect that volumes in the ON RRP facility would be higher when private repo rates are lower, and that MMFs would do little lending at rates below the facility rate.
In early 2021, ON RRP usage began to rise as a combination of sustained Federal Reserve purchases of assets, a decline in the Treasury General Account (TGA), and a corresponding decrease in Treasury bills outstanding put downward pressure on overnight interest rates.4 As shown in Table 1, between the end of January and the end of October 2021, the TGA decreased by about $1.3 trillion, while take-up at the ON RRP facility increased by roughly the same amount. The level of the ON RRP facility then increased slowly through February 2022 to about $1.4 trillion. Finally, as the Federal Reserve started increasing its target range for the federal funds rate in March 2022, ON RRP volumes began increasing more rapidly again, this time accompanied primarily by a decrease in reserves rather than in the TGA.
Table 1
| Money market fund assets | Federal Reserve liabilities | Treasury bills outstanding | |||||||
|---|---|---|---|---|---|---|---|---|---|
| Total | ON RRP | Repo | Bills | Other | TGA | Reserves | Total | ||
| Jan 21 | 4,827 | 5 | 1,000 | 2,480 | 1,342 | 1,611 | 3,154 | 7,405 | 4,955 |
| Oct 21 | 5,063 | 1,346 | 810 | 1,841 | 1,066 | 278 | 4,128 | 8,556 | 3,852 |
| Feb 22 | 5,137 | 1,446 | 842 | 1,836 | 1,013 | 771 | 3,805 | 8,928 | 4,055 |
| Aug 22 | 5,087 | 2,069 | 599 | 853 | 1,565 | 627 | 3,306 | 8,826 | 3,723 |
| ∆ MMF assets | ∆ Fed liabilities | ∆ Bills | |||||||
| Jan 21 - Oct 21 | 236 | 1,341 | -190 | -639 | -276 | -1,333 | 974 | 1,151 | -1,103 |
| Oct 21 - Feb 22 | 74 | 100 | 32 | -5 | -53 | 493 | -324 | 372 | 203 |
| Feb 22 - Aug 22 | -50 | 623 | -243 | -421 | -10 | -144 | -499 | -102 | -332 |
Note: All figures in billions of dollars as of the end of each month listed. "Repo" here refers to private repo, and thus does not include MMFs' investments in the ON RRP.
Source: SEC Form N-MFP Data, Federal Reserve H.6 Money Stock Measures, U.S. Treasury Daily Statements, U.S. Treasury Monthly Statements of the Public Debt
How did the increase in ON RRP usage affect private repo transactions by MMFs? Given the purpose of the ON RRP facility, we would expect that volumes in the facility would be higher when private repo rates are lower, and that MMFs would do little lending at rates below the facility rate. We also might expect that when facility take-up is high, private repo volumes will be lower.
Examining Table 1, we can see that as MMFs' investments in the ON RRP facility increased, their private repo holdings generally decreased, with private repo falling, on net, by about $400 billion between January 2021 and October 2022. However, these increases in ON RRP take-up were accompanied by even larger declines in MMF holdings of Treasury bills, which fell by just over $1 trillion during the same period. That is, the source of the additional investments in ON RRP was not necessarily the private repo market.
To examine how the increase in ON RRP usage affected private repo rates, we narrow our focus to MMFs' private overnight Treasury repo for a direct comparison with the ON RRP facility's offerings. Figure 2 shows trends in private repo transactions occurring above the ON RRP rate to provide some insights on the workings of the facility and its effectiveness in setting a floor on short-term interest rates.
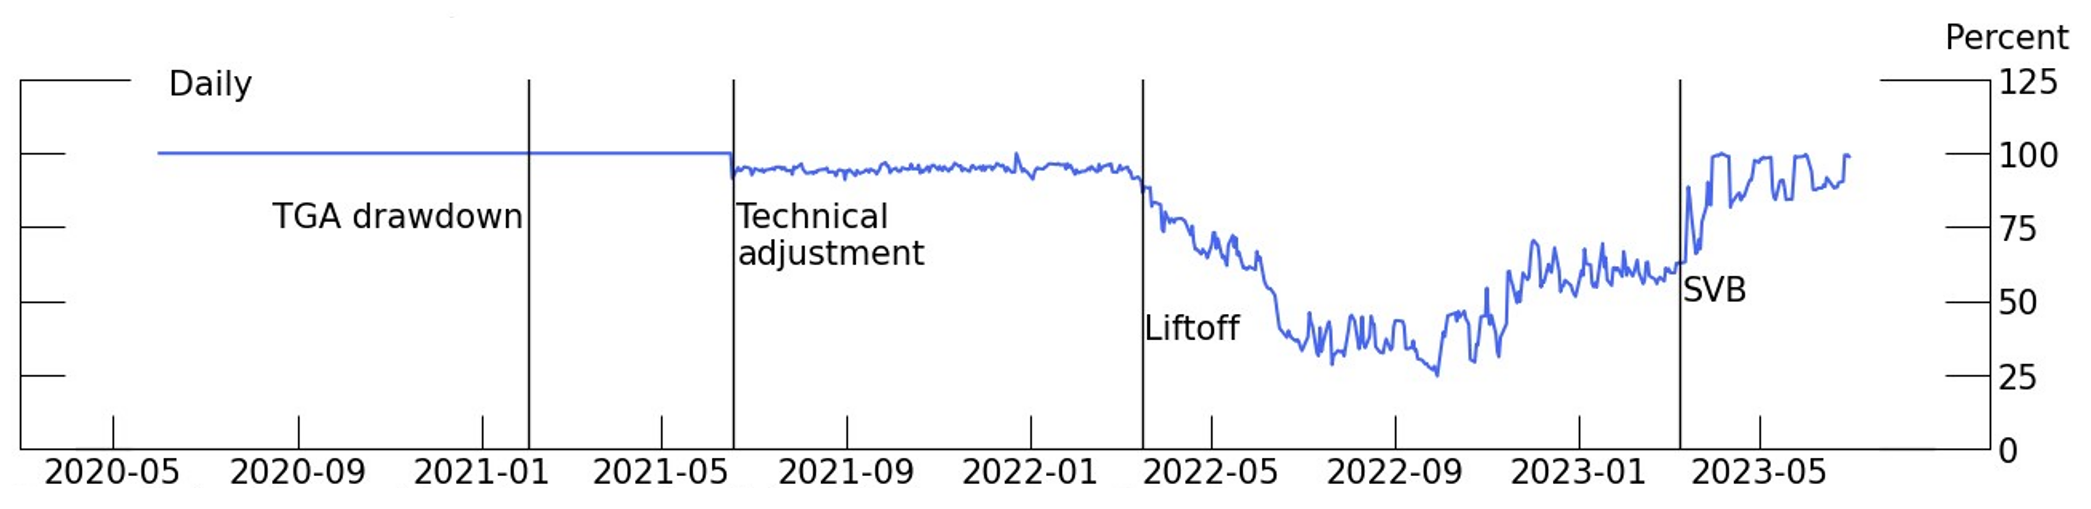
Note: Drop line dates are as follows: "TGA drawdown" is February 1, 2021. "Technical adjustment" is June 17, 2021. "Liftoff" is March 17, 2022. "SVB" is March 9, 2023.
Sources: Federal Reserve tri-party repo transaction data and the OFR cleared repo collection.
From the start of the pandemic until June 18, 2021, the ON RRP rate was zero. At the zero lower bound, MMFs are highly motivated to avoid sub-ON RRP rates, since transactions at negative rates can erode the funds' net asset values (NAVs). Therefore, during this period there was almost no repo lending by MMFs below the ON RRP rate.5 However, as the ON RRP rate moved into positive territory, more transactions occurred below the ON RRP rate. On June 17, 2021, the day of the first increase in this rate, a technical adjustment was implemented that raised the rate to 5 basis points, and MMFs' private repo transactions below the ON RRP rate went from zero to 8.5% of the total, and for several months thereafter regularly fell above 5%. Later, as the Federal Reserve embarked on a series of policy rate increases beginning March 17, 2022, the ON RRP rate rose more substantially. Between March 17 and July 29, 2022, MMFs' aggregate investments in private repo fell, but the volume of MMFs' private repo lending below the ON RRP rate increased. This pattern reversed around October 2022, and private repo volumes have been rising since, primarily driven by new transactions at rates above the ON RRP rate.
Why have some MMFs lent at rates below the ON RRP rate?
Money market funds' repo investments at rates below the ON RRP rate present something of a puzzle: if MMFs can earn the ON RRP rate, why would they ever choose to lend at lower rates elsewhere?
For some MMFs, the answer might be simple: They do not have access to the facility. However, as we show in Figure 3, lack of access to the ON RRP facility only explains part of the puzzle. We plot weighted average spreads for MMF investments in private repo relative to the ON RRP rate. Private repo rates earned by money market funds are similar for those with access to the ON RRP facility (so-called "reverse repo counterparties" or "RCPs"), those without access (non-RCPs), and omnibus accounts (largely family-level accounts that may mix RCPs and non-RCPs). While RCPs and omnibus accounts received slightly higher rates than non-RCPs over parts of the sample, average rates received by all types of MMFs fell short of the ON RRP rate, so lack of access to the facility does not appear to be driving transactions at rates below the ON RRP rate.6
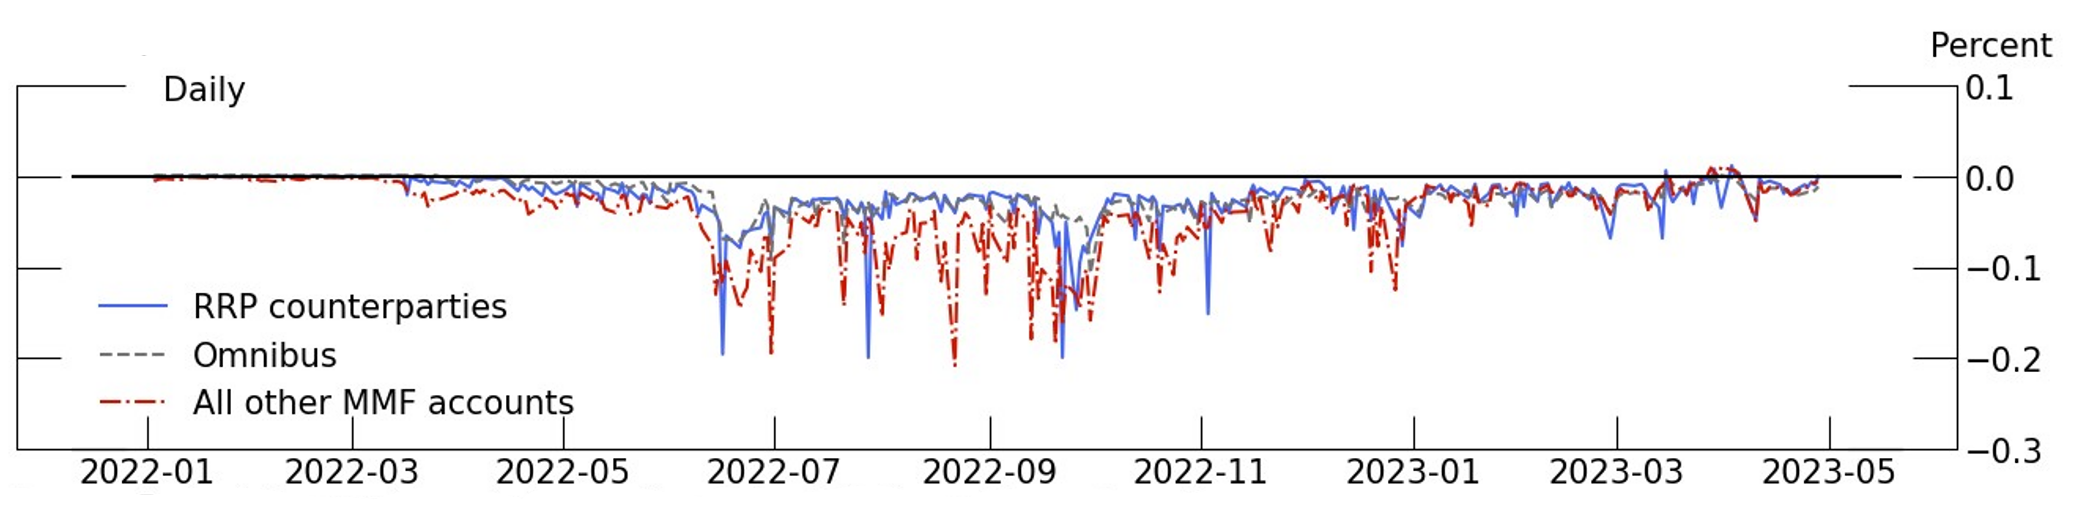
Sources: Federal Reserve tri-party repo transaction data and the OFR cleared repo collection.
Even if funds have access to the ON RRP facility, they may still choose to invest below the ON RRP rate for two important reasons. First, funds may want to maintain active relationships with dealers and may be willing to sacrifice returns to do so. Second, funds may be willing to accept lower rates on private repo because it gives them more flexibility late in the day to handle inflows and outflows from investors. The ON RRP facility is only open each day between 12:45 PM and 1:15 PM, but after that window MMFs continue to receive sales and redemptions orders that must be priced and settled on the same day. Private repo can allow greater flexibility in meeting these late-day flows. For example, funds can arrange a private repo agreement with a dealer early in the day and adjust their balances with the dealer later in the day, and funds may be willing to offer a rate lower than the ON RRP rate in exchange for this increased flexibility.
To test the relative importance of these three potential explanations for MMFs' sub-ON RRP rate repo lending (access to the ON RRP facility, desire to maintain dealer relationships, and flexibility in meeting volatile flows) we use transaction-level tri-party repo data to run regressions of the following form:
$$$$ SubONRPP\ Share_{i,j,t} = \beta_1 RCP\ Share_{i,t} + \beta_2 OB\ Share_{i,t} + \beta_3 Dealer\ Share_{i,j} + \beta_4 Flow\ Vol_{i,t} + FEs $$$$
In this setting, $$ SubONRPP\ Share_{ijt} $$ represents the share of total tri-party repo lending that is transacted below the ON RRP rate by fund family $$ i $$ to dealer $$ j $$ on date $$ t$$. We conduct this regression for data from June 17, 2021 — when funds begin to lend at sub-RRP rates — through March 2023, a period throughout which rates were near to the ON RRP floor. To examine the effect of the option to invest in the ON RRP facility, $$ RCP\ Share_{it} $$ represents the share of total assets of fund family $$ i $$ that are in RCPs on date $$ t $$. $$ OB\ Share_{it} $$ represents the share of total tri-party repo lending from fund family $$ i $$ that is conducted through omnibus accounts on date $$ t $$. To capture the effect of relationships with dealers, $$ Dealer\ Share_{ij} $$ represents dealer $$ j's $$ tri-party borrowing from fund family $$ i $$ in 2019 as a share of that family's total tri-party repo lending in 2019. These shares are based on transactions that are unrelated to ON RRP take-up in 2021 and 2022 but that still reflect the value of the dealer to the fund in normal times, since MMF-dealer relationships are long-lived (Han et al., 2022). Lastly, to capture the risk of large share purchases and redemptions, $$ Flow\ Vol_{it} $$ is the two-week rolling standard deviation of daily flows (from date $$ t-9 $$ to date $$ t $$, where $$ t $$ indexes trading days) to fund family $$ i $$, normalized by total assets and Winsorized at the 1% level. We also include dealer, lender and day fixed effects to control for other sources of variation. The results of these regressions are displayed in Table 2.
Table 2
| Share of repo transactions below RRP rate | |||
|---|---|---|---|
| June 17, 2021 – March 31, 2023 | |||
| (1) | (2) | (3) | |
| RCP Share | -0.28*** | -0.28*** | -0.40*** |
| (0.01) | (0.01) | (0.01) | |
| OB Share | -0.21*** | -0.34* | -0.64*** |
| (0.05) | (0.05) | (0.04) | |
| Dealer Share | -0.43*** | 0.14*** | 0.08*** |
| (0.02) | (0.02) | (0.02) | |
| Flow Vol | 2.96*** | 2.41*** | 2.12*** |
| (0.08) | (0.08) | (0.07) | |
| Observations | 90,256 | 90,255 | 89,895 |
| Fixed effects: | |||
| Date | Yes | Yes | |
| Family | Yes | Yes | Yes |
| Dealer | Yes | ||
| Dealer x Date | Yes | ||
| R-squared | 0.52 | 0.62 | 0.74 |
Source: Federal Reserve tri-party transaction data
The regressions results show three key points:
- Having MMFs that are ON RRP counterparties boosts the private repo rates that a fund family receives. After controlling for fixed effects, our results suggest a one standard deviation increase in RCP share leads to a 2.5% or greater decrease in the share of repo occurring below the ON RRP rate. Meanwhile, a one standard deviation increase in the share of omnibus accounts leads to an 0.6% decrease in the share of repo below the ON RRP rate.7
- More valuable fund-dealer relationships, as measured by dealer share – the relative importance of a fund's lending to a dealer in 2019 – leads to more lending at sub-ON RRP rates, so long as dealer-specific effects are controlled for as in our second and third specifications. In these two specifications, a one standard deviation increase in a fund's share in total dealer repo leads to a roughly 0.3% increase in repo occurring below the ON RRP rate.
- Concerns about managing late-day flows, as proxied by greater flow volatility, also leads to more lending at sub-ON RRP rates. A one standard deviation increase in flow volatility leads to a 0.4% increase in repo occurring below the ON RRP rate.
Taken together, these results suggest that access to the RRP facility and omnibus accounts do play an important role in providing an outside option for MMFs, while relationship lending and precautionary demand play important but somewhat lesser roles in driving demand for repo below the ON RRP rate.
Consequences for repo lending outside of MMFs
How did MMFs' shift towards the ON RRP facility affect private borrowers? In Figure 4 we examine total tri-party repo borrowing by dealers by domicile. Despite a $150 billion decrease in MMF lending in the tri-party market from January 2021 and August 2022, tri-party repo borrowing by US firms over this period increased by $47 billion and borrowing by foreign firms increased by $3 billion.
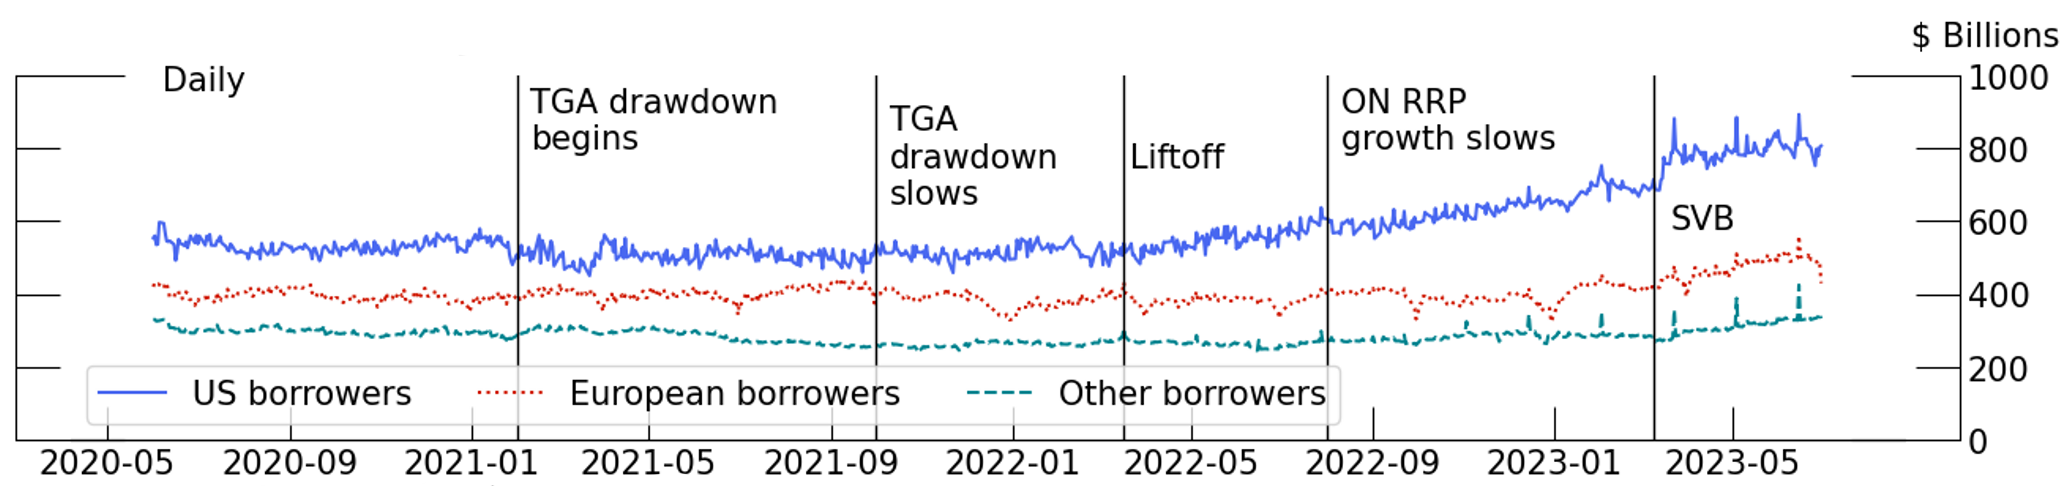
Note: Drop line dates are as follows: "TGA drawdown begins" is February 1, 2021. "TGA drawdown slows" is October 1, 2021. "Liftoff" is March 17, 2022. "ON RRP growth slows" is August 1, 2022. "SVB" is March 9, 2023.
Source: Federal Reserve tri-party repo transaction data.
Evidently, dealers were able to find alternative sources of financing, likely at lower rates than they would've had to pay to MMFs to keep them from investing in ON RRP.
Next, we show that dealers largely received this alternative financing from their own affiliates. Figure 5 breaks down all tri-party lending by the type of lender, split into four categories: MMFs, affiliates of the borrower, non-MMF asset managers (such as insurance funds, pension funds, mutual funds), and all other lenders. Between January 2021 and August 2022, when RRP growth slowed, lending by affiliates increased by $86 billion, while lending from non-MMF asset managers increased by $42 billion.
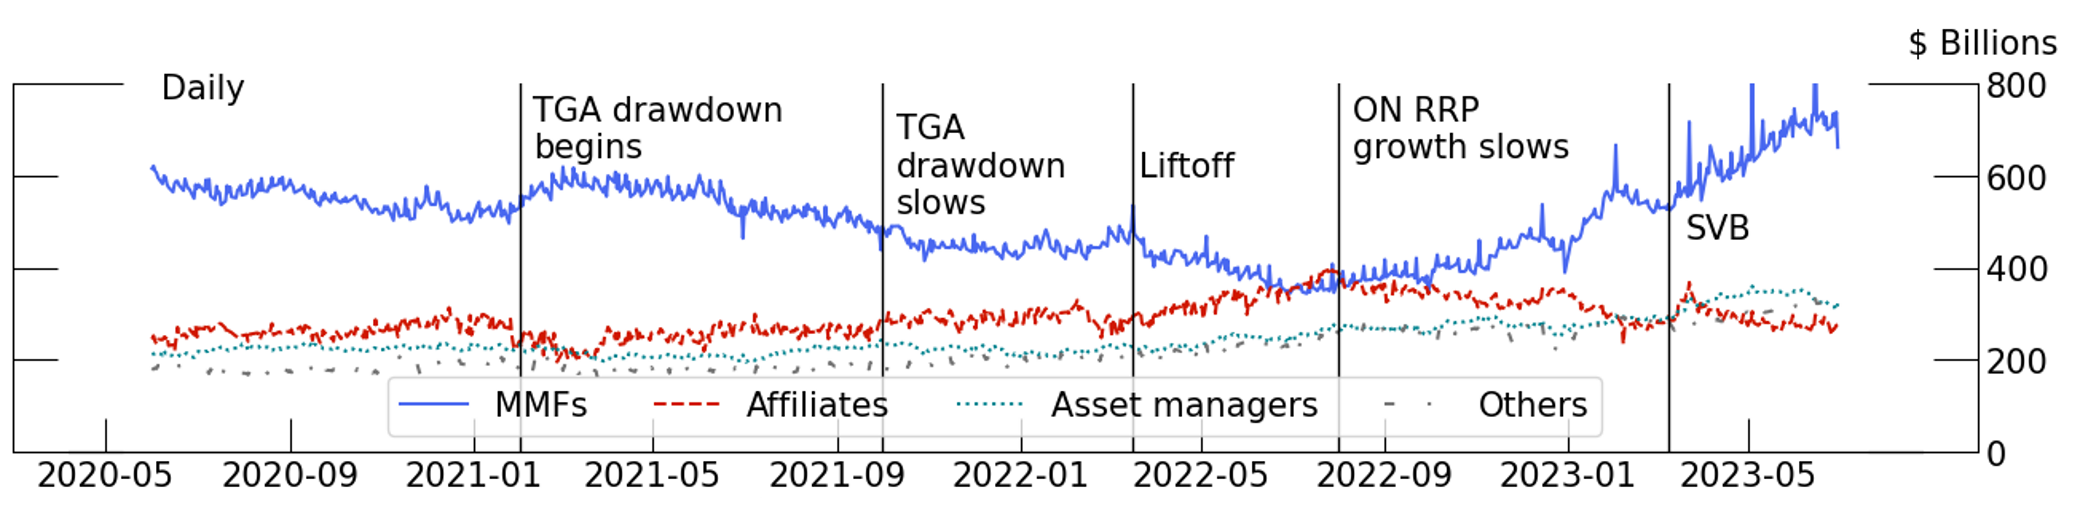
Note: Drop line dates are as follows: "TGA drawdown begins" is February 1, 2021. "TGA drawdown slows" is October 1, 2021. "Liftoff" is March 17, 2022. "ON RRP growth slows" is August 1, 2022. "SVB" is March 9, 2023.
Source: Federal Reserve tri-party repo transaction data.
What types of affiliates increased their lending to dealers? The transaction-level data offer a first pass on the answers: Table 3 breaks down the change in lending from dealers' affiliates by type and domicile. Affiliate types can include domestic banks, foreign banks, affiliated dealers, and wealth management arms. We find that dealer affiliates provided all the increase in affiliated lending, while banking affiliates reduced their lending during this period. Moreover, regardless of the domicile of the parent company, roughly 75% of the increase in affiliate lending came from affiliates domiciled overseas.
Table 3
| Total | Dealers by domicile | Lenders by type | Affiliate lenders | |||||||
|---|---|---|---|---|---|---|---|---|---|---|
| By type | By domicile | |||||||||
| US | Foreign | MMF | Affiliate | Other | Bank | Dealer | US | Foreign | ||
| Jan 21 | 1,216 | 541 | 675 | 523 | 274 | 420 | 109 | 164 | 218 | 56 |
| Aug 22 | 1,266 | 588 | 678 | 377 | 359 | 530 | 67 | 293 | 239 | 120 |
| Difference | 50 | 47 | 3 | -146 | 86 | 110 | -43 | 129 | 22 | 64 |
Note: All figures in billions of dollars as of the end of each month listed.
Source: Federal Reserve tri-party transaction data
However, this analysis cannot precisely identify the type of affiliate activities that provided the funds. This activity may represent internal liquidity management to profit from cross-border spreads available to affiliates in different jurisdictions or from different client bases domestically. Additionally, while our affiliate measure excludes customer accounts and accounts where a bank or dealer acts as an agent, the measure may inadvertently include some trades done as agent or on behalf of clients, such as reinvesting cash collateral associated with securities lending. Additionally, it is likely that some transactions are conducted at arm’s length and some are not.
Regardless, these findings point to important questions for further study. Dealers' internal liquidity management of the firm's funds would reflect a shift away from market-based financing from external sources such as MMFs. Internal liquidity management and "reserve-draining" repo activity at banks has been previously studied by Correa et al. (2022) and Caglio et al. (2021). However, while these papers document reliance on liquidity provided by banking subsidiaries, Table 3 suggests that the majority of funding to replace the decline in MMFs' repo lending from 2021 to 2022 came from dealer subsidiaries. Our results motivate further analysis of this internal liquidity management, both on the types of subsidiaries and the types of activities that provide these funds.
Conclusion
In this note we use a new mapping from MMFs to their repo accounts to discuss the effects of recent increases in take-up at the ON RRP facility, shifts in monetary policy, and changes in Treasury financing on the private repo market. We show that as take-up at the facility increased dramatically from 2021 to 2022, dealers switched from obtaining funding from MMFs to relying on funds from affiliates. We also discuss limits to the ON RRP facility's precise control over repo rates, as MMFs were willing to accept repo rates somewhat below the ON RRP rate to maintain relationships with dealers and to manage late-day flows. The ON RRP facility is likely to continue to play a crucial role in setting a floor for overnight interest rates, so understanding how the facility affects private repo activity will remain important.
References
Viktoria Baklanova, Adam Copeland and Rebecca McCaughrin, 2015. "Reference guide to U.S. repo and securities lending markets," Staff Reports 740, Federal Reserve Bank of New York.
Gara Afonso, Lorie Logan, Antoine Martin, Will Riordan and Patricia Zobel, 2022. "How the Fed's Overnight Reverse Repo Facility Works," Liberty Street Economics 20220111, Federal Reserve Bank of New York.
Cecilia R. Caglio, Adam Copeland and Antoine Martin, 2021. "The Value of Internal Sources of Funding Liquidity: U.S. Broker-Dealers and the Financial Crisis," Staff Reports 969, Federal Reserve Bank of New York.
Ricardo Correa, Wenxin Du and Gordon Y. Liao, 2020. "U.S. Banks and Global Liquidity," International Finance Discussion Papers 1289, Board of Governors of the Federal Reserve System.
Josh Frost, Lorie Logan, Antoine Martin, Patrick E. McCabe, Fabio M. Natalucci and Julie Remache, 2015. "Overnight RRP Operations as a Monetary Policy Tool: Some Design Considerations," Finance and Economics Discussion Series 2015-10, Board of Governors of the Federal Reserve System.
Song Han, Kleopatra Nikolaou and Manjola Tase, 2022. "Trading Relationships in Secured Markets: Evidence from Triparty Repos," Journal of Banking & Finance, vol. 139, issue C.
Samuel J. Hempel and R. Jay Kahn, 2021, "Negative Rates in Bilateral Repo Markets," Briefs 21-03, Office of Financial Research, US Department of the Treasury.
Samuel J. Hempel, R. Jay Kahn, Robert Mann, and Mark Paddrik, 2023, "Why Is So Much Repo Not Centrally Cleared?" Briefs 23-01, Office of Financial Research, US Department of the Treasury.
R. Jay Kahn and Luke Olson, 2021. "Who Participates in Cleared Repo?" Briefs 21-01, Office of Financial Research, US Department of the Treasury.
Lorie Logan, 2021. "Monetary Policy Implementation: Adapting to a New Environment," Remarks before the Money Marketeers of New York University, October 14, 2021.
Mark Paddrik, Carlos Ramirez and Matthew McCormick, 2021. "The Dynamics of the U.S. Overnight Triparty Repo Market," FEDS Notes. Washington: Board of Governors of the Federal Reserve System, August 02, 2021.
Appendix: Constructing a New Repo Mapping
To examine transactions in tri-party repo and cleared repo, we rely on the OFR's cleared repo collection and the Federal Reserve's collection of tri-party transaction data.
With these data, we construct a mapping from tri-party and sponsored accounts to individual MMFs. We begin by hand-matching entity names for each data set. Next, we examine the SEC's Form N-MFP data to link transactions by each account to the corresponding transaction reported by the fund in its SEC filings. We verify this link based on the rate, volume, end date, counterparty and underlying collateral of the repo. For cleared repo data, this process is straightforward since accounts correspond to legal entities and outstanding volumes are recorded in the data.
However, tri-party data are more complicated. To link MMFs and tri-party repo transactions, we estimate outstanding volumes from transactions based on the end date of the repo and its optionality. Entity names on BNYM accounts often contain acronyms or other shorthand, which impairs clean matching to the legal names contained in Form N-MFP. Moreover, matches between MMFs and repo accounts are often many-to-many. Some funds have multiple accounts representing different trading desks or accounts dedicated to different dealers. Other funds invest through omnibus accounts that invest on behalf of multiple funds. Therefore, we must iterate between names and N-MFP data to obtain stable matches.
In total, we observe 7,767 accounts in the BNYM tri-party data. Of those accounts, we identify 1,373 that conduct repo lending on behalf of MMFs. We map these 1,373 tri-party accounts to 321 MMFs (or, in the case of omnibus accounts, fund families). Additionally, of 1,948 accounts in FICC, we map 166 to unique MMFs.
Furthermore, we map non-MMF tri-party and sponsored repo accounts to lender types, which include non-MMF asset managers, banks and dealers, hedge funds and other accounts.8 We also map the tri-party lending accounts for banks and dealers to a consistent dealer identifier so that we can examine inter-affiliate trades. Finally, we merge these data with Form N-MFP data and Crane Data to obtain information about MMF attributes and assets under management.
1. Division of Research and Statistics, Board of Governors of the Federal Reserve System. The analysis and conclusions in this note are those of the authors and do not necessarily reflect the views of the Board of Governors or the Federal Reserve staff. Hempel: [email protected]; Isley: [email protected]; Kahn: [email protected]; McCabe: [email protected]. We thank Ashley Wang, Mike Koslow, and Kurt Kostyu for their comments and suggestions. Any errors are those of the authors alone. Return to text
2. For more discussion of the different features of each repo market segment, see Baklanova et al. (2015) and Hempel et al. (2023). Return to text
3. For more details on how the Fed uses the ON RRP facility to control rates, see Frost et al. (2015) and Afonso et al. (2022). Return to text
4. See Logan (2021) and Hempel and Kahn (2021). For more details on the relationship between the TGA and overnight interest rates, see Correa et al. (2020). Return to text
5. Hempel and Kahn (2021) discuss the unwillingness of MMFs to lend at negative rates during the zero lower bound period of 2021. In contrast, other repo market participants transacted more frequently at negative rates. Return to text
6. Another potential rationale for private repo transactions at rates below the ON RRP rates is the facility's daily per-counterparty cap of $160 billion. That is, if a MMF has more than $160 billion to invest, it might have no investment options other than private repo at rates below the ON RRP rate. However, the $160 billion counterparty cap does not appear to be driving low-rate repo. Over the period we examine, individual funds' ON RRP take-up was generally well below the facility cap. Return to text
7. Removing fixed effects leads to a smaller standard deviation of residuals than the unconditional standard deviation, though we believe it is more appropriate as a basis for comparison with these regressions since it reflects the margins along which variation in the regressions is exploited. The conditional (unconditional) standard deviation in our sample is 0.09 (0.44) for RCP Share, 0.03 (0.31) for OB Share, 0.07 (0.13) for Dealer Share and 0.003 (0.003) for Flow Vol. Return to text
8. For more details on the share of various lender types in tri-party and cleared repo, see Paddrik et al. (2021) and Kahn and Olson (2021). Return to text
Hempel, Samuel J., Calvin Isley, R. Jay Kahn, and Patrick E. McCabe (2023). "Money Market Fund Repo and the ON RRP Facility," FEDS Notes. Washington: Board of Governors of the Federal Reserve System, December 15, 2023, https://doi.org/10.17016/2380-7172.3412.
Disclaimer: FEDS Notes are articles in which Board staff offer their own views and present analysis on a range of topics in economics and finance. These articles are shorter and less technically oriented than FEDS Working Papers and IFDP papers.