FEDS Notes
July 31, 2020
Monitoring Risk From Collateral Runs
Sebastian Infante and Alexandros P. Vardoulakis
Executive Summary
We present an estimate of the total amount of funds primary dealers can access from the intermediation of cash and securities through secured funding transactions (SFTs). 1 We highlight how this activity can introduce an additional source of risk: the abrupt withdrawal of cash borrowers, which we call collateral runs. This fragility arises because primary dealers are able to intermediate funds through SFTs by using the same underlying collateral posted by the end cash borrower, a process known as reuse or rehypothecation. The reuse of counterparties' collateral puts cash borrowers at risk of losing it, creating incentives for them to withdraw their collateral. Using the Federal Reserve Bank of New York's (FRBNY's) primary dealer survey (FR 2004) we provide an estimate of the amount of liquidity dealers can extract through reuse across different collateral classes, which we call the relative reuse windfall (RRW). The RRW is a measure of cash borrowers' exposure to a dealer, and thus, it captures the likelihood of a collateral run.
We find that the liquidity windfall stemming from collateral reuse accounts for up to 10% of a primary dealer's total secured funding. This windfall varies across collateral classes, with Agency MBS exhibiting the largest exposure to a collateral run. However, in absolute terms, the windfall from US Treasury repo is sizable and may pose a high degree of collateral run risk. This last finding underscores that the risk of a collateral run is independent of the risk profile of the underlying collateral class.
This article highlights the importance of not only monitoring dealers' secured borrowing, but also their secured lending. It also shows that contrary to how SFTs are typically characterized, cash borrowers' risk of losing their collateral is directly proportional to the amount of overcollateralization (e.g., repo haircut) on their SFTs. These insights suggest that regulatory framework's designed to increase the resiliency of short-term funding markets must also consider possible risks posed by short-term lending. Although the RRW is merely an estimate of cash borrowers' exposure, it is a useful tool to monitor additional sources of risk primary dealers may face.
Background
The systemic impact of a large broker-dealer's default was a key lesson from the 2007-09 financial crisis. These firms are at the heart of the U.S. financial system, providing a number of services that enhance market functioning. To provide these services, dealers rely heavily on short-term SFTs, for example repurchase agreements (repo). The short-term nature of these contracts makes them a fragile source of funding. In effect, financial crises are often characterized by the loss in confidence from short-term creditors. Therefore, it is no surprise that many post-crisis regulatory initiatives have been geared towards regulating and monitoring dealers' use of short-term funding. For example, leverage regulations disincentive firms to increase the size of their balance sheet using SFTs and liquidity regulations penalize excessively short liabilities. Other proposed reforms have directly targeted these markets, like for example, a proposal on minimum haircut requirements (also known as haircut floors) for repo.2
However, recent research has identified another possible source of fragility: excessive short-term lending financed with collateral reuse.3 Dealers are active intermediaries in secured funding markets, bringing together end borrowers with initial cash lenders.4 In addition, dealers rely on SFTs to source and distribute securities for market making. Thus, the amount of funds dealers lend through SFTs (also known as incoming SFTs) which are borrowed through SFTs (also known as outgoing SFTs) is sizable.5
Consequently, different contracting terms between incoming SFTs and outgoing SFTs can be an important source of liquidity for a dealer, which can evaporate if the end borrower decides to withdraw their collateral. This type of fragility, called collateral runs, is markedly different from traditional bank runs as they are triggered by a contraction of dealers' assets.
What is a collateral run?
A collateral run is the abrupt withdrawal of securities posted to a dealer through SFTs. Cash borrowers have incentives to withdraw their securities because they risk losing them if the dealer defaults, which may be more valuable than what they owe. These incentives increase with the degree of overcollateralization in borrowers' SFTs. Infante and Vardoulakis (2020) have identified three ingredients that lead to this type of fragility. First, dealers must extend SFTs by reusing the underlying collateral. If the collateral is reused and leaves the dealer, the risk that the cash borrower may lose it in bankruptcy is higher, as the dealer would not have direct access to it. Second, dealers need some degree of market power to set different contracting terms between borrowers and lenders. Specifically, when reusing collateral dealers may lend less than what they borrow which in the context of repo means that a dealer's reverse repo haircut is larger than its repo haircut.6 Finally, dealers must have the flexibility to use any excess funds they reap from reuse for their own benefit. This underscores that the risk of a collateral run does not have to be related to the riskiness of the collateral itself, but rather to how the intermediary uses any excess funds from reuse.
Under these three conditions, cash borrowers are exposed to losing the overcollateralization of their SFTs. Moreover, because of the dealer's discretion to use said overcollateralization, borrowers' claims may be pooled with the claims of others, creating a first mover advantage to withdraw collateral, resulting in a run.
In today's financial markets, two of the three conditions are already met. In effect, an important part of primary dealers' activity involves the reuse of collateral, and much of this activity is done through repos, which gives dealers the flexibility to use any windfall they acquire.7 However, it is unclear to what degree dealers have the ability to set different contracting terms between borrowers and lenders to reap liquidity from reuse. Our proposed measure attempts to capture this difference in contracting terms, and can be a useful tool to monitor collateral-run risk.
Monitoring collateral run risk
The FRBNY's weekly primary dealer survey asks respondents to report their long and short securities positions and the amount of funds received and extended through outgoing and incoming SFTs. The difference between funds that come in from sales and outgoing SFTs, and funds that go out from purchases and incoming SFTs is a measure of dealers' liquidity windfall from reuse.
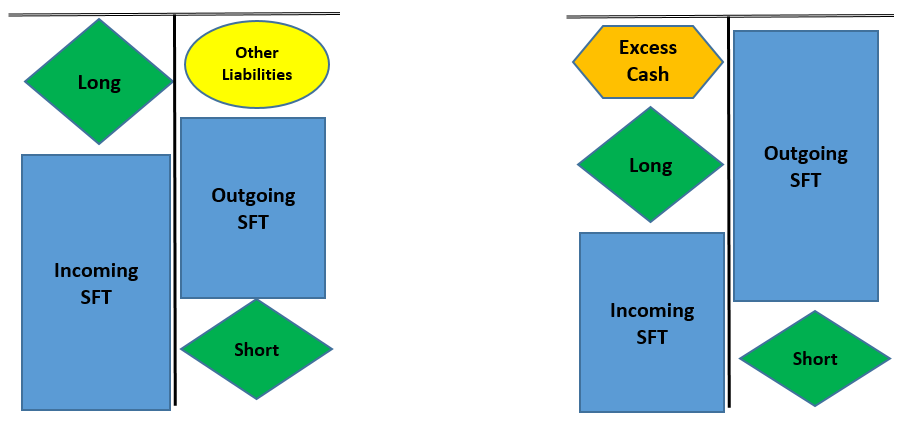
To understand this measure, Figure 1 shows the balance sheet of two stylized dealers for a given collateral class. In this example, balance sheet entries can come in one of four forms: outright security positions (green diamonds), SFTs (blue squares), equity or other unsecured liabilities (yellow ovals), and excess cash (orange triangles). Although it is typically treacherous to match specific assets with liabilities, because the focus is on collateralized transactions, we can identify corresponding assets and liabilities per collateral class. The balance sheet on the left illustrates a dealer that is not reaping any additional funds from reuse. All of its long positions and SFTs are wholly backed by either short positions, SFTs, or other liabilities. The balance sheet on the right, however, illustrates a dealer extending less funds than it receives, resulting in an additional cash windfall. Note that in this latter case, the dealer does not need any unsecured liabilities to finance its activity; its short positions and secured funding are large enough to finance its long positions and secured financing, within a collateral class.
With this concept in mind, we can use the FR 2004---weekly survey of primary dealers' market activities which includes their positions and funding---to have an estimate of a dealer's windfall from reuse.8 It is simply the sum of a dealer's short position and outgoing SFT minus the sum of their long position and incoming SFT lending
$$$$ \text{RRW} = \frac{{Short\ Postion} + {Outgoing\ SFT} - ({Long\ Position} + {Incoming\ SFT})}{{Outgoing\ SFT}} $$$$
In order to understand the order of magnitude of the liquidity windfall, we normalize it![]() by the total amount of secured financing, that is, outgoing SFTs. This calculation results in the relative reuse windfall measure. A large and positive value suggests that a significant amount of a dealer's available liquidity comes from different contracting terms between borrowers and lenders. In this case, their cash borrowers are at greater risk of losing their collateral, and thus, the dealer is more exposed to a collateral run. We expect these risks to be more salient if the total volume of activity is large, creating more of a coordination problem; and if the underlying market is relatively uncompetitive, giving dealers more market power to increase cash borrowers' haircuts.
by the total amount of secured financing, that is, outgoing SFTs. This calculation results in the relative reuse windfall measure. A large and positive value suggests that a significant amount of a dealer's available liquidity comes from different contracting terms between borrowers and lenders. In this case, their cash borrowers are at greater risk of losing their collateral, and thus, the dealer is more exposed to a collateral run. We expect these risks to be more salient if the total volume of activity is large, creating more of a coordination problem; and if the underlying market is relatively uncompetitive, giving dealers more market power to increase cash borrowers' haircuts.
Infante and Vardoulakis (2020) calculate the RRW for Bear Stearns, and the average of the remaining dealers in the period leading up to the Financial Crisis, across all collateral classes. They find that before Bear Stearns demise, their RRW reached up to 30% whereas the average of the dealer sector was close to zero. This suggests that part of Bear Stearns' liquidity problems came from the withdrawal of their cash borrowers.
What we find
Figure 1 shows the RRW quartiles across all primary dealers for all the SFTs reported in the FR 2004. We find that on aggregate, across all securities, the 75th percentile of RRW fluctuates between 0 and 10%. In relative terms, this may seem small, but given the size of some primary dealers' repo book, the dollar amount could be sizable. We see important differences when looking across collateral classes. The RRW for U.S. Treasuries is small, which is likely due to the smaller likelihood of there being significant dealer market power in the US Treasury market, and the different economic motives to intermediate repo.9 We find significantly larger values for RRW in the Agency MBS, suggesting that cash borrowers have a high exposure to losing their collateral. This is concentrated in firms that are relatively more active in the Agency MBS market, consistent with Infante (2019) prediction that cash borrowers accept larger haircuts for collateral classes that are more correlated with an intermediary's default. There are also specific contracting types in the Agency MBS market, which could produce a high RRW without necessarily implying a high windfall, but still capturing a higher risk exposure (see the Caveats section for details). Curiously, for corporate securities, the riskiest asset class we consider, the RRW is relatively small, suggesting that an important fraction of dealers' corporate security activity is financed through non-SFTs.
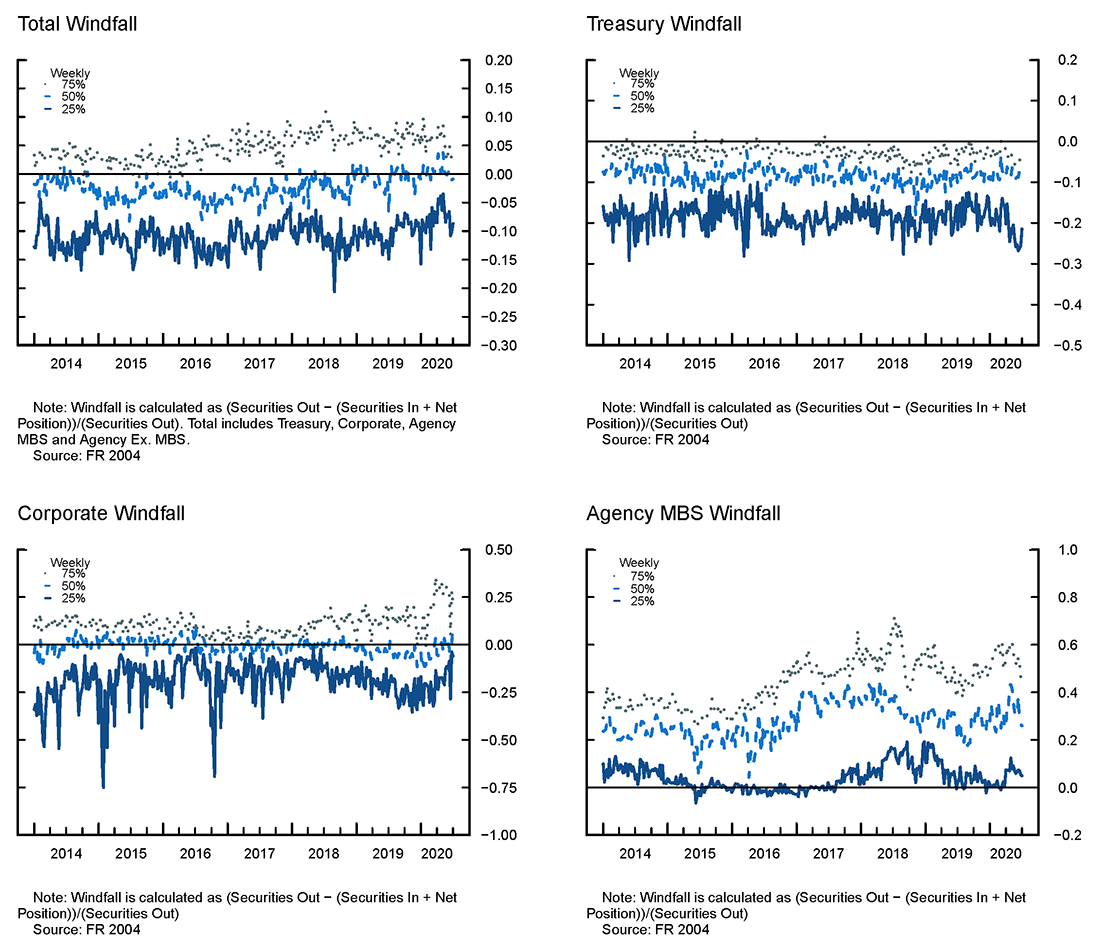
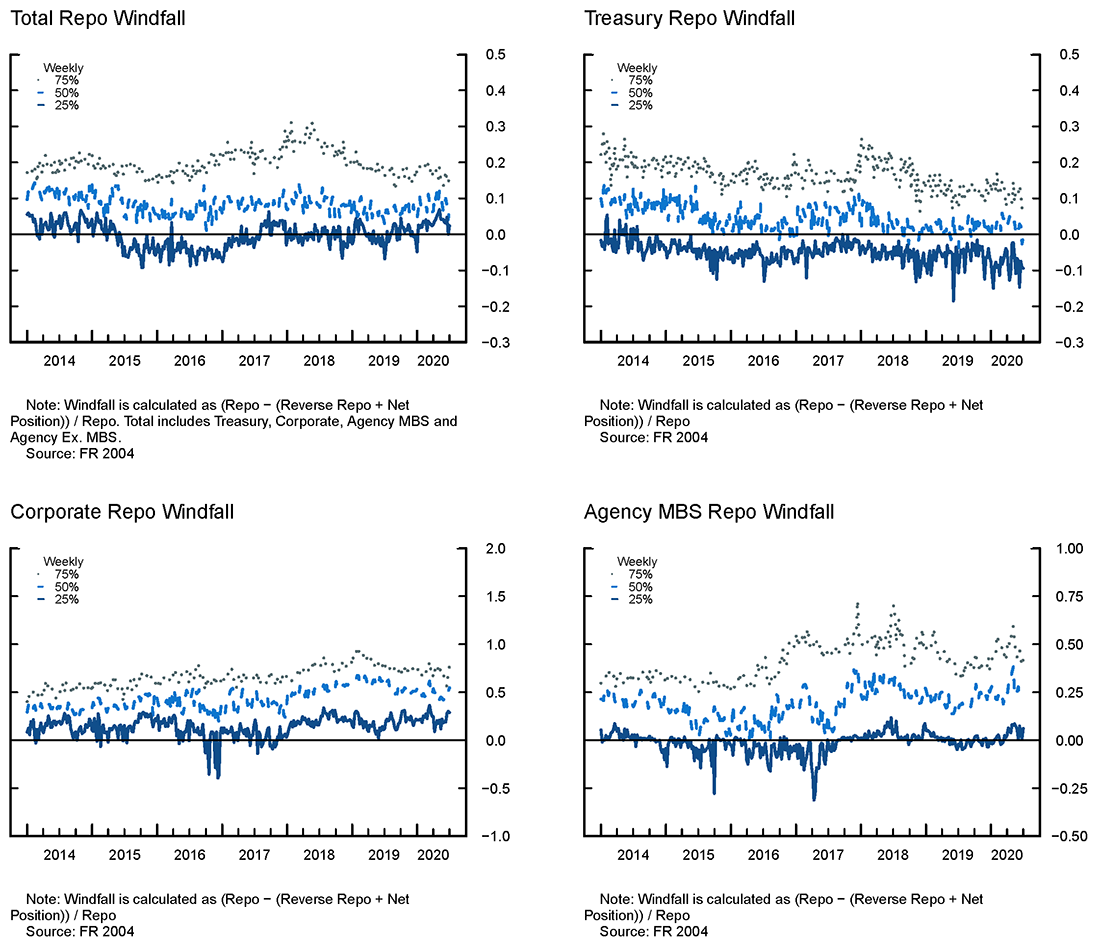
Figure 2 shows the RRW quartiles across all primary dealers focusing only on repos. The reason behind separating the analysis is that there are less regulatory and contractual restrictions on repo, which could possibly alter dealers' behavior. Given that the use of repo is ubiquitous in fixed income markets the repo measure still captures a significant portion of dealers' activity. The figure provides a similar qualitative message, but underscores the important role of repo. Here the windfall of the 75th percentile is higher across all collateral classes except for Agency MBS. It is particularly interesting to see that 75th precentral of the RRW for US Treasuries is larger than 10%, which is a sizable amount given the size of the Treasury repo market. It is important to note that even though the collateral may be safe the risks of a collateral run may still be large. In effect, the RRW estimates the amount of excess cash the dealer extracts from its reuse activity that, in principle, could be used for any type of risky activity.
Concluding Remarks:
Primary dealers' high degree of securities reuse through SFTs exposes them to a relatively unexplored source of risk: a withdrawal from their secured borrowers, i.e., a collateral run. We propose a measure to gauge primary dealers' exposure to collateral runs, which may be an important tool to monitor dealers' resiliency. Collateral runs are markedly different from traditional banks runs (or other liability driven runs) and call for different regulatory initiatives to mitigate them. Future work studying dealer market resiliency should consider these risks.
Caveats
The RRW is designed to capture the amount of funds the dealer receives, but does not distribute, when it reuses collateral. However, there are a few issues regarding data that may affect the measure's interpretation:
- The RRW is a lower bound: The left-hand-side of Figure 1 illustrates how unsecured funding liabilities may alter the interpretation of the RRW. For example, a firm with a large amount of equity outstanding would appear to have a negative RRW. This certainly makes the firm safer. However, there could still by significant differences in contracting terms between cash borrowers and lenders, which put cash borrowers at risk and gives them incentives to withdraw.
- Forward positions: The FR 2004 asks respondents to also report their long and short forward positions. This alters the interpretation of the RRW as these positions are promises to exchange cash and securities in the future, and thus, do not affect the amount of cash or securities the dealer has today.
This issue might be particularly acute for Agency MBS. In effect, a large amount of trading in this market is through the to-be-announced (TBA) forward market and dollar rolls, which are essentially two offsetting forward contracts of the cheapest to deliver MBS, one front month and one future month.10 Dealers trading forwards may take offsetting positions before settlement, eliminating the exchange of cash and securities, and thus, the RRW. In the specific context of dollar rolls, if a dealer were to sell a large amount of dollar rolls of them, without engaging in an offsetting trade, once the front month matures the dealer would have to take position of the underlying MBS. It is reasonable to think that this purchase would be finance through an SFT. Thus, in the data, we would observe a small net position along with a large repo position. This would increase the RRW. - SFTs to intermediate collateral: The standing assumption of this memo is that the economic motive behind these SFTs are to intermediate cash, which imply positive haircuts. If the economic motive were to source collateral, haircuts would be negative.11 Infante (2019) shows that intermediating repo to source assets would imply a positive windfall for the dealer, as the outgoing SFT haircut would be "less negative". However, this would reduce RRW.
It is important to note that irrespective of these three caveats, a larger RRW is still evidence of a riskier position as it may be due to either less equity or a larger short position in forwards. Thus, regardless of the interpretation, a higher RRW indicates more risk taking.
References
Duffie, D. (2013), "Replumbing our financial system: Uneven progress," International Journal of Central Banking 9 (1), 251–279.
Baklanova V., Caglio, C., Cipriani, M., and Copeland, A. (2019), "The use of collateral in bilateral repurchase and securities lending agreements," Review of Economic Dynamics 33: 228-249.
Financial Stability Board (2014), "Strengthening Oversight and Regulation of Shadow Banking: Regulatory framework for haircuts on non-centrally cleared securities financing transactions,'' October 14, 2014, http://www.fsb.org/wp-content/uploads/r_141013a.pdf.
Gao, P., Schultz, P., and Song, Z. (2017), "Liquidity in a Market for Unique Assets: Specified Pool and To‐Be‐Announced Trading in the Mortgage‐Backed Securities Market," The Journal of Finance 72(3), pp.1119-1170.
Infante, S. (2019), "Liquidity windfalls: The consequences of repo rehypothecation," Journal of Financial Economics 133 (1), 42–63.
Infante, S., Press, C., and Saravay, Z. (2020), "Understanding collateral reuse in the U.S. financial system," AEA Papers and Proceedings (forthcoming)
Infante, S., Press, C., and Strauss, J. (2018), "The ins and outs of collateral reuse," FEDS Notes. Washington: Board of Governors of the Federal Reserve System, December 21, 2018, https://doi.org/10.17016/2380-7172.2298.
Infante, S. and Vardoulakis, A.P. (2018), "Collateral Runs", FEDS WP 2018-022.
1. Secured funding transactions include repurchase agreements (repos), securities lending contracts, and collateral swaps. These transactions are economically equivalent to secured loans backed by financial assets. Return to text
2. See the Financial Stability Board (2014). Return to text
3. For example, Duffie (2013) describes how the withdrawal of cash borrowers was a potential risk that materialized during the crisis. Infante and Vardoulakis (2020) theoretically show how this type of fragility can arise. Infante (2019) shows how different contracting terms can arise across markets because of dealers' reuse of collateral. Return to text
4. Intermediating funds between cash lenders and cash borrowers overcomes regulatory and institutional restrictions that can bar counterparties from interacting with each other directly. Return to text
5. See Infante, Press, Saravay (2020) for a discussion of the magnitude of collateral reuse in the U.S. financial system, and of its possible drivers. Return to text
6. In a frictionless bankruptcy regime, the cash borrowers would have access to the cash lender's overcollateralization in case of a dealer default. However, in practice, it is more likely that the cash borrower's claim would be pooled with the rest of the dealer's unsecured claims, suggesting that the real exposure is closer to the cash borrower's overcollateralization of their SFT. Return to text
7. Importantly, the windfall acquired is considered to be encumbered and, thus, does not qualify as a High Quality Liquid Asset (HQLA) to ease liquidity regulations. As a result, the incentive to use the windfall for proprietary purposes is not mitigated by liquidity regulation. See Infante, Press, Strauss (2018) for the different types of SFTs dealers use and the relative importance of repo. Return to text
8. The RRW is not a precise measure of the liquidity windfall because 1) we cannot account for the dealers other funding liabilities, 2) long and short positions include forward contracts, and 3) if the economic motive for reuse is to source securities, haircuts can be negative. Irrespective of these caveats, we argue that a high RRW is still an indication of relatively riskier dealer activity. See section Caveats to understand the limitations, and alternative interpretations, of this measure. Return to text
9. Specifically, when the economic motive is to source specific collateral repo haircuts can be negative. See the Caveats section for more details. Return to text
10. See Gao et al. (2017) for details about the TBA market. Return to text
11. Baklanova et al. (2019) confirm that haircuts in the bilateral repo market can be negative. Return to text
Sebastian Infante and Alexandros P. Vardoulakis (2020). "Monitoring Risk From Collateral Runs," FEDS Notes. Washington: Board of Governors of the Federal Reserve System, July 31, 2020, https://doi.org/10.17016/2380-7172.2605.
Disclaimer: FEDS Notes are articles in which Board staff offer their own views and present analysis on a range of topics in economics and finance. These articles are shorter and less technically oriented than FEDS Working Papers and IFDP papers.