FEDS Notes
March 01, 2018
Predicting Recession Probabilities Using the Slope of the Yield Curve
Peter Johansson (Federal Reserve Bank of New York) and Andrew Meldrum
The spread between the yields on long- and short-maturity nominal Treasury securities narrowed in 2017, prompting considerable attention from market commentators and policy makers. For example, in the December 2017 FOMC meeting some participants "expressed concern that a possible future inversion of the yield curve, with short-term yields rising above those on longer-term Treasury securities, could portend an economic slowdown, noting that inversions have preceded recessions over the past several decades," whereas "a couple of other participants viewed the flattening of the yield curve as an expected consequence of increases in the Committee’s target range for the federal funds rate, and judged that a yield curve inversion under such circumstances would not necessarily foreshadow or cause an economic downturn."1 Treasury yields have risen since the start of 2018, although the spread between long- and short-maturity yields remains close to the low levels reached in late 2017.
In this FEDS Note, we examine the predictions of various models and recent surveys of the probability of a recession in the near term. We find that a model relating the probability of a recession at some point within a year to the slope of the yield curve implies that the probability of a recession has indeed risen as the yield curve has become flatter over recent years. However, the current predicted recession probability is lower if we extend the model to account for more information from the yield curve or from corporate bond spreads; or if we adjust the slope of the yield curve to account for term premiums. Recent surveys of professional economists also point to a lower probability of a recession in the next year than the model based on the unadjusted slope of the yield curve. However, surveys also suggest that the flattening of the yield curve over the past several years is due in part to slower expected GDP growth over a longer horizon.
Movements in the Slope of the Yield Curve since the Most Recent Recession
Despite a slight increase in the slope of the yield curve in 2018, the spread between the yields on long- and short-term Treasury securities remains close to its narrowest level since the recession of 2007 to 2009. Between the end of that recession in the second quarter of 2009 and the first quarter of 2018,2 the yield on a three-month Treasury bill (shown by the pink line in Figure 1) rose by about 1.3 percentage points on net, which primarily reflected the gradual removal of monetary accommodation by the FOMC since December 2015. However, between 2009Q2 and 2018Q1, the yield on a ten-year Treasury security (the green line) fell--by about 1.1 percentage points on net. As a result, the "term spread" of the ten-year yield minus the three-month yield, shown in Figure 2, narrowed by about 2.4 percentage points, to about 1.2 percentage points.3
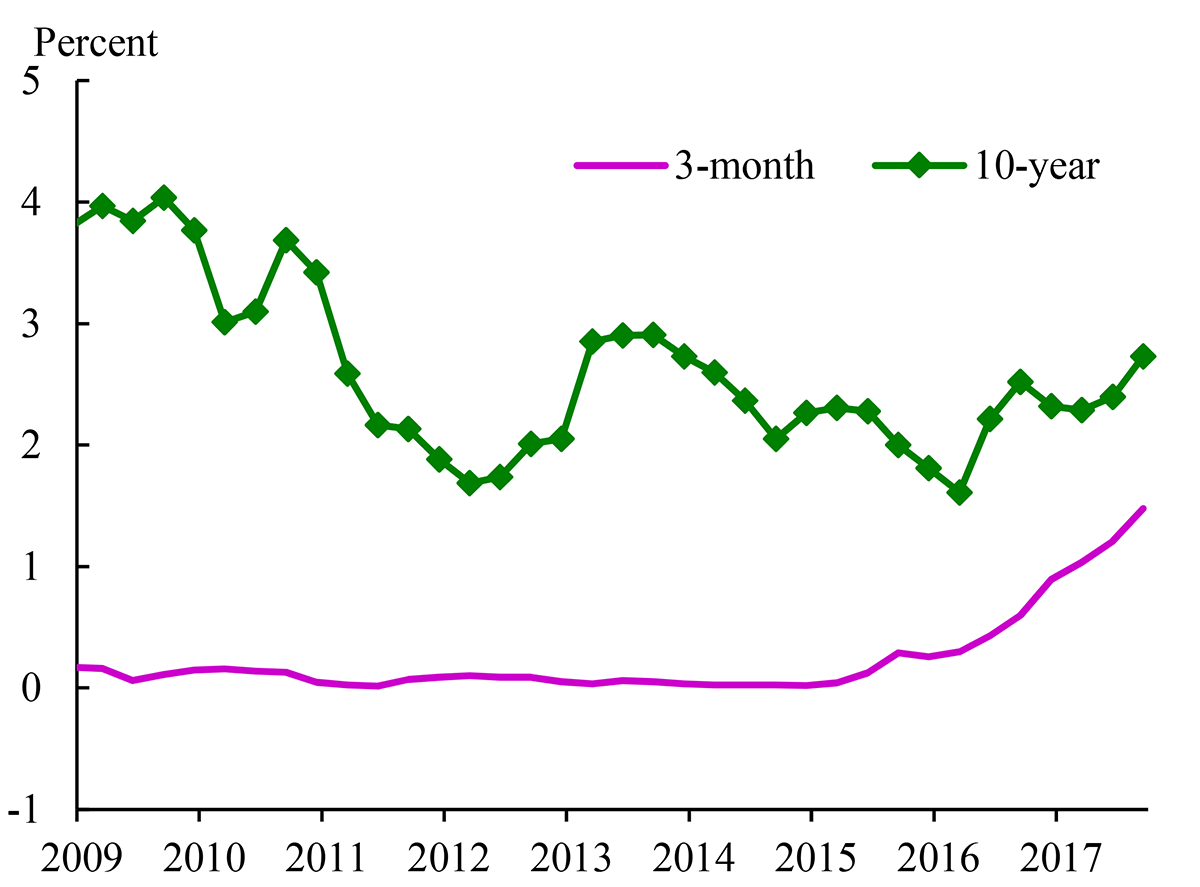
Note: The figure plots quarterly averages of the three-month Treasury bill yield and the estimated ten-year zero-coupon yield (the value for 2018Q1 is the average to February 26, 2018). Labels on the x-axis refer to the mid-points of each year.
Sources: Board of Governors of the Federal Reserve System, Federal Reserve Bank of New York and Board staff calculations.
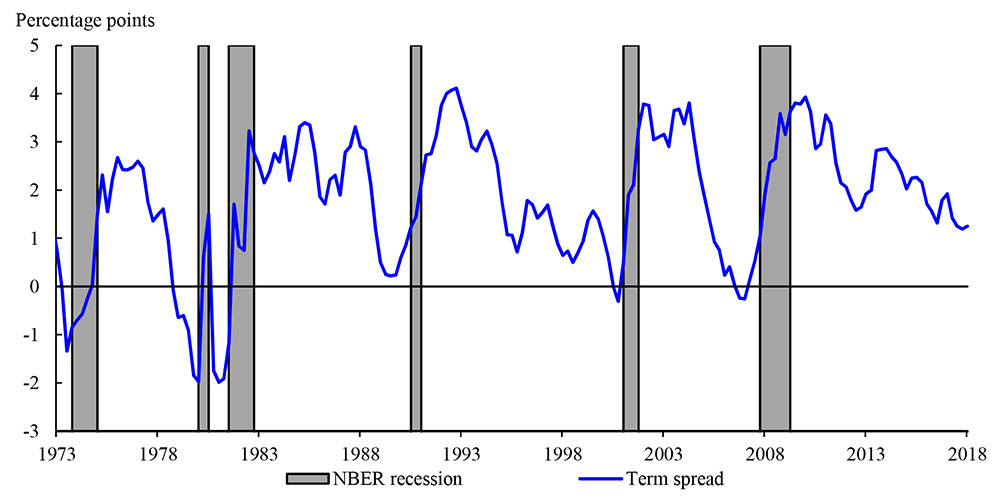
Note: The term spread is the ten-year minus the three-month yield (see notes to Figure 1 for further details). The figure shows quarterly average values of the spread (the value for 2018Q1 is the average to February 26, 2018). The gray shaded areas indicate quarters in which there was an NBER-dated recession at any point in the quarter.
Sources: Board of Governors of the Federal Reserve System, Federal Reserve Bank of New York, NBER, and Board staff calculations.
Figure 2 also shows that the ten-year minus three-month term spread narrowed prior to each of the six most recent recessions dated by the National Bureau of Economic Research (NBER); and that the yield curve was inverted according to this measure prior to five of those recessions. Indeed, there is a large literature documenting more formally the negative relationship between measures of the slope of the yield curve and the probability of a subsequent recession--for example, Estrella and Hardouvelis (1991), Estrella and Mishkin (1997, 1998), Wright (2006), and Ergungor (2016). Thus, while the yield curve is not currently inverted, the flattening of the yield curve over recent years nevertheless raises the question of whether the probability of a near-term recession has risen.
A Univariate Probit Model of Recession Probabilities
Studies relating the slope of the yield curve to the probability of a recession typically estimate probit models of the form
$$$$ Pr\left({NBER}_{t+i,t+j}=1\right)=\Phi \left(\beta_0+\beta_1{SPR}_t\right), (1) $$$$
where $${NBER}_{t+i,t+j}$$ is a 0/1-indicator variable that equals 1 if and only if there is an NBER-dated recession at some point during periods $$t+i$$ and $$t+j$$, $${SPR}_t$$ is a measure of the slope of the yield curve in period $$t$$, and $$Φ$$(.) denotes the standard normal cumulative distribution function.
We estimate a quarterly version of model (1) that explains the probability of a recession at any point in time between one and four quarters ahead using the average ten-year minus three-month term spread as the explanatory variable.4 We estimate the model using data from 1973Q1 to 2007Q4;5 we end the sample in 2007Q4 to avoid possible distortions to model parameter estimates caused by the proximity of three-month yields to the lower bound over much of the subsequent period. We then use the estimated parameters to generate recession probabilities for all quarters up to 2018Q1.
The probability of a recession at some point in the next year predicted by this univariate probit model (shown by the black line in Figure 3) rises sharply ahead of each of the six most recent recessions. And since the end of the most recent recession, in 2009Q2, the predicted probability has risen from close to zero to about 30 percent in 2018Q1, reflecting the net flattening of the yield curve discussed above. However, the predicted probability in 2018Q1 remained statistically significantly below the levels ahead of the six most recent recessions: The 95 percent confidence interval for the predicted probability in 2018Q1 (shown by the dashed red lines) covered a range of probabilities between about 20 and 40 percent, whereas the point estimates for the predicted probabilities reached levels above 60 percent prior to each of the six most recent recessions.
Figure 3: Predicted Recession Probability from a Probit Regression Using the Term Spread as the Explanatory Variable
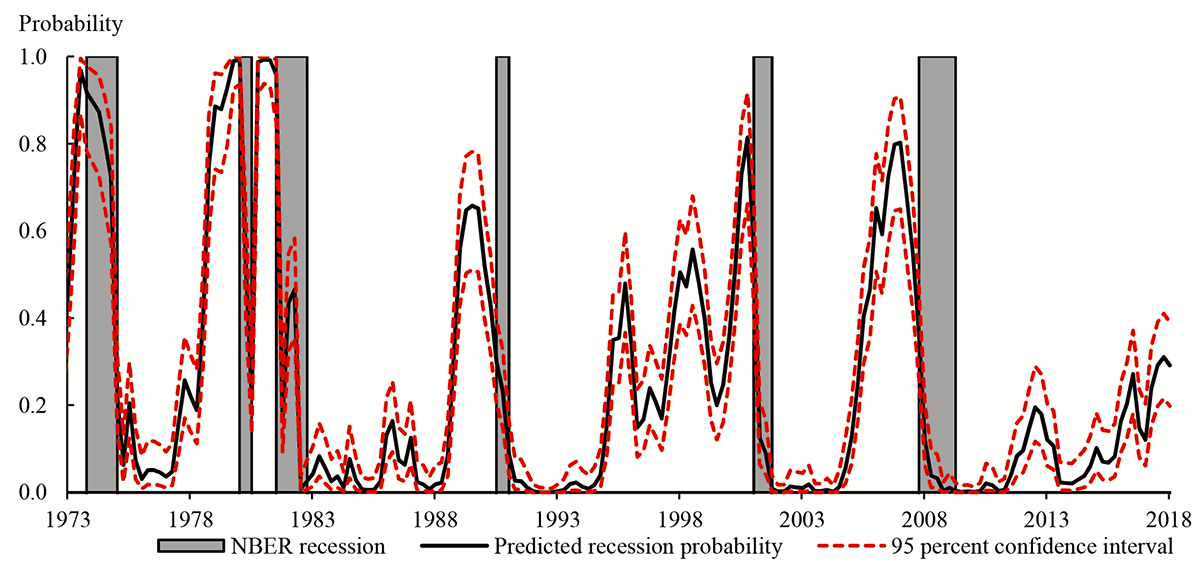
Note: The predicted probability (and the associated confidence interval) refers to the probability of a recession at some point in quarters t+1 to t+4, based on the probit model in equation (1). The gray shaded areas indicate quarters in which there was an NBER-dated recession at any point in the quarter.
Sources: Board of Governors of the Federal Reserve System, Federal Reserve Bank of New York, NBER, and Board staff calculations.
Extending the Univariate Probit Model
While the univariate probit model in equation (1) points to a rise in the probability of a near-term recession over the past several years, it has a number of important limitations and we should be cautious about relying too heavily on its predictions. Indeed, there are times in the past when the predicted probabilities shown in Figure 3 seem rather unsatisfying. For example, during the most recent recession, the predicted probability of a recession in the next year fell close to zero in early 2008, whereas survey-based measures at that time indicated much higher probabilities--for example, the mean probability of a recession starting in the next 12 months reported by respondents to the February 2008 Blue Chip Economic Indicators survey6 was about 50 percent (and, with the benefit of hindsight, we know that the recession continued until 2009Q2 according to the NBER). The reason that the model implies a low predicted recession probability during 2008 is that the slope of the yield curve was actually relatively steep at that time, as the FOMC lowered the target federal funds rate in anticipation of an economic slowdown.
One reason why the univariate probit model may sometimes provide misleading predictions for recession probabilities is that it likely omits other variables that help predict recessions. For example, Wright (2006) shows that a probit model that includes a short-term interest rate as an explanatory variable alongside the term spread achieves a better in-sample fit.7 And there is potentially information in an even wider range of Treasury yields. We therefore estimate a version of the probit model that replaces the slope of the term structure with the first three principal components of yields, that is:
$$$$ Pr\left({NBER}_{t+1,t+4}=1\right)=\Phi \left(\delta_0+\delta_1{PC}_{1,t}+\delta_2{PC}_{2,t}+\delta_3{PC}_{3,t}\right), (2) $$$$
where $${PC}_{1,t}$$ denotes the ith principal component of Treasury yields in quarter t.8,9 While model (2) gives predicted probabilities (shown in the pink line in Figure 4) that are similar to those implied by model (1) for most of the sample period, model (2) has predicted lower recession probabilities over the period since the end of the most recent recession.
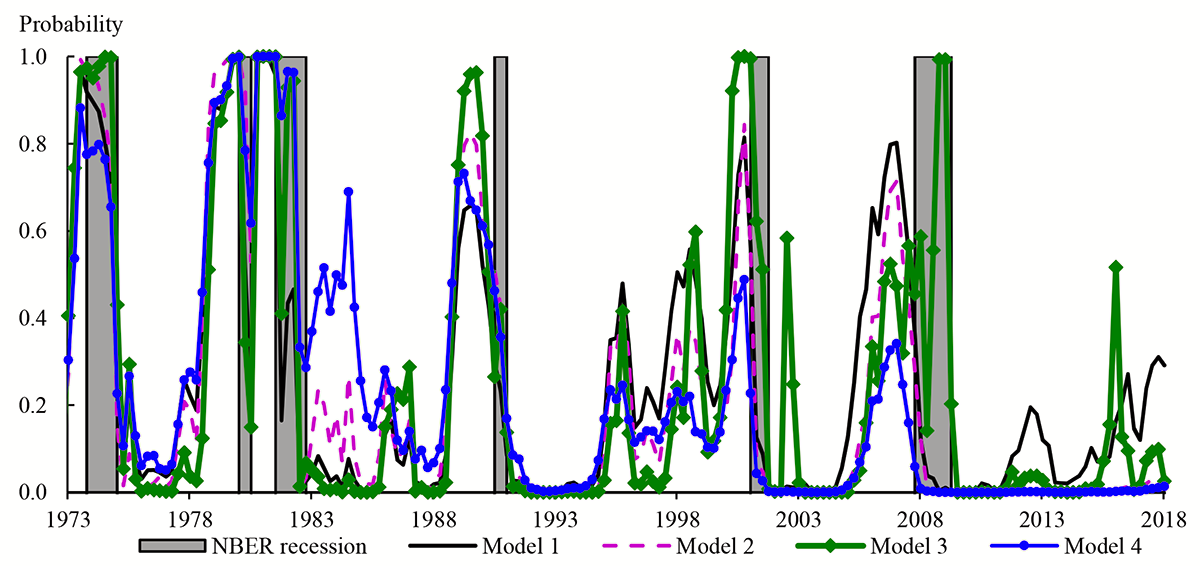
Note: The predicted probability (and the associated confidence interval) refers to the probability of a recession at some point in quarters t+1 to t+4. The gray shaded areas indicate quarters in which there was an NBER-dated recession at any point in the quarter.
Sources: Board of Governors of the Federal Reserve System, Favara et al (2016b), see https://www.federalreserve.gov/econresdata/notes/feds-notes/2016/updating-the-recession-risk-and-the-excess-bond-premium-20161006.html; Federal Reserve Bank of New York; Kim and Wright (2005), see https://www.federalreserve.gov/pubs/feds/2005/200533/200533abs.html; NBER; and Board staff calculations.
Although model (2) incorporates more information about the shape of the yield curve than model (1), it retains the unsatisfying feature that the predicted probability of a near-term recession fell close to zero in early 2008. This may be because model (2) still omits important information for predicting recessions that is not captured by the yield curve.10 Indeed, recent work by Favara et al (2016a) has shown that the "excess bond premium" of Gilchrist and Zakrajšek (2012)--that is, the component of corporate bond spreads in excess of an estimate of the compensation for expected default losses--is positively related to the probability of a near-term recession; and that a probit model with the excess bond premium as an explanatory variable can generate high predicted recession probabilities during 2008.11 We therefore also estimate a probit model that includes the excess bond premium as an explanatory variable, in addition to the term spread, that is:
$$$$ Pr\left({NBER}_{t+1,t+4}=1\right)=\Phi \left(\gamma_0+\gamma_1{SPR}_t+\gamma_2{EBP}_t\right), (3) $$$$
where $${EBP}_t$$ is the average value of the excess bond premium of Favara et al (2016b) in quarter t, which we plot in Figure 5.12 The green line in Figure 4 shows the predicted recession probabilities from model (3). It produces broadly similar predicted recession probabilities to models (1) and (2) for most of the sample. However, the recession probabilities from model (3) are higher than those from models (1) and (2) during 2008, and lower than those from model (1) during most of the period since the end of the last recession (the exception being a temporary rise in early 2016).
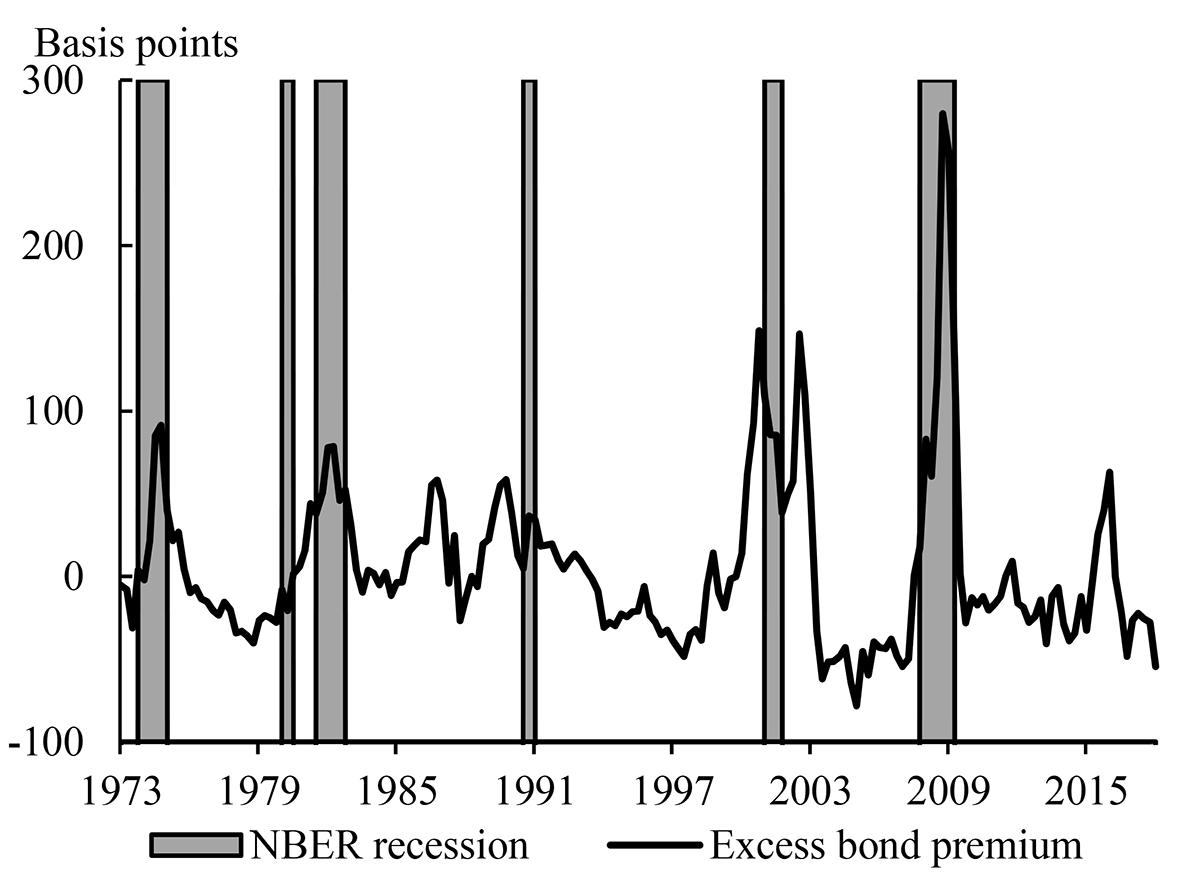
Note: The figure shows quarterly average values of the excess bond premium (the value for 2018Q1 is for January 2018). The gray shaded areas indicate quarters in which there was an NBER-dated recession at any point in the quarter.
Sources: Favara et al (2016b), NBER, and Board staff calculations.
Another possible drawback of model (1) is that it does not distinguish between changes in the ten-year yield caused by changes in expectations of average future short-term interest rates and the term premium that compensates investors for interest rate risk; indeed, Ang et al (2006) find that the expected rate component of the term spread accounts for most of its predictive power for future GDP growth.13 One possible explanation why the expected rate component might be the most informative is that the times when short-term interest rates are relatively high compared with expectations of their long-run averages level tend to be the times when the stance of monetary policy is relatively restrictive, which tend to be followed by periods of relatively low economic growth.14
Part of the explanation for the flattening of the yield curve in recent years is that term premiums in long-term yields have likely fallen (Bauer (2017) discusses some of the potential explanations for falls in term premiums since December 2016). And looking back over a longer period, estimates of term premiums have fallen over the past few decades. For example, Figure 6 shows an estimate of the ten-year term premium based on the model of Kim and Wright (2005)15 according to this model, the ten-year term premium is currently close to zero, well below its peak of around 4 percent in the early 1980s. If the predictive power of the term spread does indeed derive largely from the information in the expected rate component of yields, then a decline in term premiums would mean that we should expect to see a flatter term structure for a given recession probability. Thus, a probit model estimated over a long sample may overstate the current probability of a recession.
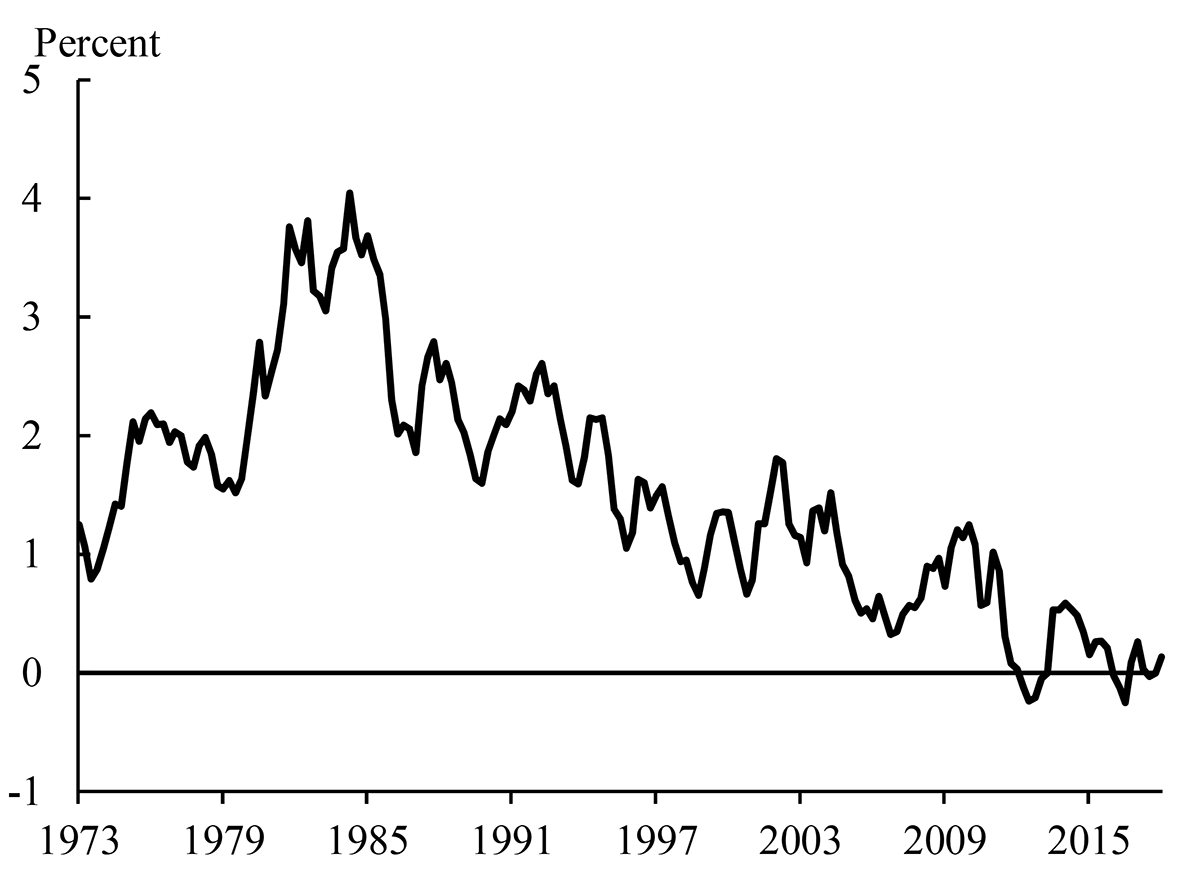
Note: The figure shows quarterly average values of the term premium (the value for 2018Q1 is the average to February 26, 2018). Footnote 15 explains how we extend the estimated term premium back to 1973.
Sources: Federal Reserve Bank of New York, Kim and Wright (2005), and Board staff calculations.
One simple way of accounting for changing term premiums in long-term yields is to estimate a probit model using the term spread adjusted for the term premium as the explanatory variable, that is,16
$$$$ Pr\left({NBER}_{t+1,t+4}=1\right)=\Phi \left(\lambda_0+\lambda_1\left({SPR}_t-{TP}_t\right)\right), (4) $$$$
where $${TP}_t$$ is the estimate of the average ten-year term premium in quarter t.17 The predicted probabilities from model (4) (shown by the blue line in Figure 4) are again broadly similar to those from model (1) for most of the sample period but have been lower since the end of the last recession.
What Do Recent Surveys Tell Us About Recession Probabilities and Longer-Term Growth Prospects?
Recent survey-based measures of near-term recession probabilities also point to lower near-term recession probabilities than model (1) that uses the unadjusted term spread as the only explanatory variable. For example, the average respondent to the February 2018 Blue Chip Economic Indicators survey reported a 19 percent probability that a recession might begin in 2018--lower than the probability of a recession at some point over the next year predicted by model (1) in 2018Q1 but higher than the predicted probabilities from models (2), (3), and (4).18 A similar question was also asked in the December 2011 survey; at that time, the mean probability of a recession by the end of 2012 was 24 percent, which is higher than the predicted probability from any of our models in 2011Q4. Thus, these surveys suggest that the probability of a near-term recession has actually declined slightly since late 2011, despite the fact that the yield curve is now flatter.
Although surveys do not suggest that the probability of a near-term recession has risen on net over recent years, they nevertheless suggest that the expected long-run GDP growth rate has declined, which may provide part of the explanation why long-term interest rates have fallen. The mean response to the Blue Chip Economic Indicators survey of "long-range" GDP growth expectations has come down from 2.6 percent to 2.0 percent between October 2009 and October 2017,19 while the mean response to the Blue Chip Financial Forecasts survey20 of the long-range federal funds rate declined from 4.2 to 3.0 percent between December 2009 and December 2017.21 Thus while most of our models suggest the flattening of the yield curve does not reflect a substantial increase in the probability of a near-term recession, it may still point to lower expected GDP growth in the long run.
Conclusion
In this FEDS Note, we show that a univariate probit regression relating the probability of a recession at some point over the next year to the slope of the yield curve predicts that the near-term recession probability has risen over recent years, despite the slight increase in the slope of the yield curve since the start of 2018. However, if we extend the model to incorporate additional information from the yield curve or add the excess bond premium as an additional explanatory variable, the predicted near-term recession probability is much lower. We also obtain a lower predicted recession probability from a model that adjusts the slope of the yield curve to account for term premiums. Surveys of professional economists similarly indicate a lower near-term recession probability; however, surveys also suggest that part of the explanation for the recent flattening of the yield curve is that the expected GDP growth rate in the long run has declined.
References
Ang, A., M. Piazzesi, and M. Wei (2006), "What Does the Yield Curve Tell Us About GDP Growth?," Journal of Econometrics 131(1-2), pp. 359-403.
Bauer, M. D. (2017), "A New Conundrum in the Bond Market?," Federal Reserve Bank of San Francisco Economic Letter 2017-34, November 20, 2017.
Berge, T. (2014), "Predicting Recessions with Leading Indicators: Model Averaging and Selection Over the Business Cycle," Federal Reserve Bank of Kansas City Research Working Paper 13-05.
Ergungor, O. E. (2016), "Recession Probabilities," Federal Reserve Bank of Cleveland Economic Commentary, August 23, 2016.
Estrella, A. and Hardouvelis, G. A. (1991), "The Term Structure as a Predictor of Real Economic Activity," Journal of Finance 46(2), pp. 555-576.
Estrella, A. and F. S. Mishkin (1996), "The Yield Curve as a Predictor of U.S. Recessions," Federal Reserve Bank of New York Current Issues in Economics and Finance, 2(7).
Estrella, A. and F. S. Mishkin (1998), "Predicting U.S. Recessions: Financial Variables as Leading Indicators," Review of Economics and Statistics 80(1), pp. 45-61.
Favara, G., S. Gilchrist, S., K. F. Lewis, and E. Zakrajšek (2016a), "Recession Risk and the Excess Bond Premium," FEDS Notes. Washington: Board of Governors of the Federal Reserve System, April 8, 2016, http://dx.doi.org/10.17016/2380-7172.1739.
Favara, G., S. Gilchrist, S., K. F. Lewis, and E. Zakrajšek (2016b), "Updating the Recession Risk and the Excess Bond Premium," FEDS Notes. Washington: Board of Governors of the Federal Reserve System, October 6, 2016, https://doi.org/10.17016/2380-7172.1836.
Favero, C. A., I. Kaminska, and U. Söderström (2005), "The Predictive Power of the Yield Spread: Further Evidence and a Structural Interpretation," CEPR Discussion Paper 4910.
Gilchrist, S., and E. Zakrajšek (2012), "Credit Spreads and Business Cycle Fluctuations," American Economic Review 102(4), pp. 1692-1720.
Gürkaynak, R. S., B. Sack, and J. H. Wright (2007), "The U.S. Treasury Yield Curve: 1961 to the Present," Journal of Monetary Economics 54(8), pp. 2139-2682.
Hamilton, J. D. and D. H. Kim (2002), "A Reexamination of the Predictability of Economic Activity Using the Yield Spread," Journal of Money, Credit and Banking 34(2), pp. 340-360.
Joslin, S., M. Priebsch, and K. J. Singleton (2014), "Risk Premiums in Dynamic Term Structure Models with Unspanned Macro Risks," Journal of Finance 69(3), pp. 1197-1233.
Joslin, S., K. J. Singleton, and H. Zhu (2011), "A New Perspective on Gaussian Dynamic Term Structure Models," The Review of Financial Studies 24(3), pp. 926-970.
Kim, D. H. and J. H. Wright (2005), "An Arbitrage-Free Three-Factor Term Structure Model and the Recent Behavior of Long-Term Yields and Distant-Horizon Forward Rates," Federal Reserve Board Finance and Economics Discussion Series 2005-33.
Laubach, T. and J. C. Williams (2003), "Measuring the Natural Rate of Interest," Review of Economics and Statistics 85(4), pp. 1063-1070.
Laubach, T. and J. C. Williams (2016), "Measuring the Natural Rate of Interest Redux," Federal Reserve Board Finance and Economics Discussion Series 2016-011.
Litterman, R. and J. Scheinkman (1991), "Common Factors Affecting Bond Returns," Journal of Fixed Income 1(1), pp. 54-61.
Wright, J. H. (2006), "The Yield Curve and Predicting Recessions," Federal Reserve Board Finance and Economics Discussion Series 2006-07.
1. See "Minutes of the Federal Open Market Committee December 12-13, 2017," available at: https://www.federalreserve.gov/monetarypolicy/files/fomcminutes20171213.pdf. Return to text
2. Throughout this Note, we refer to quarterly averages of daily data on Treasury yields and term premiums. For 2018Q1 we use the average for January 1, 2018 through February 26, 2018. Return to text
3. Other commonly-cited measures of the slope of the yield curve, such as the ten-year yield minus the two-year yield also declined over this period. Return to text
4. The three-month yield that we use is the secondary market yield on a three-month Treasury bill from the H.15 release published by the Board of Governors of the Federal Reserve System at https://www.federalreserve.gov/releases/h15/. The ten-year yield is a zero-coupon yield estimated using the method of Gürkaynak et al (2007), which are available at https://www.federalreserve.gov/pubs/feds/2006/200628/200628abs.html. Return to text
5. Unreported results show that extending the sample back to 1952Q3, to cover an additional four recessions, does not change the broad pattern of movements in the predicted recession probabilities but can result in slightly different point estimates of recession probabilities at times. Return to text
6. Source: Wolters Kluwer Legal and Regulatory Solutions U.S. Blue Chip Economic Indicators survey. Return to text
7. Ang et al (2006) show that the short-term interest rate has more predictive power than the term spread for future GDP growth. Return to text
8. Specifically, we estimate the principal components of the three-month Treasury bill yield and estimated zero-coupon yields on Treasury securities with one, two, three, four, five, and ten years to maturity. We compute the quarterly average of all yields and then estimate the principal component weights for the period from 1973 to 2007, and apply those weights to compute principal components for the full period ending in 2018Q1. Return to text
9.Three principal components should summarize almost all of the information in Treasury yields of different maturities (as shown by, for example, Litterman and Scheinkman (1991)). Using three principal components also has the advantage that we avoid needing to take a stand on which are the most appropriate maturities for computing the slope of the yield curve. Return to text
10. In the term structure literature, variables that are not reflected in the current yield curve are often referred to as being "unspanned" factors. For example, Joslin et al (2014) show that at least some measures of economic activity and inflation are unspanned by the current yield curve. Return to text
11. Berge (2014) considers models with a much wider range of financial and macroeconomic explanatory variables. Return to text
12. Throughout this Note, we refer to quarterly averages of monthly estimates of the excess bond premium. For 2018Q1 we use the estimated value for January 2018. Return to text
13. However, this result may be sensitive to the estimate of the term premium considered. For example, using different decompositions of the long-term yield, Hamilton and Kim (2002) find that both components have predictive power, while Favero et al (2005) find that the predictive power of the term spread comes largely from the term premium component. So we would be cautious about concluding that a model that adjusts the term spread for the term premium is necessarily better than a model that uses the unadjusted term spread. Return to text
14. One obvious drawback of this story is that the slope of the yield curve is an imperfect measure of the stance of monetary policy, which is better measured by how the short-term interest rate compares with the "natural rate" consistent with output equaling its natural rate and constant inflation. Laubach and Williams (2003, 2016) provide further discussion of the natural rate of interest and the stance of monetary policy. Return to text
15. The sample used by Kim and Wright (2005) runs from July 1990 to July 2005. We use Federal Reserve Board staff updates of the model to obtain the term premium up to 2018Q1. We regress the estimated term premiums on observed yields and use the resulting loadings to also extend the estimated term premium back to 1973. Return to text
16. We can think of model (4) as approximately equivalent to a restricted version of model (2) because we can always write the Kim and Wright (2005) term premium as approximately equal to a linear combination of the first three principal components of yields (see Joslin et al (2011)). Including three principal components of yields as explanatory variables may therefore perform much the same role as adjusting the spread for term premiums. Return to text
17. We ignore the term premium in the three-month yield, which is likely to be relatively small. Return to text
18. In the Federal Reserve Bank of New York's December 2017 survey of primary dealers, the median probability attached to a recession in six months' time was 10 percent. Survey results are available at https://www.newyorkfed.org/markets/primarydealer_survey_questions.html. Return to text
19. "Long-range" questions in the Blue Chip surveys ask about averages over a period about six to ten years ahead. Return to text
20. Source: Wolters Kluwer Legal and Regulatory Solutions U.S. Blue Chip Financial Forecasts survey. Return to text
21. Some model-based estimates of longer-run natural rates of interest have also declined over this period--for example, see Laubach and Williams (2016). Return to text
Johansson, Peter, and Andrew Meldrum (2018). "Predicting Recession Probabilities Using the Slope of the Yield Curve," FEDS Notes. Washington: Board of Governors of the Federal Reserve System, March 1, 2018, https://doi.org/10.17016/2380-7172.2146.
Disclaimer: FEDS Notes are articles in which Board staff offer their own views and present analysis on a range of topics in economics and finance. These articles are shorter and less technically oriented than FEDS Working Papers and IFDP papers.